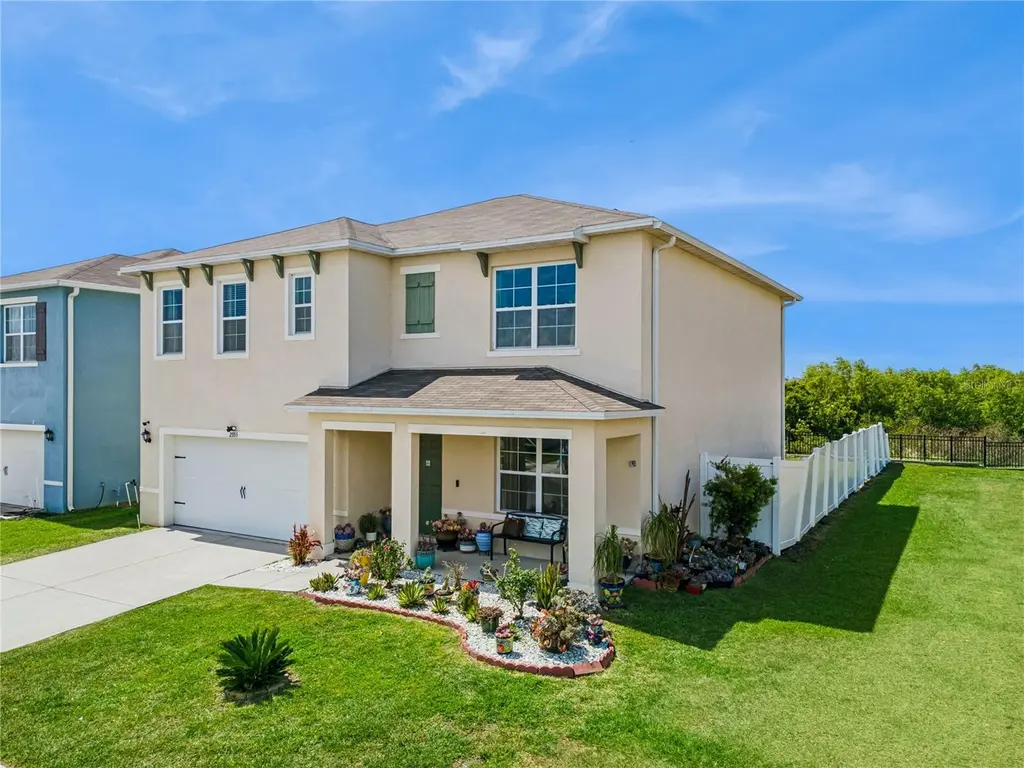
2933 Ivy Lake Ct · Lakeland, FL
Flood risk 1/10 · Minimal
- FEMA flood zone
- X (unshaded)
- Chance of flooding over 30 yrs
- 0.0%
- Est. flood insurance / yr
- $507 – $1,088
Fire risk 5/10 · Moderate
- Est. fire insurance / yr
- $947 – $1,759
Heat risk 8/10 · Major
- Hot days now (above 108°F)
- 7 days/yr
- Hot days in 30 yrs
- 22 days/yr
Wind risk 9/10 · Severe
- Chance of severe wind over 30 yrs
- 99.0%
Air-quality risk 2/10 · Minimal
- Unhealthy air days now
- 1 days/yr
- Unhealthy air days in 30 yrs
- 2 days/yr
Risk factors via First Street. Map © Google.
Why this score? — see what drove the F grade
The composite is a weighted blend of 9 inputs, each scored 0–100. Each bar is that input's sub-score; the figure is the points it added to the 100-point composite (weight × sub-score).
- Cash flow +9.1/30.0
- ARV discount +7.5/15.0
- Livability +3.9/5.0
- Schools +3.5/10.0
- 1% rule +3.0/10.0
- DSCR +2.5/10.0
- Rent growth +2.5/5.0
- Condition / age +2.5/5.0
- Appreciation +0.0/10.0
$375,000
🖨 Deal sheet 📄 Offer letter ✓ Due diligence
Listing remarks
One or more photo(s) has been virtually staged. Spacious and thoughtfully designed Hayden floor plan by D. R. Horton offering over 2,600 sq ft, 5 bedrooms, 3 full bathrooms, and a 2-car garage in a growing Lakeland location. This two-story home features all concrete block construction on both floors and a versatile open-concept layout ideal for modern living. The first floor includes a flex space perfect for a home office or formal dining, along with a guest bedroom and full bath, ideal for visitors or multi-generational living. The kitchen is the heart of the home, showcasing a large center island, walk-in pantry, stainless steel appliances, and abundant cabinetry, all overlooking the spac
Key facts
- Large center island
- Flex space
- Backyard water view
Tags
Property features AI
Finance
- Other: Homestead exemption indicated
- Financial info: Lease restrictions apply
- HOA & community: Community amenities include clubhouse, fitness center, playground and pool; Monthly HOA fee approximately $107 (association: Artemis Lifestyles/Christie Prince); Association fee includes pool and recreational facilities; Pets allowed
Exterior
- Parking: Driveway; Attached garage (2 spaces)
- Utilities: Public water; Public sewer; Electricity connected; Sewer connected; Water connected; Irrigation system
- Home design: Single-family residence; Two levels; Completed construction; Southeast-facing
- Construction: Stucco exterior; Shingle roof; Slab foundation; Built by D.R. Horton (Hayden model)
- Exterior features: Covered front porch; Patio; Sliding doors; Storage; Gazebo; Sidewalks; Vinyl fencing; Mature landscaping with trees; Landscaped yard; Cleared lot; Conservation area nearby; Paved access (public maintained road)
Interior
- Kitchen: Cooktop; Range; Microwave; Dishwasher; Disposal; Refrigerator; Stone countertops; Eat-in kitchen; Kitchen open to family room
- Bedrooms: 5 bedrooms
- Flooring: Carpet; Tile
- Bathrooms: 3 full bathrooms
- Heating & cooling: Central heating (electric); Central air conditioning
- Interior features: Ceiling fans; Eat-in kitchen; High ceilings; Kitchen/family room combo; Open floorplan; Split bedroom layout; Stone counters; Thermostat; Walk-in closets
- Laundry & utility: Washer; Dryer; Inside laundry room on upper level; Water softener; Electric water heater; Inside utility
Neighborhood map
What this means for you Summary
Snapshot
- This is a 4-bed/3.0-bath single-family listed at $375k.
Deal economics
- At list price, monthly cash flow is $-290 ($-3k/yr) — negative.
- To cash-flow at today's rent, offer at most $324k (13.7% below list).
- To meet the 1% rule (rent ≥ 1% of price), the offer needs to be $300k (20.1% below list).
- Recommended offer: $300k (20.1% below list) — sets the bar for 1% rule.
Location & tenants
- Location reads 77/100 on livability (#206 in FL, #3,179 nationally) — a middle-class / working-renter tenant base. Strengths: cost of living A+, housing A+, health & safety A+; Watch: employment D+, amenities F, commute F.
- Polk (suburban): math 39% / reading 43% proficiency, ranked #62 of 73 in FL (top 85%) — families likely to look elsewhere, expect single-tenant / working-renter base with shorter leases.
- Zoned schools: Jesse Keen Elementary School (math 20% / reading 21%, grade F, #2,094 of 2,144 statewide, top 98%, 649 students, 67% FRL); Kathleen Senior High School (math 19% / reading 31%, grade F, #501 of 667 statewide, top 75%, 2,051 students, 59% FRL) — zoned schools at 63% FRL track the district average.
- Zoned-school proficiency averages 23% at this address vs 41% district-wide (-18 pts) — the specific schools serving this property underperform the Polk average; the district grade overstates school quality for this exact location.
- Market conditions: Rents soft (-0.2%/yr); 360 active listings in the ZIP; 7 comparable units currently listed for rent nearby; rentals leasing fast (median 10d on market — plan ~1-2 weeks tenant-placement turnaround); solid renter incomes; 10,384 units permitted in Polk County in 2024 (1,716 in 5+ unit buildings).
- This rent runs 40% of the median local income ($90k/yr) — at the standard rent-burdened threshold; future hikes will face affordability resistance.
Forward outlook
- Local home prices are declining (-3.0%/yr); year-one equity from $3k of loan paydown is wiped out by about $11k of value loss. Plan a longer hold.
- Polk County population projected at +33% by 2050 — long-run rental-demand tailwind backs the buy-and-hold thesis.
Negotiation context
- It's been on market 70 days — a 6% lower offer ($352k) is reasonable based on typical stale-listing flexibility.
Risks & watch-outs
- Climate carrying-cost: severe wind risk, 99% chance of damaging wind over 30y; moderate wildfire risk; extreme-heat days projected 7→22/yr by 2055 (HVAC capex compounding) — expect insurance premiums to compound above CPI over the hold.
Questions for the listing agent
- What do current leases actually rent for vs. the listed asking? Can we see a recent rent roll and the last 12 months of T-12 income?
- It's been on market 70 days. Have you received any prior offers? Is the seller open to a 20% concession, seller financing, or rate buy-down credit?
- What does the HOA fee cover, when was the last increase, and are there any pending special assessments or reserve-fund shortfalls?
- Why hasn't it sold? Are there any deal-killer items the seller is aware of (foundation, flood, title, zoning, code violations)?
- Is there a deadline driving the sale (1031 exchange, divorce, estate, relocation)? That informs how much negotiation room exists.
- The area grade is low — what's the realistic commute time and amenity access for the typical tenant pool here? Any planned neighborhood developments (good or bad) we should know about?
- What's the average days-on-market for RENTAL listings here right now (not sales)? A rising rental-DOM trend means longer vacancies and softer asking-rent achievability than the comps imply.
- What's the recent tenant-quality profile in this submarket — average credit score on applications, eviction rate, late-payment / NSF rate, and stable-employment percentage? A property-management company in the area should have these aggregated.
- How much new for-sale + rental construction is in the pipeline within 1–3 miles? Heavy new supply typically softens prices + rents 12–24 months out; constrained supply supports both.
Investment metrics
- 1% rule
- 0.80% ✗
- Cap rate
- 5.37%
- Cash-on-cash
- -3.31%
- DSCR
- 0.85
- GRM
- 10.4
CMA / ARV
No comps found within radius.
Projected returns pro-forma
-3.0% appreciation · 0.0% rent growth · sell at horizon
- IRR
- -25.3%
- Equity multiple
- 0.16×
- Total profit
- $-87,930
- Equity at exit
- $55,914
- IRR
- -35.0%
- Equity multiple
- -0.28×
- Total profit
- $-133,945
- Equity at exit
- $32,423
Cash invested: $105,000 (down + closing). Projections, not guarantees.
Landlord ↔ Tenant lean methodology
- Overall (STATE)
- 87 Strongly Landlord-Friendly
- State Florida
- 87 Strongly Landlord-Friendly · R+3
- County
- — inherits STATE
- City
- — inherits STATE
ZIP-level market 33811
- Home prices YoY
- -26.2%
- Rents YoY
- -0.2%
- Active inventory
- 360
- Price-to-rent
- 10.4×
Monthly cashflow live
- Estimated rent
- $2,998 high interval (Pro) →
- Mortgage (P&I)
- −$1,967
- Tax from tax record
- −$428 /mo · $5,138/yr
- Insurance
- −$156
- HOA
- −$107
- Vacancy / Maint / Mgmt
- −$629
- Net cashflow
- $-290
Break-even live
UW: 25.0% down · 7.5% · 30yr · 1.5% tax · 5.0% vac · 8.0% maint · 8.0% mgmt
Financing live
Cash to close
- Down payment
- $93,750
- Closing costs
- $11,250
- Reserves months
- —
- Total cash needed
- —
Loan-product check · same deal, 3 products live
Conventional
25% down · 7.5% · 30yr
- Down + closing
- —
- Monthly P&I
- —
- Monthly cashflow
- —
- DSCR
- —
- Eligible?
- —
Personal DTI + credit; lowest rate.
DSCR
20% down · 8.5% · 30yr
- Down + closing
- —
- Monthly P&I
- —
- Monthly cashflow
- —
- DSCR
- —
- Eligible?
- —
No personal income docs; deal must DSCR.
Hard money
10% down · 12.0% · 12mo
- Down + closing
- —
- Monthly P&I
- —
- Monthly cashflow
- —
- DSCR
- —
- Eligible?
- —
Short-term bridge; refi at stabilization.
Rent comps 7 comps
| Address | Beds | Baths | Sqft | Rent | $/sqft | DOM | Units | Dist |
|---|---|---|---|---|---|---|---|---|
| 2796 Grandbury Grove Rd Lakeland, FL | 4.0 | 2.0 | 1867 | $3,295 | $1.76 | 11d | 1 | 0.21mi |
| 3227 Bayou Bay Dr Lakeland, FL | 4.0 | 2.0 | 1872 | $2,600 | $1.39 | 3d | 1 | 0.27mi |
| 2127 Blue Highlands Dr Lakeland, FL | 4.0 | 2.0 | 1872 | $2,275 | $1.22 | 23d | 1 | 0.44mi |
| 3370 Cup Dr Unit 16 Lakeland, FL | 3.0 | 2.0 | 1837 | $2,975 | $1.62 | 3d | 1 | 1.21mi |
| 3442 Cup Dr Lakeland, FL | 3.0 | 2.0 | 1826 | $2,975 | $1.63 | 3d | 1 | 1.24mi |
| 3460 Cup Dr Unit 01 Lakeland, FL | 3.0 | 2.0 | 1837 | $2,864 | $1.56 | 10d | 1 | 1.25mi |
| 3372 Turnberry Ln Lakeland, FL | 3.0 | 3.0 | 2472 | $4,000 | $1.62 | 23d | 1 | 1.39mi |
HOA detail
- Monthly dues
- $107 · $1,284/yr
Listing history 16 events
-
2026-06-18days on market $375,000 Active 70 DOM
-
2026-06-17days on market $375,000 Active 69 DOM
-
2026-06-16days on market $375,000 Active 68 DOM
-
2026-06-15days on market $375,000 Active 67 DOM
-
2026-06-13days on market $375,000 Active 65 DOM
-
2026-06-10days on market $375,000 Active 62 DOM
-
2026-06-09days on market $375,000 Active 61 DOM
-
2026-06-08days on market $375,000 Active 60 DOM
-
2026-06-07days on market $375,000 Active 59 DOM
-
2026-06-05days on market $375,000 Active 56 DOM
-
2026-06-03days on market $375,000 Active 55 DOM
-
2026-06-03days on market $375,000 Active 54 DOM
-
2026-06-01days on market $375,000 Active 53 DOM
-
2026-05-31days on market $375,000 Active 52 DOM
-
2026-05-06price $375,000
-
2026-04-09$389,500 Active
ⓘ Source: listings_history table (triggers on properties + properties_extension) + one-shot
backfill from property_details.listing_events for pre-trigger history.
Tax reassessment forecast FL · Resets to sale price
- Current annual tax
- $5,138 · $428/mo
- Projected year-2 tax
- $5,138 · $428/mo
- Expected delta
- $0/yr ($0/mo · 0.0%)
ⓘ Screening estimate from a state-policy table — verify with the county assessor before closing.
Climate risk First Street
- Flood 1/10 Low FEMA zone X (unshaded) · 0% chance over 30 yrs
- Wildfire 5/10 Major
- Heat 8/10 Severe 7 d/yr ≥108°F today · 22 d/yr by 30 yrs out
- Wind 9/10 Extreme 99% chance of damaging wind over 30 yrs
- Air quality 2/10 Low 1 unhealthy d/yr today · 2 by 30 yrs out
Nearby sold comps map
Loading sold comps map…
Walkable amenities ~0.75 mi
Loading nearby amenities…
Taxation est. · year 1
- Rental income
- $35,970
- − Mortgage interest
- −$21,006
- − Property taxes
- −$5,138
- − Insurance
- −$1,875
- − Repairs & maintenance
- −$2,878
- − Management
- −$2,878
- − HOA
- −$1,284
- − Depreciation
- −$10,909
- Taxable loss
- −$9,997
- Est. tax savings @ 24.0%
- +$2,399
- After-tax cash flow
- $-1,080/yr
For passive investors: Depreciation is non-cash, so a rental often shows a tax loss while cash-flowing — sheltering income. Rental losses are passive: they offset passive income freely, and up to $25,000/yr can offset ordinary (W-2) income if you actively participate and your MAGI is under $100k (phasing out to $0 by $150k); unused losses carry forward. On sale, claimed depreciation is recaptured at up to 25%, and gains may owe capital-gains tax (a 1031 exchange can defer both). Figures are a year-1 estimate at your 24.0% rate — not tax advice; consult a CPA.
Schools (NCES district)
- District
- Polk
- NCES district ID
- 1201590
- Math proficiency
- 39% ▼ -11.00%
- Reading proficiency
- 43% ▼ -4.00%
- Median HH income
- $43,979
- Composite
- 34.74/100
- National rank
- #5132
- State rank
- #62 of 73 in FL
Livability — Lakeland
- Score
- 77/100
- State rank
- #206
- US rank
- #3179
Category grades
Schools grade is shown separately in the Schools card above.
Census & demographics
- Census place
- Lakeland, FL
- County
- Polk County · 740,051 people
- City population
- 277,690
- Metro
- Lakeland-Winter Haven, FL
- Population (ZIP)
- 29,472
- Household income
- $90,263
- Rent vs Own
- Severe rent burden
- 477.0
Population outlook (Polk County) Hauer SSP2
- Today (2025)
- 752,975 people
- By 2030
- 804,621 · +6.9%
- By 2040
- 906,117 · +20.3%
- By 2050
- 1,000,476 · +32.9%
- By 2075
- 1,197,520 · +59.0%
- By 2100
- 1,271,518 · +68.9%
Race, ethnicity, and origin ACS 2023
- Neighborhood character
- Majority White (63%)
- Race & ethnicity
- White 63% Hispanic / Latino 23% Two or more races 14% Black 8% Asian 1%
- Hispanic origin (detail)
- Mexican 6% Puerto Rican 5% Cuban 4%
- Common ancestry
- Italian 3% Lithuanian 2% Slovak 2%
- Foreign-born
- 8% · Canada, Jamaica
- Languages at home
- 83% English-only · Spanish 14% French/Haitian/Cajun 1% Tagalog/Filipino 1%
Political lean MEDSL · Polk
- 2024 margin
- Strong R (+20.7) · D 39.2% · R 59.9%
- 2008→2024 swing
- -14.6pp toward R · 2008: -6.1pp · 2024: -20.7pp
- All cycles
- 2024: R+20.7 2020: R+14.4 2016: R+14.1 2012: R+6.8 2008: R+6.1
Not yet ingested
- Civics
- —
Market trends
- HPI YoY
- ▼ -109.57%
- Current HPI
- 309.0061
- Rent YoY
- ▼ -0.19%
- Metro
- Lakeland-Winter Haven, FL
- State GDP YoY
- ▲ 3.28%
- F500 in state
- 36
Industry mix (Fortune 500 HQ in FL)
| Industry | F500 HQs | Revenue |
|---|---|---|
| Industrial Technology | 2 | $29B |
|
||
| Insurance | 2 | $17B |
|
||
| Retail | 1 | $60B |
|
||
| Technology Distribution | 1 | $58B |
|
||
| Homebuilding | 1 | $35B |
|
||
| Technology Manufacturing | 1 | $35B |
|
||
Price history
-3.7% since first listed2 events — show timeline
- 2026-05-06 Price Changed $375,000 Stellar MLS as Distributed by MLS Grid
- 2026-04-09 Listed $389,500 Stellar MLS as Distributed by MLS Grid
Property tax history
+77.5%/yrLatest (2025): $5,138 · -0.9% YoY. Source: county tax records.
Cash-flow waterfall
monthlySold comps — $/sqft
last 12 mo · ≤1 miLoading sold comps…