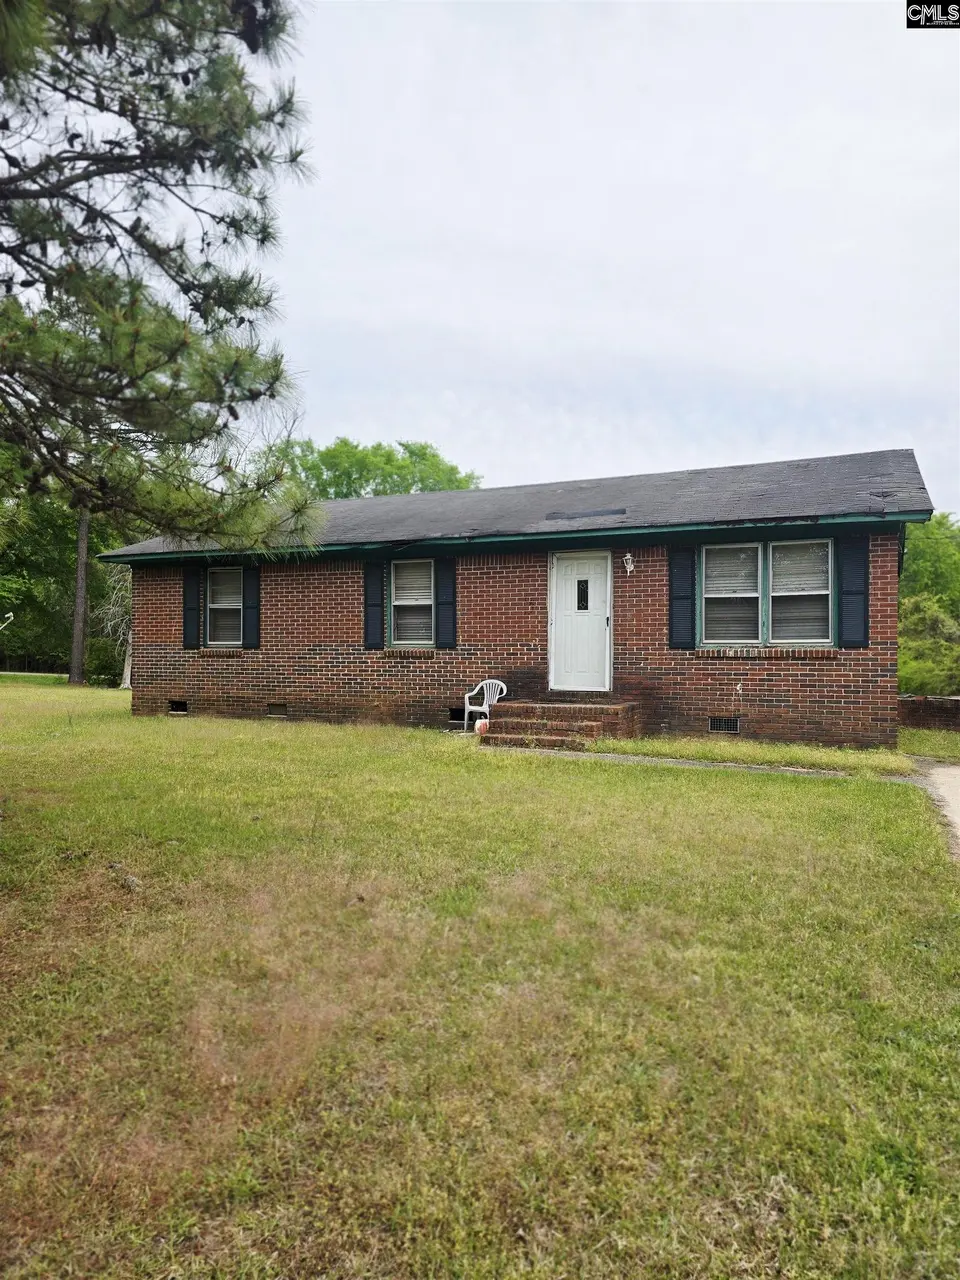
169 Straight Shot Rd · Jenkinsville, SC
Flood risk 1/10 · Minimal
- FEMA flood zone
- X (unshaded)
- Chance of flooding over 30 yrs
- 0.0%
- Est. flood insurance / yr
- $507 – $1,088
Fire risk 4/10 · Minor
- Est. fire insurance / yr
- $783 – $1,453
Heat risk 6/10 · Moderate
- Hot days now (above 107°F)
- 7 days/yr
- Hot days in 30 yrs
- 16 days/yr
Wind risk 6/10 · Moderate
- Chance of severe wind over 30 yrs
- 49.0%
Air-quality risk 2/10 · Minimal
- Unhealthy air days now
- 1 days/yr
- Unhealthy air days in 30 yrs
- 1 days/yr
Risk factors via First Street. Map © Google.
Why this score? — see what drove the B grade
The composite is a weighted blend of 9 inputs, each scored 0–100. Each bar is that input's sub-score; the figure is the points it added to the 100-point composite (weight × sub-score).
- Cash flow +30.0/30.0
- 1% rule +10.0/10.0
- DSCR +10.0/10.0
- ARV discount +7.5/15.0
- Appreciation +4.6/10.0
- Livability +2.8/5.0
- Schools +2.6/10.0
- Rent growth +2.5/5.0
- Condition / age +2.5/5.0
$49,900
🖨 Deal sheet 📄 Offer letter ✓ Due diligence
Listing remarks
Investor Special on 169 Straight Shot Rd. Great opportunity for investors or buyers looking to bring their vision to life. This property features 3 bedrooms, 1 bathroom situated on a spacious 1-acre lot, offering plenty of room to renovate, rebuild or create your dream investment. The is in need of repairs and is being SOLD AS-IS, making it perfect for Investors, Fix & Flip Projects, Rental Income Potential or Buyers looking to customize a home. Enjoy the peace and privacy of country living while still being driving distance to Scout Motors, nearby towns and amenities. Disclaimer: CMLS has not reviewed and, therefore, does not endorse vendors who may appear in listings.
Key facts
- 1 acre lot
- Built 1975
- Listed 20 days
Neighborhood map
What this means for you Summary
Snapshot
- This is a 3-bed/1.0-bath single-family listed at $50k.
Deal economics
- At list price, monthly cash flow is $520 ($6k/yr) — positive.
- The deal already cash-flows at list — no discount required.
- Meets the 1% rule at list price ($1k rent vs $50k).
- Recommended offer: $49k (1.5% below list) — sets the bar for market timing.
Location & tenants
- Location reads 55/100 on livability (#312 in SC) — a working-class tenant base; expect higher turnover. Strengths: cost of living A+, housing B; Watch: crime F, amenities F, commute F.
- Fairfield 01 (rural): math 26% / reading 38% proficiency, ranked #53 of 80 in SC (top 66%) — families likely to look elsewhere, expect single-tenant / working-renter base with shorter leases; 80% free/reduced lunch — lower-income household profile, screen leases tightly.
- Zoned schools: Fairfield Central High (math 37% / reading 77%, grade C, #120 of 196 statewide, top 64%, 662 students, 100% FRL) — zoned schools average 100% FRL vs 80% district-wide (20 pts higher); higher-poverty schools than district average — tighter screening recommended.
- Zoned-school proficiency averages 57% at this address vs 32% district-wide (+25 pts) — the actual schools serving this property are materially stronger than the Fairfield 01 average implies; a family-tenant draw the district grade alone would hide.
- Market conditions: 20 active listings in the ZIP; 91 units permitted in Fairfield County in 2024 (0 in 5+ unit buildings).
Forward outlook
- Local home prices are declining (-0.8%/yr); year-one equity from $345 of loan paydown is wiped out by about $390 of value loss. Plan a longer hold.
- Fairfield County population projected at -32% by 2050 — secular population decline; favor cash flow + early exit over multi-decade hold.
- At projected returns (-0.8% appreciation + 3.0% rent growth), your $14k cash investment doubles in ~3 years — after that, you're playing with house money.
Negotiation context
- It's been on market 20 days — a 2% lower offer ($49k) is reasonable based on typical stale-listing flexibility.
- Current owner paid $13k; list at $50k implies a 284% gain — meaningful room to come down on a strong offer.
Risks & watch-outs
- Climate carrying-cost: major wind risk, 49% chance of damaging wind over 30y; extreme-heat days projected 7→16/yr by 2055 (HVAC capex compounding) — expect insurance premiums to compound above CPI over the hold.
Questions for the listing agent
- Built in 1975 — when were the roof, HVAC, electrical panel, plumbing, and water heater last replaced?
- Is there a deadline driving the sale (1031 exchange, divorce, estate, relocation)? That informs how much negotiation room exists.
- Schools are F-rated, which usually means shorter tenancies and higher turnover. Who's the typical renter profile here, and what's been the actual vacancy rate?
- Crime grade is F in this area — have there been break-ins, vandalism, or insurance claims at this property in the last 3 years? What carrier currently insures it and at what premium?
- What's the average days-on-market for RENTAL listings here right now (not sales)? A rising rental-DOM trend means longer vacancies and softer asking-rent achievability than the comps imply.
- What's the recent tenant-quality profile in this submarket — average credit score on applications, eviction rate, late-payment / NSF rate, and stable-employment percentage? A property-management company in the area should have these aggregated.
- How much new for-sale + rental construction is in the pipeline within 1–3 miles? Heavy new supply typically softens prices + rents 12–24 months out; constrained supply supports both.
Investment metrics
- 1% rule
- 2.20% ✓
- Cap rate
- 18.79%
- Cash-on-cash
- 44.62%
- DSCR
- 2.99
- GRM
- 3.8
CMA / ARV
No comps found within radius.
Projected returns pro-forma
-0.78% appreciation · 3.0% rent growth · sell at horizon
- IRR
- 44.8%
- Equity multiple
- 3.14×
- Total profit
- $29,846
- Equity at exit
- $12,571
- IRR
- 48.4%
- Equity multiple
- 6.24×
- Total profit
- $73,255
- Equity at exit
- $13,653
Cash invested: $13,972 (down + closing). Projections, not guarantees.
Landlord ↔ Tenant lean methodology
- Overall (STATE)
- 90 Strongly Landlord-Friendly
- State South Carolina
- 90 Strongly Landlord-Friendly · R+6
- County
- — inherits STATE
- City
- — inherits STATE
ZIP-level market 29065
- Home prices YoY
- -0.9%
- Active inventory
- 20
- Price-to-rent
- 3.8×
Monthly cashflow live
- Estimated rent
- $1,099 medium interval (Pro) →
- Mortgage (P&I)
- −$262
- Tax from tax record
- −$66 /mo · $798/yr
- Insurance
- −$21
- HOA
- −$0
- Vacancy / Maint / Mgmt
- −$231
- Net cashflow
- $520
Break-even live
UW: 25.0% down · 7.5% · 30yr · 1.5% tax · 5.0% vac · 8.0% maint · 8.0% mgmt
Financing live
Cash to close
- Down payment
- $12,475
- Closing costs
- $1,497
- Reserves months
- —
- Total cash needed
- —
Loan-product check · same deal, 3 products live
Conventional
25% down · 7.5% · 30yr
- Down + closing
- —
- Monthly P&I
- —
- Monthly cashflow
- —
- DSCR
- —
- Eligible?
- —
Personal DTI + credit; lowest rate.
DSCR
20% down · 8.5% · 30yr
- Down + closing
- —
- Monthly P&I
- —
- Monthly cashflow
- —
- DSCR
- —
- Eligible?
- —
No personal income docs; deal must DSCR.
Hard money
10% down · 12.0% · 12mo
- Down + closing
- —
- Monthly P&I
- —
- Monthly cashflow
- —
- DSCR
- —
- Eligible?
- —
Short-term bridge; refi at stabilization.
Listing history 5 events
-
2026-04-26status Pending
-
2026-04-11historical Active - Contingent
-
2026-04-06$49,900 Active
-
2008-10-28soldstatus $13,000
-
2008-10-28soldstatus $13,000
ⓘ Source: listings_history table (triggers on properties + properties_extension) + one-shot
backfill from property_details.listing_events for pre-trigger history.
Tax reassessment forecast SC · Resets to sale price
- Current annual tax
- $798 · $66/mo
- Projected year-2 tax
- $798 · $66/mo
- Expected delta
- $0/yr ($0/mo · -0.0%)
ⓘ Screening estimate from a state-policy table — verify with the county assessor before closing.
Climate risk First Street
- Flood 1/10 Low FEMA zone X (unshaded) · 0% chance over 30 yrs
- Wildfire 4/10 Moderate
- Heat 6/10 Major 7 d/yr ≥107°F today · 16 d/yr by 30 yrs out
- Wind 6/10 Major 49% chance of damaging wind over 30 yrs
- Air quality 2/10 Low 1 unhealthy d/yr today · 1 by 30 yrs out
Nearby sold comps map
Loading sold comps map…
Walkable amenities ~0.75 mi
Loading nearby amenities…
Taxation est. · year 1
- Rental income
- $13,192
- − Mortgage interest
- −$2,795
- − Property taxes
- −$798
- − Insurance
- −$250
- − Repairs & maintenance
- −$1,055
- − Management
- −$1,055
- − Depreciation
- −$1,452
- Taxable income
- $5,788
- Est. tax owed @ 24.0%
- −$1,389
- After-tax cash flow
- $4,846/yr
For passive investors: Depreciation is non-cash, so a rental often shows a tax loss while cash-flowing — sheltering income. Rental losses are passive: they offset passive income freely, and up to $25,000/yr can offset ordinary (W-2) income if you actively participate and your MAGI is under $100k (phasing out to $0 by $150k); unused losses carry forward. On sale, claimed depreciation is recaptured at up to 25%, and gains may owe capital-gains tax (a 1031 exchange can defer both). Figures are a year-1 estimate at your 24.0% rate — not tax advice; consult a CPA.
Schools (NCES district)
- District
- Fairfield 01
- NCES district ID
- 4502100
- Math proficiency
- 26% ▼ -10.00%
- Reading proficiency
- 38% ▲ 4.00%
- Median HH income
- $34,836
- Composite
- 26.37/100
- National rank
- #7232
- State rank
- #53 of 80 in SC
Livability — Jenkinsville
- Score
- 55/100
- State rank
- #312
- US rank
- #23560
Category grades
Schools grade is shown separately in the Schools card above.
Census & demographics
- Population (ZIP)
- 574
Population outlook (Fairfield County) Hauer SSP2
- Today (2025)
- 21,017 people
- By 2030
- 19,778 · -5.9%
- By 2040
- 16,973 · -19.2%
- By 2050
- 14,251 · -32.2%
- By 2075
- 9,195 · -56.2%
- By 2100
- 5,722 · -72.8%
Race, ethnicity, and origin ACS 2023
- Neighborhood character
- Predominantly Black (86%)
- Race & ethnicity
- Black 86% White 9% Two or more races 3% Asian 2%
- Common ancestry
- Italian 4% Lithuanian 1% Portuguese 1%
- Foreign-born
- 2%
Political lean MEDSL · Fairfield
- 2024 margin
- D (+13.2) · D 56.0% · R 42.7% · Other 1.3%
- 2008→2024 swing
- -18.4pp toward R · 2008: 31.7pp · 2024: 13.2pp
- All cycles
- 2024: D+13.2 2020: D+22.7 2016: D+25.9 2012: D+31.6 2008: D+31.7
Not yet ingested
- Civics
- —
Market trends
- HPI YoY
- ▼ -0.78%
- Current HPI
- 86.7441
- Rent YoY
- —
- Metro
- —
- State GDP YoY
- ▲ 4.51%
- F500 in state
- 2
Industry mix (Fortune 500 HQ in SC)
| Industry | F500 HQs | Revenue |
|---|---|---|
| Packaging | 1 | $7B |
|
||
Price history
+283.8% since first listed5 events — show timeline
- 2026-04-26 Pending — Consolidated MLS
- 2026-04-11 Contingent — Consolidated MLS
- 2026-04-06 Listed $49,900 Consolidated MLS
- 2008-10-28 Sold (Public Records) $13,000 Public Records
- 2008-10-28 Sold (Public Records) $13,000 Public Records
Property tax history
-1.0%/yrLatest (2024): $798 · -0.7% YoY. Source: county tax records.
Cash-flow waterfall
monthlySold comps — $/sqft
last 12 mo · ≤1 miLoading sold comps…