206 Shannon Heights Dr Ste 205 · Penn Hills, PA
Flood risk 1/10 · Minimal
- FEMA flood zone
- X (unshaded)
- Chance of flooding over 30 yrs
- 0.0%
- Est. flood insurance / yr
- $473 – $860
Fire risk 1/10 · Minimal
- Est. fire insurance / yr
- $511 – $949
Heat risk 3/10 · Minor
- Hot days now (above 96°F)
- 7 days/yr
- Hot days in 30 yrs
- 16 days/yr
Wind risk 2/10 · Minimal
- Chance of severe wind over 30 yrs
- 0.0%
Air-quality risk 4/10 · Minor
- Unhealthy air days now
- 5 days/yr
- Unhealthy air days in 30 yrs
- 7 days/yr
Risk factors via First Street. Map © Google.
Why this score? — see what drove the C+ grade
The composite is a weighted blend of 9 inputs, each scored 0–100. Each bar is that input's sub-score; the figure is the points it added to the 100-point composite (weight × sub-score).
- Cash flow +25.4/30.0
- ARV discount +15.0/15.0
- DSCR +8.4/10.0
- 1% rule +6.7/10.0
- Rent growth +2.5/5.0
- Livability +2.5/5.0
- Condition / age +2.2/5.0
- Schools +1.6/10.0
- Appreciation +0.0/10.0
$143,000
🖨 Deal sheet 📄 Offer letter ✓ Due diligence
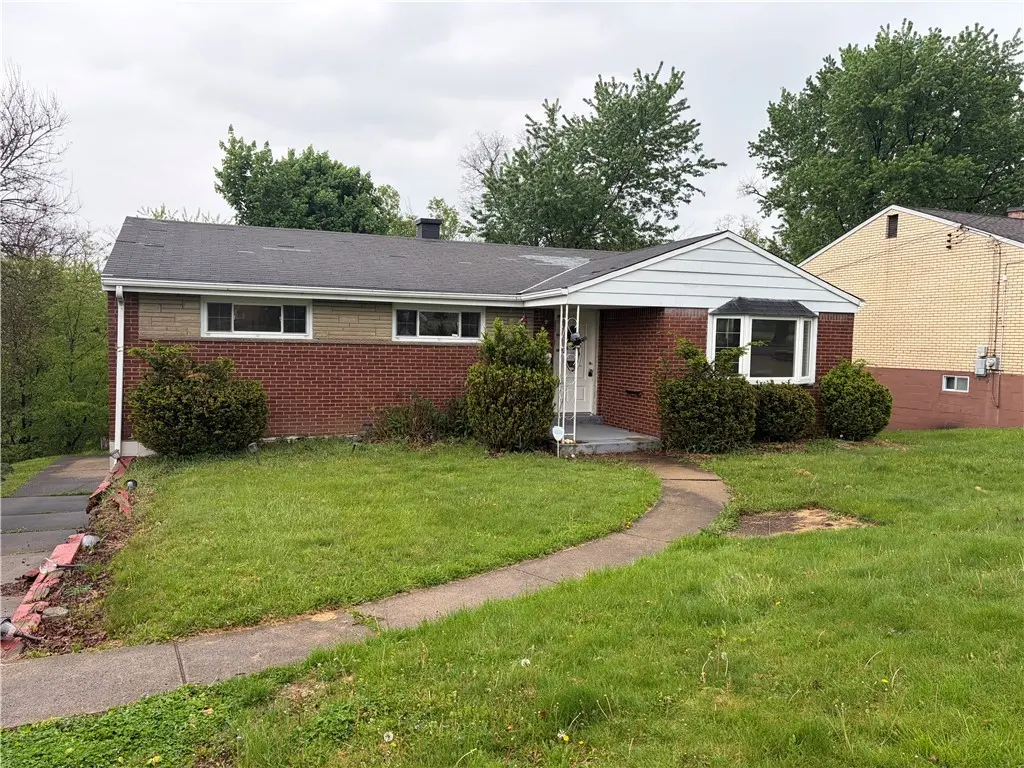
Listing remarks
A ranch style home with a wonderful sunroom located off of the dining room that flows into the living area and kitchen! Spacious game room and 2 car garage. One floor living with tons of storage space!
Key facts
- 0.45 acre lot
- Built 1960
- Listed 34 days
Property features AI
Exterior
- Utilities: Public water; Public sewer
- Home design: Single-story home
- Construction: Lot size approximately 0.453 acres
- Exterior features: Property in resale condition
Interior
- Bathrooms: 1 full bathroom; 1 half bathroom
- Interior features: Walk-out basement
Neighborhood map
What this means for you Summary
Snapshot
- This is a 3-bed/1.5-bath single-family listed at $143k. Condition is rated fair.
Deal economics
- At list price, monthly cash flow is $329 ($4k/yr) — positive.
- The deal already cash-flows at list — no discount required.
- Meets the 1% rule at list price ($2k rent vs $143k).
- Recommended offer: $139k (3.0% below list) — sets the bar for market timing.
Location & tenants
- Location reads: area grade C — affects rentability + tenant quality, not the cash-flow math above.
- Penn Hills SD (suburban): math 13% / reading 24% proficiency, ranked #496 of 539 in PA (top 92%) — low school quality limits family demand, transient renter base, plan for 1-2y turnover.
- Market conditions: 64 active listings in the ZIP; 11 comparable units currently listed for rent nearby; rentals leasing fast (median 13d on market — plan ~1-2 weeks tenant-placement turnaround); 2,996 units permitted in Allegheny County in 2024 (1,588 in 5+ unit buildings).
Forward outlook
- Local home prices are declining (-3.0%/yr); year-one equity from $989 of loan paydown is wiped out by about $4k of value loss. Plan a longer hold.
Negotiation context
- It's been on market 34 days — a 3% lower offer ($139k) is reasonable based on typical stale-listing flexibility.
Questions for the listing agent
- It's been on market 34 days. Have you received any prior offers? Is the seller open to a 3% concession, seller financing, or rate buy-down credit?
- Have any recent inspections been done? Can we get a copy of the seller's disclosures and any deferred-maintenance estimates?
- Built in 1960 — when were the roof, HVAC, electrical panel, plumbing, and water heater last replaced?
- Is there a deadline driving the sale (1031 exchange, divorce, estate, relocation)? That informs how much negotiation room exists.
- What's the average days-on-market for RENTAL listings here right now (not sales)? A rising rental-DOM trend means longer vacancies and softer asking-rent achievability than the comps imply.
- What's the recent tenant-quality profile in this submarket — average credit score on applications, eviction rate, late-payment / NSF rate, and stable-employment percentage? A property-management company in the area should have these aggregated.
- How much new for-sale + rental construction is in the pipeline within 1–3 miles? Heavy new supply typically softens prices + rents 12–24 months out; constrained supply supports both.
Investment metrics
- 1% rule
- 1.17% ✓
- Cap rate
- 9.05%
- Cash-on-cash
- 9.85%
- DSCR
- 1.44
- GRM
- 7.1
CMA / ARV
- ARV (median comp)
- $191,227
- List price
- $143,000
- Delta
- -25.22%
- Verdict
- UNDERPRICED
- Comps
- 20 within 1.0 mi
Show comp detail 12 sales within ~0.75 mi
| Address | Dist | Beds/Ba | Sqft | Sold | Price | $/sf | Match |
|---|---|---|---|---|---|---|---|
| 104 Lansdowne Dr | 0.16mi | 3/2.0 | 1,206 (+6%) | 1mo | $240,000 | $199 | 80 |
| 1677 Galeton Dr | 0.34mi | 3/2.5 | 1,148 (+1%) | 4mo | $245,000 | $213 | 75 |
| 5850 Heberton Dr | 0.50mi | 3/1.5 | 1,092 (-4%) | 0mo | $195,000 | $179 | 70 |
| 5733 Madison Dr | 0.46mi | 3/1.0 | 1,080 (-5%) | 2mo | $153,160 | $142 | 66 |
| 5528 Zieger Ave | 0.62mi | 3/1.0 | 1,144 (+0%) | 5mo | $172,500 | $151 | 65 |
| 1597 Riverside Dr | 0.55mi | 3/1.5 | 1,218 (+7%) | 1mo | $180,000 | $148 | 62 |
| 251 Crescent Pines Dr | 0.50mi | 3/2.0 | 1,232 (+8%) | 1mo | $195,000 | $158 | 61 |
| 5946 Poketa Rd | 0.34mi | 3/1.0 | 1,300 (+14%) | 0mo | $139,500 | $107 | 59 |
| 559 Hamil Rd | 0.69mi | 3/1.0 | 1,056 (-7%) | 2mo | $174,900 | $166 | 52 |
| 1713 Raithel St | 0.53mi | 2/1.5 (-1) | 1,236 (+8%) | 6mo | $169,000 | $137 | 51 |
| 168 Lois Dr | 0.74mi | 3/2.0 | 1,224 (+7%) | 2mo | $249,900 | $204 | 50 |
| 6407 Swan Dr | 0.60mi | 2/3.0 (-1) | 1,024 (-10%) | 7mo | $210,000 | $205 | 39 |
Match score weights: distance 35% · size 25% · config 20% · recency 20%. Top-matched comps best support the ARV.
Projected returns pro-forma
-3.0% appreciation · 3.0% rent growth · sell at horizon
- IRR
- -1.5%
- Equity multiple
- 0.94×
- Total profit
- $-2,213
- Equity at exit
- $21,322
- IRR
- 8.2%
- Equity multiple
- 1.63×
- Total profit
- $25,131
- Equity at exit
- $12,364
Cash invested: $40,040 (down + closing). Projections, not guarantees.
Landlord ↔ Tenant lean methodology
- Overall (STATE)
- 62 Landlord-Friendly
- State Pennsylvania
- 62 Landlord-Friendly · EVEN
- County
- — inherits STATE
- City
- — inherits STATE
ZIP-level market 15147
- Home prices YoY
- -26.0%
- Active inventory
- 64
- Price-to-rent
- 7.1×
Monthly cashflow live
- Estimated rent
- $1,667 high interval (Pro) →
- Mortgage (P&I)
- −$750
- Tax est. 1.5%
- −$179 /mo · $2,145/yr
- Insurance
- −$60
- HOA
- −$0
- Vacancy / Maint / Mgmt
- −$350
- Net cashflow
- $329
Break-even live
UW: 25.0% down · 7.5% · 30yr · 1.5% tax · 5.0% vac · 8.0% maint · 8.0% mgmt
Financing live
Cash to close
- Down payment
- $35,750
- Closing costs
- $4,290
- Reserves months
- —
- Total cash needed
- —
Loan-product check · same deal, 3 products live
Conventional
25% down · 7.5% · 30yr
- Down + closing
- —
- Monthly P&I
- —
- Monthly cashflow
- —
- DSCR
- —
- Eligible?
- —
Personal DTI + credit; lowest rate.
DSCR
20% down · 8.5% · 30yr
- Down + closing
- —
- Monthly P&I
- —
- Monthly cashflow
- —
- DSCR
- —
- Eligible?
- —
No personal income docs; deal must DSCR.
Hard money
10% down · 12.0% · 12mo
- Down + closing
- —
- Monthly P&I
- —
- Monthly cashflow
- —
- DSCR
- —
- Eligible?
- —
Short-term bridge; refi at stabilization.
Rent comps 11 comps
| Address | Beds | Baths | Sqft | Rent | $/sqft | DOM | Units | Dist |
|---|---|---|---|---|---|---|---|---|
| 6184 Poketa Rd Verona, PA | 3.0 | 2.0 | 1325 | $1,750 | $1.32 | 3d | 1 | 0.25mi |
| 149 Parkwood Dr Verona, PA | 3.0 | 1.0 | 1085 | $1,500 | $1.38 | 44d | 1 | 0.25mi |
| 5725 Verona Rd Unit 2 Verona, PA | 2.0 | 1.0 | 850 | $1,200 | $1.41 | 24d | 1 | 0.45mi |
| 5725 Verona Rd #1 Verona, PA | 2.0 | 1.0 | 800 | $1,300 | $1.62 | 24d | 1 | 0.45mi |
| 1426 Homestead Rd Unit 3 Verona, PA | 3.0 | 1.0 | 1000 | $1,499 | $1.50 | 12d | 1 | 0.75mi |
| 624 Elm Dr Verona, PA | 3.0 | 1.0 | 1296 | $1,600 | $1.23 | 2d | 1 | 0.80mi |
| 6703 W Barivista Dr Verona, PA | 3.0 | 2.0 | 1100 | $1,399 | $1.27 | 4d | 1 | 0.81mi |
| 1526 Edwards St Verona, PA | 3.0 | 1.0 | 1296 | $1,730 | $1.33 | 44d | 1 | 1.02mi |
| 724 7th St Verona, PA | 2.0 | 2.0 | 1157 | $1,899 | $1.64 | 7d | 1 | 1.06mi |
| 6388 Saltsburg Rd Pittsburgh, PA | 2.0 | 1.5 | 875 | $1,300 | $1.49 | 3d | 1 | 1.12mi |
| 14 River Rd Ste 1 Pittsburgh, PA | 3.0 | 2.5 | 1173 | $3,200 | $2.73 | 44d | 1 | 1.39mi |
Listing history 10 events
-
2026-06-10price $143,000 Active 34 DOM
-
2026-06-09days on market $152,500 Active 34 DOM
-
2026-06-08days on market $152,500 Active 33 DOM
-
2026-06-07days on market $152,500 Active 32 DOM
-
2026-06-05days on market $152,500 Active 29 DOM
-
2026-06-03days on market $152,500 Active 28 DOM
-
2026-06-02days on market $152,500 Active 27 DOM
-
2026-06-01days on market $152,500 Active 26 DOM
-
2026-05-31days on market $152,500 Active 25 DOM
-
2026-05-06$152,500 Active 202-char remark
ⓘ Source: listings_history table (triggers on properties + properties_extension) + one-shot
backfill from property_details.listing_events for pre-trigger history.
Climate risk First Street
- Flood 1/10 Low FEMA zone X (unshaded) · 0% chance over 30 yrs
- Wildfire 1/10 Low
- Heat 3/10 Moderate 7 d/yr ≥96°F today · 16 d/yr by 30 yrs out
- Wind 2/10 Low 0% chance of damaging wind over 30 yrs
- Air quality 4/10 Moderate 5 unhealthy d/yr today · 7 by 30 yrs out
Nearby sold comps map
Loading sold comps map…
Walkable amenities ~0.75 mi
Loading nearby amenities…
Taxation est. · year 1
- Rental income
- $20,004
- − Mortgage interest
- −$8,010
- − Property taxes
- −$2,145
- − Insurance
- −$715
- − Repairs & maintenance
- −$1,600
- − Management
- −$1,600
- − Depreciation
- −$4,160
- Taxable income
- $1,773
- Est. tax owed @ 24.0%
- −$426
- After-tax cash flow
- $3,519/yr
For passive investors: Depreciation is non-cash, so a rental often shows a tax loss while cash-flowing — sheltering income. Rental losses are passive: they offset passive income freely, and up to $25,000/yr can offset ordinary (W-2) income if you actively participate and your MAGI is under $100k (phasing out to $0 by $150k); unused losses carry forward. On sale, claimed depreciation is recaptured at up to 25%, and gains may owe capital-gains tax (a 1031 exchange can defer both). Figures are a year-1 estimate at your 24.0% rate — not tax advice; consult a CPA.
Condition & rehab AI · 6 photos
A ranch-style home with moderate repairs needed, particularly in the kitchen and bath areas. Upgrades to the interior walls, flooring, and landscaping would significantly enhance its value.
Repairs flagged
- Moderate Exposed plumbing in kitchen and bath — Needs repair to prevent further damage
- Minor Missing cabinet doors in kitchen — Aesthetic issue
Value-add opportunities
- Both Paint interior walls — Enhances curb appeal and interior aesthetics
- Both Replace worn flooring — Improves comfort and reduces maintenance costs
- Both Trim overgrown grass — Enhances curb appeal and maintains property value
Renovation cost estimate screening
| Repair item | Severity | Est. cost |
|---|---|---|
| Exposed plumbing in kitchen and bath · Needs repair to prevent further damage | Moderate | $3,000–15,000 |
| Missing cabinet doors in kitchen · Aesthetic issue | Minor | $500–3,000 |
| Total estimated repair cost · 2 items | $3,500–18,000 |
Value-add ROI direction
- Both Paint interior walls — Enhances curb appeal and interior aesthetics ↑
- Both Replace worn flooring — Improves comfort and reduces maintenance costs ↑
- Both Trim overgrown grass — Enhances curb appeal and maintains property value ↑
ⓘ Cost ranges are severity-bucket heuristics (US national rule-of-thumb). Get contractor quotes + a written scope before underwriting a rehab budget.
Schools (NCES district)
- District
- Penn Hills SD
- NCES district ID
- 4218590
- Math proficiency
- 13% ▼ -6.00%
- Reading proficiency
- 24% ▼ -14.00%
- Median HH income
- $47,794
- Composite
- 16.42/100
- National rank
- #9192
- State rank
- #496 of 539 in PA
Livability — Penn Hills
No livability data for this city. (Only ~50 U.S. cities are tracked.)
Census & demographics
- County
- Allegheny County · 1,022,028 people
- Metro
- Pittsburgh, PA
- Population (ZIP)
- 15,798
- Household income
- $66,757
- Rent vs Own
- Severe rent burden
- 511.0
Population outlook (Allegheny County) Hauer SSP2
- Today (2025)
- 1,250,282 people
- By 2030
- 1,256,482 · +0.5%
- By 2040
- 1,256,318 · +0.5%
- By 2050
- 1,244,169 · -0.5%
- By 2075
- 1,197,693 · -4.2%
- By 2100
- 1,093,187 · -12.6%
Race, ethnicity, and origin ACS 2023
- Neighborhood character
- Predominantly White (69%)
- Race & ethnicity
- White 69% Black 21% Two or more races 6% Hispanic / Latino 4%
- Common ancestry
- Romanian 6% Slovak 2% Serbian 1%
- Foreign-born
- 3% · Canada
- Languages at home
- 95% English-only · Spanish 3% Other Indo-European 1%
Political lean MEDSL · Allegheny
- 2024 margin
- Strong D (+20.3) · D 59.7% · R 39.4%
- 2008→2024 swing
- +4.8pp toward D · 2008: 15.5pp · 2024: 20.3pp
- All cycles
- 2024: D+20.3 2020: D+20.4 2016: D+16.4 2012: D+14.4 2008: D+15.5
Not yet ingested
- Civics
- —
Market trends
- HPI YoY
- ▼ -87.47%
- Current HPI
- 249.3773
- Rent YoY
- —
- Metro
- Pittsburgh, PA
- State GDP YoY
- ▲ 1.68%
- F500 in state
- 34
Industry mix (Fortune 500 HQ in PA)
| Industry | F500 HQs | Revenue |
|---|---|---|
| Healthcare | 2 | $309B |
|
||
| Insurance | 2 | $27B |
|
||
| Telecommunications / Media | 1 | $124B |
|
||
| Industrial Distribution | 1 | $22B |
|
||
| Financial Services | 1 | $20B |
|
||
| Chemicals / Materials | 1 | $18B |
|
||
Cash-flow waterfall
monthlySold comps — $/sqft
last 12 mo · ≤1 miLoading sold comps…