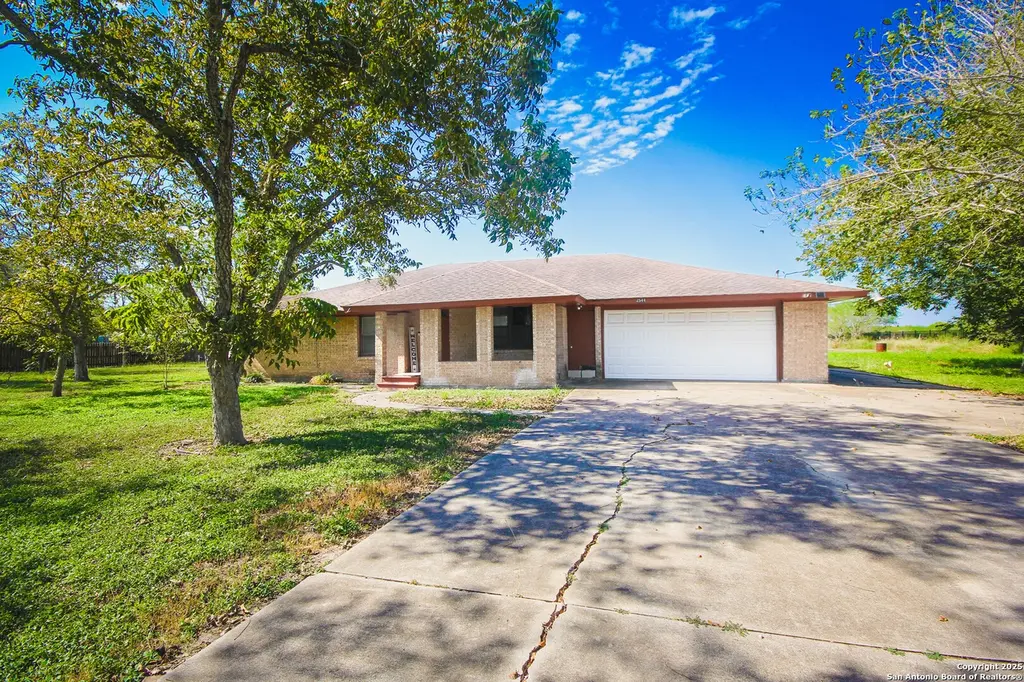
2544 Mari Gail St · Beeville, TX
Flood risk 1/10 · Minimal
- FEMA flood zone
- X (unshaded)
- Chance of flooding over 30 yrs
- 0.0%
- Est. flood insurance / yr
- $507 – $1,088
Fire risk 4/10 · Minor
- Est. fire insurance / yr
- $1,222 – $2,270
Heat risk 8/10 · Major
- Hot days now (above 111°F)
- 7 days/yr
- Hot days in 30 yrs
- 22 days/yr
Wind risk 9/10 · Severe
- Chance of severe wind over 30 yrs
- 99.0%
Air-quality risk 1/10 · Minimal
- Unhealthy air days now
- 0 days/yr
- Unhealthy air days in 30 yrs
- 0 days/yr
Risk factors via First Street. Map © Google.
Why this score? — see what drove the D grade
The composite is a weighted blend of 9 inputs, each scored 0–100. Each bar is that input's sub-score; the figure is the points it added to the 100-point composite (weight × sub-score).
- ARV discount +15.0/15.0
- Cash flow +8.2/30.0
- 1% rule +3.9/10.0
- Livability +3.5/5.0
- Rent growth +2.5/5.0
- Schools +2.5/10.0
- Condition / age +2.5/5.0
- DSCR +2.2/10.0
- Appreciation +0.0/10.0
$165,000
🖨 Deal sheet 📄 Offer letter ✓ Due diligence
Listing remarks MLS
Tucked away on 1.71 peaceful acres just outside the city limits, this spacious 4bedroom, 3 bath home offers plenty of room to spread out both inside and out! With two living areas, a large main bedroom and ensuite, and an attached 2-car garage, this property has great bones and tons of potential to make it your own with just a little TLC. There's so much outdoor space for gatherings, gardening, or simply enjoying the quiet country setting. If you've been searching for a home with character, space, and the freedom of living outside city limits this one's worth a look!
Key facts
- Attached garage
- Two living areas
- Outdoor space
Tags
Neighborhood map
What this means for you Summary
Snapshot
- This is a 4-bed/1.0-bath single-family listed at $165k.
Deal economics
- At list price, monthly cash flow is $-155 ($-2k/yr) — negative.
- To cash-flow at today's rent, offer at most $138k (16.6% below list).
- To meet the 1% rule (rent ≥ 1% of price), the offer needs to be $147k (10.7% below list).
- Recommended offer: $138k (16.6% below list) — sets the bar for cash-flow.
- Cap rate 5.2% vs local median 3.4% in Beeville — top-decile yield for the area; either an underpriced asset or a hidden risk that comps aren't pricing in. Stress-test before assuming the spread holds.
Location & tenants
- Location reads 70/100 on livability (#354 in TX) — a middle-class / working-renter tenant base. Strengths: cost of living A+, housing A+, health & safety A+; Watch: schools D+, crime D-, amenities F.
- Beeville ISD (town): math 23% / reading 37% proficiency, ranked #638 of 826 in TX (top 77%) — families likely to look elsewhere, expect single-tenant / working-renter base with shorter leases; 68% free/reduced lunch — lower-income household profile, screen leases tightly.
- Market conditions: 187 active listings in the ZIP; 15 units permitted in Bee County in 2024 (0 in 5+ unit buildings).
- This rent runs 30% of the median local income ($59k/yr) — at the standard rent-burdened threshold; future hikes will face affordability resistance.
Forward outlook
- Local home prices are declining (-3.0%/yr); year-one equity from $1k of loan paydown is wiped out by about $5k of value loss. Plan a longer hold.
- Bee County population projected at +24% by 2050 — long-run rental-demand tailwind backs the buy-and-hold thesis.
Negotiation context
- It's been on market 233 days — a 12% lower offer ($145k) is reasonable based on typical stale-listing flexibility.
- 6 sale attempts since 15y ago; this cycle's ask has dropped $40k (20%) from the opening price — seller is motivated, your offer sets the floor, not the list.
Risks & watch-outs
- Watch-outs: property tax is 2.8% of price.
- Climate carrying-cost: severe wind risk, 99% chance of damaging wind over 30y; extreme-heat days projected 7→22/yr by 2055 (HVAC capex compounding) — expect insurance premiums to compound above CPI over the hold.
Questions for the listing agent
- What do current leases actually rent for vs. the listed asking? Can we see a recent rent roll and the last 12 months of T-12 income?
- It's been on market 233 days. Have you received any prior offers? Is the seller open to a 17% concession, seller financing, or rate buy-down credit?
- Property tax is high relative to price — has the assessment been appealed recently, and will the sale trigger a re-assessment?
- Why hasn't it sold? Are there any deal-killer items the seller is aware of (foundation, flood, title, zoning, code violations)?
- Is there a deadline driving the sale (1031 exchange, divorce, estate, relocation)? That informs how much negotiation room exists.
- Schools are D-rated, which usually means shorter tenancies and higher turnover. Who's the typical renter profile here, and what's been the actual vacancy rate?
- Crime grade is D in this area — have there been break-ins, vandalism, or insurance claims at this property in the last 3 years? What carrier currently insures it and at what premium?
- The area grade is low — what's the realistic commute time and amenity access for the typical tenant pool here? Any planned neighborhood developments (good or bad) we should know about?
- What's the average days-on-market for RENTAL listings here right now (not sales)? A rising rental-DOM trend means longer vacancies and softer asking-rent achievability than the comps imply.
- What's the recent tenant-quality profile in this submarket — average credit score on applications, eviction rate, late-payment / NSF rate, and stable-employment percentage? A property-management company in the area should have these aggregated.
- How much new for-sale + rental construction is in the pipeline within 1–3 miles? Heavy new supply typically softens prices + rents 12–24 months out; constrained supply supports both.
Investment metrics
- 1% rule
- 0.89% ✗
- Cap rate
- 5.17%
- Cash-on-cash
- -4.02%
- DSCR
- 0.82
- GRM
- 9.3
CMA / ARV
- ARV (median comp)
- $265,410
- List price
- $165,000
- Delta
- -37.83%
- Verdict
- UNDERPRICED
- Comps
- 3 within 1.0 mi
Show comp detail 2 sales within ~0.75 mi
| Address | Dist | Beds/Ba | Sqft | Sold | Price | $/sf | Match |
|---|---|---|---|---|---|---|---|
| 2535 Mari Gail | 0.05mi | 3/2.0 (-1) | 2,120 (+6%) | 20mo | $275,000 | $130 | 62 |
| 2710 Chase | 0.07mi | 3/2.0 (-1) | 1,778 (-12%) | 20mo | $235,000 | $132 | 52 |
Match score weights: distance 35% · size 25% · config 20% · recency 20%. Top-matched comps best support the ARV.
Projected returns pro-forma
-3.0% appreciation · 3.0% rent growth · sell at horizon
- IRR
- -23.0%
- Equity multiple
- 0.21×
- Total profit
- $-36,455
- Equity at exit
- $24,602
- IRR
- -17.2%
- Equity multiple
- 0.05×
- Total profit
- $-43,890
- Equity at exit
- $14,266
Cash invested: $46,200 (down + closing). Projections, not guarantees.
Landlord ↔ Tenant lean methodology
- Overall (STATE)
- 87 Strongly Landlord-Friendly
- State Texas
- 87 Strongly Landlord-Friendly · R+5
- County
- — inherits STATE
- City
- — inherits STATE
ZIP-level market 78102
- Home prices YoY
- -34.5%
- Active inventory
- 187
- Price-to-rent
- 9.3×
Monthly cashflow live
- Estimated rent
- $1,474 medium interval (Pro) →
- Mortgage (P&I)
- −$865
- Tax from tax record
- −$385 /mo · $4,624/yr
- Insurance
- −$69
- HOA
- −$0
- Vacancy / Maint / Mgmt
- −$310
- Net cashflow
- $-155
Break-even live
UW: 25.0% down · 7.5% · 30yr · 1.5% tax · 5.0% vac · 8.0% maint · 8.0% mgmt
Financing live
Cash to close
- Down payment
- $41,250
- Closing costs
- $4,950
- Reserves months
- —
- Total cash needed
- —
Loan-product check · same deal, 3 products live
Conventional
25% down · 7.5% · 30yr
- Down + closing
- —
- Monthly P&I
- —
- Monthly cashflow
- —
- DSCR
- —
- Eligible?
- —
Personal DTI + credit; lowest rate.
DSCR
20% down · 8.5% · 30yr
- Down + closing
- —
- Monthly P&I
- —
- Monthly cashflow
- —
- DSCR
- —
- Eligible?
- —
No personal income docs; deal must DSCR.
Hard money
10% down · 12.0% · 12mo
- Down + closing
- —
- Monthly P&I
- —
- Monthly cashflow
- —
- DSCR
- —
- Eligible?
- —
Short-term bridge; refi at stabilization.
Listing history 29 events
-
2026-06-19days on market $165,000 Active 233 DOM
-
2026-06-18days on market $165,000 Active 232 DOM
-
2026-06-17days on market $165,000 Active 231 DOM
-
2026-06-16days on market $165,000 Active 230 DOM
-
2026-06-15days on market $165,000 Active 229 DOM
-
2026-06-14days on market $165,000 Active 227 DOM
-
2026-06-12statusdays on market $165,000 Active 226 DOM
-
2026-06-09days on market $165,000 Price Change 223 DOM
-
2026-06-08days on market $165,000 Price Change 222 DOM
-
2026-06-07days on market $165,000 Price Change 221 DOM
-
2026-06-07days on market $165,000 Price Change 220 DOM
-
2026-06-03days on market $165,000 Price Change 217 DOM
-
2026-06-02days on market $165,000 Price Change 216 DOM
-
2026-06-01days on market $165,000 Price Change 215 DOM
-
2026-05-31pricestatus $165,000 Price Change 214 DOM
-
2026-05-31days on market $190,000 Active 214 DOM
-
2026-05-30days on market $190,000 Active 213 DOM
-
2026-01-23price $190,000 579-char remark
Show marketing remark (579 chars)
Tucked away on 1.71 peaceful acres just outside the city limits, this spacious 4bedroom, 3 bath home offers plenty of room to spread out both inside and out! With two living areas, a large main bedroom and ensuite, and an attached 2-car garage, this property has great bones and tons of potential to make it your own with just a little TLC. There's so much outdoor space for gatherings, gardening, or simply enjoying the quiet country setting. If you've been searching for a home with character, space, and the freedom of living outside city limits this one's worth a look!
-
2025-10-29$205,000 New 579-char remark
Show marketing remark (579 chars)
Tucked away on 1.71 peaceful acres just outside the city limits, this spacious 4bedroom, 3 bath home offers plenty of room to spread out both inside and out! With two living areas, a large main bedroom and ensuite, and an attached 2-car garage, this property has great bones and tons of potential to make it your own with just a little TLC. There's so much outdoor space for gatherings, gardening, or simply enjoying the quiet country setting. If you've been searching for a home with character, space, and the freedom of living outside city limits this one's worth a look!
-
2018-02-26soldstatus 844-char remark
Show marketing remark (844 chars)
SOLD for List Price + additional 7/10ths of an acre in the back of Brick 3/2.5/2CA on 1 acre tract of land. The house has been spruced up and is ready for move-in. South of Beeville off HWY 202 and Chase Rd this house is sure to satisfy buyer looking for small acreage close to town! House has pretty tile and laminate flooring in most of the house and a large den off kitchen and dining area.; Original MLS#: 110006; Buyer Name: Ramiro & Monique Garcia; Deed Restrictions: Yes; Features: Porch-Front, Porch-Back; Home Warranty: No; Land Dimensions: 1.0 ac survey; Land Size Apx: 1.0; Property Condition: Good; Property Exclusions: Owner is selling off 0.477 acres and reserving 1.0 acre, out of the remaining 2.0 acres; Room List: Study/Library; Water District: Yes; Water Heater: Electric; Windows: Single Pane, Wood; Zoning: Residential
-
2017-12-10$135,000 844-char remark
Show marketing remark (844 chars)
SOLD for List Price + additional 7/10ths of an acre in the back of Brick 3/2.5/2CA on 1 acre tract of land. The house has been spruced up and is ready for move-in. South of Beeville off HWY 202 and Chase Rd this house is sure to satisfy buyer looking for small acreage close to town! House has pretty tile and laminate flooring in most of the house and a large den off kitchen and dining area.; Original MLS#: 110006; Buyer Name: Ramiro & Monique Garcia; Deed Restrictions: Yes; Features: Porch-Front, Porch-Back; Home Warranty: No; Land Dimensions: 1.0 ac survey; Land Size Apx: 1.0; Property Condition: Good; Property Exclusions: Owner is selling off 0.477 acres and reserving 1.0 acre, out of the remaining 2.0 acres; Room List: Study/Library; Water District: Yes; Water Heater: Electric; Windows: Single Pane, Wood; Zoning: Residential
-
2017-10-20soldstatus
-
2017-04-21$112,500
-
2017-02-04historical
-
2017-01-09$139,900
-
2016-08-04$139,900
-
2011-11-02soldstatus
-
2011-11-01soldstatus
-
2011-09-06$135,000
ⓘ Source: listings_history table (triggers on properties + properties_extension) + one-shot
backfill from property_details.listing_events for pre-trigger history.
Tax reassessment forecast TX · Resets to sale price
- Current annual tax
- $4,624 · $385/mo
- Projected year-2 tax
- $4,624 · $385/mo
- Expected delta
- $0/yr ($0/mo · 0.0%)
ⓘ Screening estimate from a state-policy table — verify with the county assessor before closing.
Climate risk First Street
- Flood 1/10 Low FEMA zone X (unshaded) · 0% chance over 30 yrs
- Wildfire 4/10 Moderate
- Heat 8/10 Severe 7 d/yr ≥111°F today · 22 d/yr by 30 yrs out
- Wind 9/10 Extreme 99% chance of damaging wind over 30 yrs
- Air quality 1/10 Low 0 unhealthy d/yr today · 0 by 30 yrs out
Nearby sold comps map
Loading sold comps map…
Walkable amenities ~0.75 mi
Loading nearby amenities…
Taxation est. · year 1
- Rental income
- $17,691
- − Mortgage interest
- −$9,243
- − Property taxes
- −$4,624
- − Insurance
- −$825
- − Repairs & maintenance
- −$1,415
- − Management
- −$1,415
- − Depreciation
- −$4,800
- Taxable loss
- −$4,630
- Est. tax savings @ 24.0%
- +$1,111
- After-tax cash flow
- $-744/yr
For passive investors: Depreciation is non-cash, so a rental often shows a tax loss while cash-flowing — sheltering income. Rental losses are passive: they offset passive income freely, and up to $25,000/yr can offset ordinary (W-2) income if you actively participate and your MAGI is under $100k (phasing out to $0 by $150k); unused losses carry forward. On sale, claimed depreciation is recaptured at up to 25%, and gains may owe capital-gains tax (a 1031 exchange can defer both). Figures are a year-1 estimate at your 24.0% rate — not tax advice; consult a CPA.
Schools (NCES district)
- District
- Beeville ISD
- NCES district ID
- 4809720
- Math proficiency
- 23% ▼ -12.00%
- Reading proficiency
- 37% ▲ 3.00%
- Median HH income
- $40,319
- Composite
- 25.23/100
- National rank
- #7503
- State rank
- #638 of 826 in TX
Livability — Beeville
- Score
- 70/100
- State rank
- #354
- US rank
- #7698
Category grades
Schools grade is shown separately in the Schools card above.
Census & demographics
- County
- Bee County · 27,455 people
- City population
- 27,455
- Metro
- Beeville, TX
- Population (ZIP)
- 27,455
- Household income
- $58,939
- Rent vs Own
- Severe rent burden
- 853.0
Population outlook (Bee County) Hauer SSP2
- Today (2025)
- 35,003 people
- By 2030
- 36,447 · +4.1%
- By 2040
- 39,810 · +13.7%
- By 2050
- 43,525 · +24.3%
- By 2075
- 51,766 · +47.9%
- By 2100
- 53,434 · +52.7%
Race, ethnicity, and origin ACS 2023
- Neighborhood character
- Majority Hispanic (62%)
- Race & ethnicity
- Hispanic / Latino 62% Two or more races 29% White 27% Black 7%
- Hispanic origin (detail)
- Mexican 55%
- Common ancestry
- Lithuanian 1% Slovak 1%
- Foreign-born
- 5% · Canada
- Languages at home
- 66% English-only · Spanish 33%
Political lean MEDSL · Bee
- 2024 margin
- Solid R (+39.9) · D 29.6% · R 69.5%
- 2008→2024 swing
- -29.8pp toward R · 2008: -10.1pp · 2024: -39.9pp
- All cycles
- 2024: R+39.9 2020: R+28.9 2016: R+15.4 2012: R+11.5 2008: R+10.1
Not yet ingested
- Civics
- —
Market trends
- HPI YoY
- ▼ -76.59%
- Current HPI
- 145.1182
- Rent YoY
- —
- Metro
- Beeville, TX
- State GDP YoY
- ▲ 3.95%
- F500 in state
- 110
Industry mix (Fortune 500 HQ in TX)
| Industry | F500 HQs | Revenue |
|---|---|---|
| Energy | 16 | $1,198B |
|
||
| Technology | 5 | $198B |
|
||
| Engineering / Construction | 4 | $72B |
|
||
| Energy Services | 3 | $60B |
|
||
| Utilities | 3 | $41B |
|
||
| Healthcare | 2 | $330B |
|
||
Price history
+40.7% since first listed12 events — show timeline
- 2026-01-23 Price Changed $190,000 LERA
- 2025-10-29 Listed $205,000 LERA
- 2018-02-26 Sold (MLS) — LERA
- 2017-12-10 Listed $135,000 LERA
- 2017-10-20 Sold (MLS) — LERA
- 2017-04-21 Listed $112,500 LERA
- 2017-02-04 Listing Removed — LERA
- 2017-01-09 Listed $139,900 CBMLS
- 2016-08-04 Listed $139,900 LERA
- 2011-11-02 Sold (Public Records) — Public Records
- 2011-11-01 Sold (MLS) — LERA
- 2011-09-06 Listed $135,000 LERA
Property tax history
+6.6%/yrLatest (2025): $4,624 · +4.3% YoY. Source: county tax records.
Cash-flow waterfall
monthlySold comps — $/sqft
last 12 mo · ≤1 miLoading sold comps…