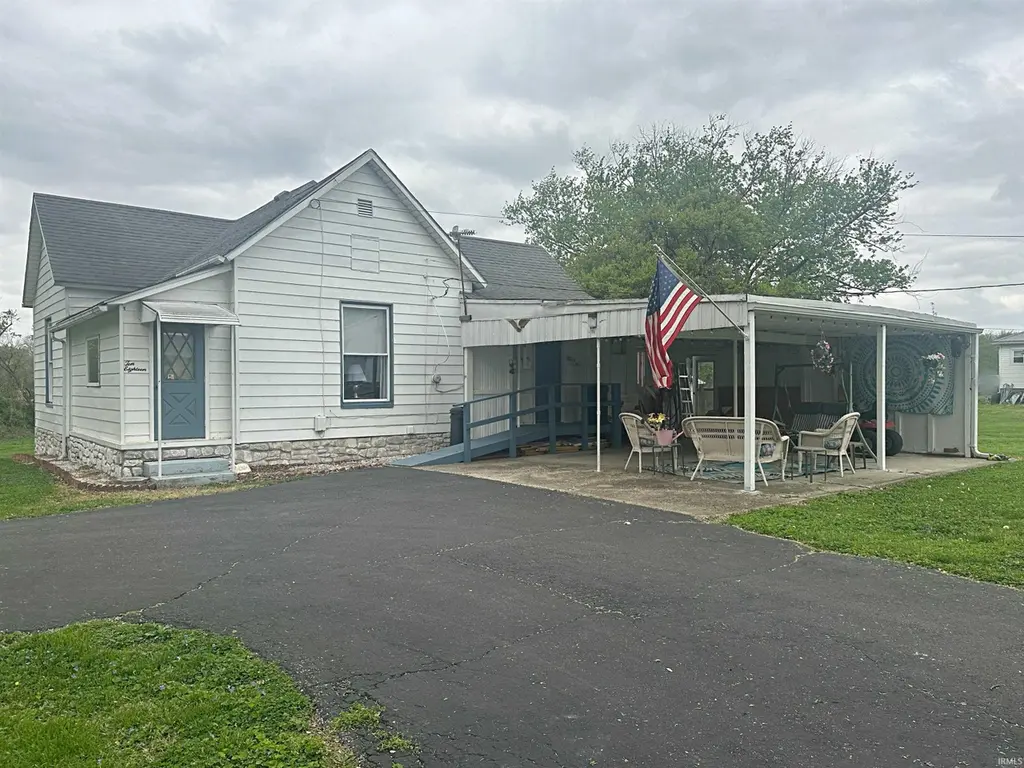
1018 W 1st St · Bicknell, IN
Flood risk 1/10 · Minimal
- FEMA flood zone
- —
- Chance of flooding over 30 yrs
- 0.0%
- Est. flood insurance / yr
- —
Fire risk 1/10 · Minimal
- Est. fire insurance / yr
- $717 – $1,331
Heat risk 4/10 · Minor
- Hot days now (above 106°F)
- 7 days/yr
- Hot days in 30 yrs
- 19 days/yr
Wind risk 2/10 · Minimal
- Chance of severe wind over 30 yrs
- 2.0%
Air-quality risk 2/10 · Minimal
- Unhealthy air days now
- 1 days/yr
- Unhealthy air days in 30 yrs
- 2 days/yr
Risk factors via First Street. Map © Google.
Why this score? — see what drove the D grade
The composite is a weighted blend of 9 inputs, each scored 0–100. Each bar is that input's sub-score; the figure is the points it added to the 100-point composite (weight × sub-score).
- Cash flow +20.5/30.0
- DSCR +6.5/10.0
- 1% rule +4.3/10.0
- Livability +3.2/5.0
- Schools +3.1/10.0
- Rent growth +2.5/5.0
- Condition / age +2.5/5.0
- ARV discount +0.0/15.0
- Appreciation +0.0/10.0
$105,000
🖨 Deal sheet (PDF) 📄 Offer letter ✓ Due diligence
Listing remarks MLS
Charming 2 bed, 1 bath bungalow on a spacious 0.5 acre +/- lot located on a dead-end street in Bicknell. Home features updated flooring in kitchen, back porch, and bathroom, with a walk-in shower, replacement vinyl windows, central air, and all appliances included. Exterior features include circle drive, carport with ramp access, wooden shed, and is located in North Knox School District.
Key facts
- Circle drive
- Updated flooring
- Walk-in shower
Tags
Neighborhood map
What this means for you Summary
Snapshot
- This is a 2-bed/1.0-bath single-family listed at $105k.
Deal economics
- At list price, monthly cash flow is $138 ($2k/yr) — positive.
- The deal already cash-flows at list — no discount required.
- To meet the 1% rule (rent ≥ 1% of price), the offer needs to be $97k (7.3% below list).
- Recommended offer: $97k (7.3% below list) — sets the bar for 1% rule.
Location & tenants
- Location reads 64/100 on livability (#373 in IN) — a middle-class / working-renter tenant base. Strengths: cost of living A+, crime A, housing A-; Watch: health & safety C-, schools F, amenities F.
- North Knox School Corporation (rural): math 28% / reading 45% proficiency, ranked #186 of 301 in IN (top 62%) — families likely to look elsewhere, expect single-tenant / working-renter base with shorter leases.
- Market conditions: 34 active listings in the ZIP; 36 units permitted in Knox County in 2024 (0 in 5+ unit buildings).
Forward outlook
- Local home prices are declining (-3.0%/yr); year-one equity from $726 of loan paydown is wiped out by about $3k of value loss. Plan a longer hold.
- Knox County population projected at -13% by 2050 — secular population decline; favor cash flow + early exit over multi-decade hold.
Negotiation context
- It's been on market 53 days — a 3% lower offer ($102k) is reasonable based on typical stale-listing flexibility.
- 2 sale attempts with the ask held roughly flat each time — persistent listings suggest the price (not the market) is what's stuck; bring a comps-based counter.
Risks & watch-outs
- Watch-outs: built in 1913 — expect roof / HVAC / electrical / plumbing capex.
Questions for the listing agent
- It's been on market 53 days. Have you received any prior offers? Is the seller open to a 7% concession, seller financing, or rate buy-down credit?
- Built in 1913 — when were the roof, HVAC, electrical panel, plumbing, and water heater last replaced?
- Is there a deadline driving the sale (1031 exchange, divorce, estate, relocation)? That informs how much negotiation room exists.
- Schools are F-rated, which usually means shorter tenancies and higher turnover. Who's the typical renter profile here, and what's been the actual vacancy rate?
- The area grade is low — what's the realistic commute time and amenity access for the typical tenant pool here? Any planned neighborhood developments (good or bad) we should know about?
- What's the average days-on-market for RENTAL listings here right now (not sales)? A rising rental-DOM trend means longer vacancies and softer asking-rent achievability than the comps imply.
- What's the recent tenant-quality profile in this submarket — average credit score on applications, eviction rate, late-payment / NSF rate, and stable-employment percentage? A property-management company in the area should have these aggregated.
- How much new for-sale + rental construction is in the pipeline within 1–3 miles? Heavy new supply typically softens prices + rents 12–24 months out; constrained supply supports both.
Investment metrics
- 1% rule
- 0.93% ✗
- Cap rate
- 7.88%
- Cash-on-cash
- 5.65%
- DSCR
- 1.25
- GRM
- 9.0
CMA / ARV
- ARV (median comp)
- $78,275
- List price
- $105,000
- Delta
- 34.14%
- Verdict
- OVERPRICED
- Comps
- 20 within 1.0 mi
Show comp detail 12 sales within ~0.75 mi
| Address | Dist | Beds/Ba | Sqft | Sold | Price | $/sf | Match |
|---|---|---|---|---|---|---|---|
| 750 W Oak St | 0.12mi | 3/2.0 (+1) | 1,065 (-1%) | 7mo | $144,000 | $135 | 77 |
| 508 W 5th St | 0.34mi | 2/1.5 | 1,064 (-2%) | 7mo | $144,000 | $135 | 74 |
| 316 W 8th St | 0.49mi | 2/1.5 | 1,117 (+3%) | 1mo | $103,000 | $92 | 69 |
| 119 Lemon St | 0.59mi | 2/1.0 | 1,120 (+4%) | 7mo | $105,500 | $94 | 60 |
| 221 W 11th St | 0.67mi | 2/1.0 | 1,055 (-2%) | 7mo | $46,000 | $44 | 59 |
| 418 W 7th St | 0.41mi | 3/2.0 (+1) | 1,140 (+6%) | 5mo | $99,900 | $88 | 58 |
| 312 E 2nd St. St | 0.69mi | 2/1.0 | 1,121 (+4%) | 10mo | $130,000 | $116 | 53 |
| 312 E 4th St | 0.67mi | 2/2.0 | 1,058 (-2%) | 10mo | $170,000 | $161 | 53 |
| 412 W 6th St | 0.39mi | 3/2.0 (+1) | 1,224 (+13%) | 0mo | $167,000 | $136 | 50 |
| 707 S Durbin St | 0.73mi | 3/2.0 (+1) | 1,112 (+3%) | 3mo | $125,000 | $112 | 49 |
| 819 S Main St | 0.72mi | 2/1.5 | 1,162 (+8%) | 5mo | $48,000 | $41 | 48 |
| 703 S Durbin St | 0.73mi | 3/2.0 (+1) | 1,112 (+3%) | 9mo | $144,000 | $129 | 44 |
Match score weights: distance 35% · size 25% · config 20% · recency 20%. Top-matched comps best support the ARV.
Projected returns pro-forma
-3.0% appreciation · 3.0% rent growth · sell at horizon
- IRR
- -7.6%
- Equity multiple
- 0.72×
- Total profit
- $-8,240
- Equity at exit
- $15,656
- IRR
- 1.9%
- Equity multiple
- 1.14×
- Total profit
- $4,001
- Equity at exit
- $9,078
Cash invested: $29,400 (down + closing). Projections, not guarantees.
Landlord ↔ Tenant lean methodology
- Overall (STATE)
- 90 Strongly Landlord-Friendly
- State Indiana
- 90 Strongly Landlord-Friendly · R+11
- County
- — inherits STATE
- City
- — inherits STATE
ZIP-level market 47512
- Home prices YoY
- -32.1%
- Active inventory
- 34
- Price-to-rent
- 9.0×
Monthly cashflow live
- Estimated rent
- $974 medium interval (Pro) →
- Mortgage (P&I)
- −$551
- Tax from tax record
- −$36 /mo · $435/yr
- Insurance
- −$44
- HOA
- −$0
- Vacancy / Maint / Mgmt
- −$204
- Net cashflow
- $138
Break-even live
Sensitivity live
| Price | -10% $198 | -5% $168 | +0% $138 | +5% $109 | +10% $79 |
|---|---|---|---|---|---|
| Rent | -10% $62 | -5% $100 | +0% $138 | +5% $177 | +10% $215 |
| Rate | -1.0pp $191 | -0.5pp $165 | base $138 | +0.5pp $111 | +1.0pp $84 |
UW: 25.0% down · 7.5% · 30yr · 1.5% tax · 5.0% vac · 8.0% maint · 8.0% mgmt
Financing live
Cash to close
- Down payment
- $26,250
- Closing costs
- $3,150
- Reserves months
- —
- Total cash needed
- —
Loan-product check · same deal, 3 products live
Conventional
25% down · 7.5% · 30yr
- Down + closing
- —
- Monthly P&I
- —
- Monthly cashflow
- —
- DSCR
- —
- Eligible?
- —
Personal DTI + credit; lowest rate.
DSCR
20% down · 8.5% · 30yr
- Down + closing
- —
- Monthly P&I
- —
- Monthly cashflow
- —
- DSCR
- —
- Eligible?
- —
No personal income docs; deal must DSCR.
Hard money
10% down · 12.0% · 12mo
- Down + closing
- —
- Monthly P&I
- —
- Monthly cashflow
- —
- DSCR
- —
- Eligible?
- —
Short-term bridge; refi at stabilization.
Listing history 19 events
-
2026-06-21days on market $105,000 Active 53 DOM
-
2026-06-18days on market $105,000 Active 51 DOM
-
2026-06-17days on market $105,000 Active 50 DOM
-
2026-06-16days on market $105,000 Active 49 DOM
-
2026-06-15days on market $105,000 Active 48 DOM
-
2026-06-13days on market $105,000 Active 46 DOM
-
2026-06-12days on market $105,000 Active 45 DOM
-
2026-06-09days on market $105,000 Active 42 DOM
-
2026-06-08days on market $105,000 Active 41 DOM
-
2026-06-07days on market $105,000 Active 40 DOM
-
2026-06-05days on market $105,000 Active 38 DOM
-
2026-06-04days on market $105,000 Active 36 DOM
-
2026-06-02days on market $105,000 Active 35 DOM
-
2026-06-01days on market $105,000 Active 34 DOM
-
2026-05-31days on market $105,000 Active 33 DOM
-
2026-05-31days on market $105,000 Active 32 DOM
-
2026-05-05status Active 390-char remark
Show marketing remark (390 chars)
Charming 2 bed, 1 bath bungalow on a spacious 0.5 acre +/- lot located on a dead-end street in Bicknell. Home features updated flooring in kitchen, back porch, and bathroom, with a walk-in shower, replacement vinyl windows, central air, and all appliances included. Exterior features include circle drive, carport with ramp access, wooden shed, and is located in North Knox School District.
-
2026-04-27status Pending 390-char remark
Show marketing remark (390 chars)
Charming 2 bed, 1 bath bungalow on a spacious 0.5 acre +/- lot located on a dead-end street in Bicknell. Home features updated flooring in kitchen, back porch, and bathroom, with a walk-in shower, replacement vinyl windows, central air, and all appliances included. Exterior features include circle drive, carport with ramp access, wooden shed, and is located in North Knox School District.
-
2026-04-20$105,000 Active 390-char remark
Show marketing remark (390 chars)
Charming 2 bed, 1 bath bungalow on a spacious 0.5 acre +/- lot located on a dead-end street in Bicknell. Home features updated flooring in kitchen, back porch, and bathroom, with a walk-in shower, replacement vinyl windows, central air, and all appliances included. Exterior features include circle drive, carport with ramp access, wooden shed, and is located in North Knox School District.
ⓘ Source: listings_history table (triggers on properties + properties_extension) + one-shot
backfill from property_details.listing_events for pre-trigger history.
Tax reassessment forecast IN · Partial reset (capped growth)
- Current annual tax
- $435 · $36/mo
- Projected year-2 tax
- $664 · $55/mo
- Expected delta
- +$229/yr (+$19/mo · 52.6%)
ⓘ Screening estimate from a state-policy table — verify with the county assessor before closing.
Climate risk First Street
- Flood 1/10 Low 0% chance over 30 yrs
- Wildfire 1/10 Low
- Heat 4/10 Moderate 7 d/yr ≥106°F today · 19 d/yr by 30 yrs out
- Wind 2/10 Low 2% chance of damaging wind over 30 yrs
- Air quality 2/10 Low 1 unhealthy d/yr today · 2 by 30 yrs out
Nearby sold comps map
Loading sold comps map…
Walkable amenities ~0.75 mi
Loading nearby amenities…
Taxation est. · year 1
- Rental income
- $11,682
- − Mortgage interest
- −$5,882
- − Property taxes
- −$435
- − Insurance
- −$525
- − Repairs & maintenance
- −$935
- − Management
- −$935
- − Depreciation
- −$3,055
- Taxable loss
- −$83
- Est. tax savings @ 24.0%
- +$20
- After-tax cash flow
- $1,681/yr
For passive investors: Depreciation is non-cash, so a rental often shows a tax loss while cash-flowing — sheltering income. Rental losses are passive: they offset passive income freely, and up to $25,000/yr can offset ordinary (W-2) income if you actively participate and your MAGI is under $100k (phasing out to $0 by $150k); unused losses carry forward. On sale, claimed depreciation is recaptured at up to 25%, and gains may owe capital-gains tax (a 1031 exchange can defer both). Figures are a year-1 estimate at your 24.0% rate — not tax advice; consult a CPA.
Schools (NCES district)
- District
- North Knox School Corporation
- NCES district ID
- 1807830
- Math proficiency
- 28% ▼ -11.00%
- Reading proficiency
- 45% ▼ -3.00%
- Median HH income
- $42,553
- Composite
- 30.82/100
- National rank
- #6139
- State rank
- #186 of 301 in IN
Livability — Bicknell
- Score
- 64/100
- State rank
- #373
- US rank
- #13970
Category grades
Schools grade is shown separately in the Schools card above.
Census & demographics
- Census place
- Bicknell, IN
- City population
- 4,216
- Population (ZIP)
- 4,216
Population outlook (Knox County) Hauer SSP2
- Today (2025)
- 37,092 people
- By 2030
- 36,271 · -2.2%
- By 2040
- 34,196 · -7.8%
- By 2050
- 32,405 · -12.6%
- By 2075
- 28,754 · -22.5%
- By 2100
- 24,110 · -35.0%
Race, ethnicity, and origin ACS 2023
- Neighborhood character
- Predominantly White (91%)
- Race & ethnicity
- White 91% Two or more races 7% Hispanic / Latino 2%
- Common ancestry
- Italian 3% Lithuanian 1% Iranian 1%
- Foreign-born
- 1%
- Languages at home
- 98% English-only · Tagalog/Filipino 1% Spanish 1%
Political lean MEDSL · Knox
- 2024 margin
- Solid R (+50.4) · D 24.0% · R 74.4% · Other 1.6%
- 2008→2024 swing
- -43.9pp toward R · 2008: -6.5pp · 2024: -50.4pp
- All cycles
- 2024: R+50.4 2020: R+47.4 2016: R+47.2 2012: R+28.9 2008: R+6.5
Not yet ingested
- Civics
- —
Market trends
- HPI YoY
- ▼ -90.85%
- Current HPI
- 191.8851
- Rent YoY
- —
- Metro
- —
- State GDP YoY
- ▲ 2.90%
- F500 in state
- 18
Industry mix (Fortune 500 HQ in IN)
| Industry | F500 HQs | Revenue |
|---|---|---|
| Industrial Machinery | 2 | $37B |
|
||
| Healthcare | 1 | $177B |
|
||
| Pharmaceuticals | 1 | $45B |
|
||
| Metals / Steel | 1 | $18B |
|
||
| Agriculture | 1 | $17B |
|
||
| Packaging | 1 | $12B |
|
||
Price history
3 events — show timeline
- 2026-05-05 Relisted — IRMLS
- 2026-04-27 Pending — IRMLS
- 2026-04-20 Listed $105,000 IRMLS
Property tax history
-8.1%/yrLatest (2024): $435 · -49.5% YoY. Source: county tax records.
Cash-flow waterfall
monthlySold comps — $/sqft
last 12 mo · ≤1 miLoading sold comps…