469 NE 64th Ave · Silver Springs, FL
Flood risk 1/10 · Minimal
- FEMA flood zone
- X (unshaded)
- Chance of flooding over 30 yrs
- 0.0%
- Est. flood insurance / yr
- $507 – $1,088
Fire risk 5/10 · Moderate
- Est. fire insurance / yr
- $947 – $1,759
Heat risk 8/10 · Major
- Hot days now (above 108°F)
- 7 days/yr
- Hot days in 30 yrs
- 21 days/yr
Wind risk 9/10 · Severe
- Chance of severe wind over 30 yrs
- 99.0%
Air-quality risk 4/10 · Minor
- Unhealthy air days now
- 4 days/yr
- Unhealthy air days in 30 yrs
- 4 days/yr
Risk factors via First Street. Map © Google.
Why this score? — see what drove the D+ grade
The composite is a weighted blend of 9 inputs, each scored 0–100. Each bar is that input's sub-score; the figure is the points it added to the 100-point composite (weight × sub-score).
- Cash flow +22.4/30.0
- DSCR +7.2/10.0
- 1% rule +6.2/10.0
- Schools +3.6/10.0
- Rent growth +2.5/5.0
- Livability +2.5/5.0
- Condition / age +2.5/5.0
- ARV discount +1.0/15.0
- Appreciation +0.0/10.0
$150,000
🖨 Deal sheet 📄 Offer letter ✓ Due diligence
Listing remarks MLS
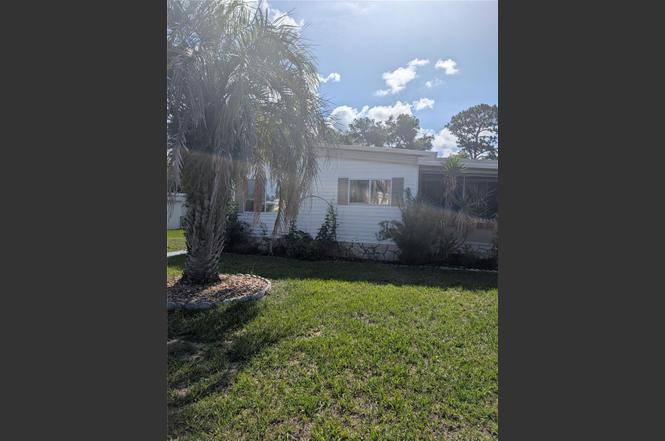
BACK ON THE MARKET!!!! Priced below appraised value. Bring your Cash Offer today and close as soon as you are ready. . Beautifully maintained and updated doublewide mobile home in the sought after Ocala East Villas community, Where you own your own land. This immaculate home has an open floor plan that allows you to enjoy the Kitchen and look out over your seated kitchen bar into the dining room. The bedrooms are spacious, and the whole home is ready to move into. Enjoy the evenings on your screened in porch, or have your morning coffee seated in your secluded covered patio. Two sheds allow for ample storage or even a He shed/ She shed. Laundry hook-ups inside as well as in the connected shed. Come enjoy the wonderfully maintained community. Pool, Clubhouse, RV parking, water, sewer, trash pickup, and common area maintenance are all included in the low HOA dues $77/mo.
Key facts
- Spacious living area
- Private bath
- New subfloor
Tags
Property features AI
Finance
- Financial info: Total monthly fees $150; total annual fees $1,800
- HOA & community: Monthly association fee of $150 (includes water, sewer, trash); Community amenities include clubhouse and pool; Senior community; pets not allowed
Exterior
- Parking: Covered parking with a 1-car carport
- Utilities: Public water; Public sewer; Electricity available; Cable available
- Home design: Residential double-wide mobile home; Single-story (one level); Faces northeast
- Construction: Vinyl siding; Metal roof; Crawlspace foundation; Built as a double wide
- Exterior features: Covered, screened porch/patio; Shed(s) and workshop for storage
Interior
- Kitchen: Dishwasher; Microwave; Refrigerator
- Bedrooms: 3 bedrooms
- Flooring: Vinyl flooring
- Bathrooms: 2 full bathrooms
- Heating & cooling: Central heating; Central air conditioning
- Interior features: Open floorplan with living room/dining room combo; Blinds on windows
- Laundry & utility: Laundry area inside
Neighborhood map
What this means for you Summary
Snapshot
- This is a 3-bed/2.0-bath manufactured listed at $150k.
Deal economics
- At list price, monthly cash flow is $250 ($3k/yr) — positive.
- The deal already cash-flows at list — no discount required.
- Meets the 1% rule at list price ($2k rent vs $150k).
- Cap rate 8.3% vs local median 4.2% in Silver Springs — top-decile yield for the area; either an underpriced asset or a hidden risk that comps aren't pricing in. Stress-test before assuming the spread holds.
Location & tenants
- Location reads: area grade D — affects rentability + tenant quality, not the cash-flow math above.
- Marion (rural): math 42% / reading 43% proficiency, ranked #61 of 73 in FL (top 84%) — families likely to look elsewhere, expect single-tenant / working-renter base with shorter leases; 61% free/reduced lunch — lower-income household profile, screen leases tightly.
- Zoned schools: Ocala Springs Elementary School (math 56% / reading 45%, grade D+, #1,055 of 2,144 statewide, top 50%, 690 students, 67% FRL); Forest High School (math 36% / reading 54%, grade D-, #228 of 667 statewide, top 35%, 2,325 students, 42% FRL).
- Market conditions: Rents soft (-0.1%/yr); 294 active listings in the ZIP; 9 comparable units currently listed for rent nearby; rentals at typical pace (median 21d on market — plan ~3-4 weeks tenant-placement turnaround); 7,071 units permitted in Marion County in 2024 (534 in 5+ unit buildings).
- This rent runs 39% of the median local income ($52k/yr) — at the standard rent-burdened threshold; future hikes will face affordability resistance.
Forward outlook
- Local home prices are declining (-3.0%/yr); year-one equity from $1k of loan paydown is wiped out by about $4k of value loss. Plan a longer hold.
- Marion County population projected at +13% by 2050 — modest demand growth; plan on rents tracking national, not racing it.
Negotiation context
- Only 3 days on market — expect competitive offers; lowballing is unlikely to land.
- 7 sale attempts since 15y ago with the ask held roughly flat each time — persistent listings suggest the price (not the market) is what's stuck; bring a comps-based counter.
- Current owner paid $90k; list at $150k implies a 67% gain — meaningful room to come down on a strong offer.
Risks & watch-outs
- Climate carrying-cost: severe wind risk, 99% chance of damaging wind over 30y; moderate wildfire risk; extreme-heat days projected 7→21/yr by 2055 (HVAC capex compounding) — expect insurance premiums to compound above CPI over the hold.
Questions for the listing agent
- Built in 1976 — when were the roof, HVAC, electrical panel, plumbing, and water heater last replaced?
- What does the HOA fee cover, when was the last increase, and are there any pending special assessments or reserve-fund shortfalls?
- Is there a deadline driving the sale (1031 exchange, divorce, estate, relocation)? That informs how much negotiation room exists.
- The area grade is low — what's the realistic commute time and amenity access for the typical tenant pool here? Any planned neighborhood developments (good or bad) we should know about?
- What's the average days-on-market for RENTAL listings here right now (not sales)? A rising rental-DOM trend means longer vacancies and softer asking-rent achievability than the comps imply.
- What's the recent tenant-quality profile in this submarket — average credit score on applications, eviction rate, late-payment / NSF rate, and stable-employment percentage? A property-management company in the area should have these aggregated.
- How much new for-sale + rental construction is in the pipeline within 1–3 miles? Heavy new supply typically softens prices + rents 12–24 months out; constrained supply supports both.
Investment metrics
- 1% rule
- 1.12% ✓
- Cap rate
- 8.29%
- Cash-on-cash
- 7.14%
- DSCR
- 1.32
- GRM
- 7.4
CMA / ARV
- ARV (on-the-fly)
- $131,100
- Comps found
- 3
Show comp detail 3 sales within ~0.75 mi
| Address | Dist | Beds/Ba | Sqft | Sold | Price | $/sf | Match |
|---|---|---|---|---|---|---|---|
| 25 NE 66th Ct | 0.38mi | 3/2.0 | 1,338 (-3%) | 6mo | $114,900 | $86 | 72 |
| 6500 NE 3rd St | 0.16mi | 2/2.0 (-1) | 1,244 (-10%) | 2mo | $144,900 | $116 | 69 |
| 6786 NE 5th Pl | 0.31mi | 2/2.0 (-1) | 1,243 (-10%) | 6mo | $118,000 | $95 | 59 |
Match score weights: distance 35% · size 25% · config 20% · recency 20%. Top-matched comps best support the ARV.
Projected returns pro-forma
-3.0% appreciation · 0.0% rent growth · sell at horizon
- IRR
- -8.9%
- Equity multiple
- 0.68×
- Total profit
- $-13,256
- Equity at exit
- $22,365
- IRR
- -4.1%
- Equity multiple
- 0.77×
- Total profit
- $-9,855
- Equity at exit
- $12,969
Cash invested: $42,000 (down + closing). Projections, not guarantees.
Landlord ↔ Tenant lean methodology
- Overall (STATE)
- 87 Strongly Landlord-Friendly
- State Florida
- 87 Strongly Landlord-Friendly · R+3
- County
- — inherits STATE
- City
- — inherits STATE
ZIP-level market 34470
- Home prices YoY
- -27.6%
- Rents YoY
- -0.1%
- Active inventory
- 294
- Price-to-rent
- 7.4×
Monthly cashflow live
- Estimated rent
- $1,679 high interval (Pro) →
- Mortgage (P&I)
- −$787
- Tax from tax record
- −$77 /mo · $926/yr
- Insurance
- −$62
- HOA
- −$150
- Vacancy / Maint / Mgmt
- −$353
- Net cashflow
- $250
Break-even live
UW: 25.0% down · 7.5% · 30yr · 1.5% tax · 5.0% vac · 8.0% maint · 8.0% mgmt
Financing live
Cash to close
- Down payment
- $37,500
- Closing costs
- $4,500
- Reserves months
- —
- Total cash needed
- —
Loan-product check · same deal, 3 products live
Conventional
25% down · 7.5% · 30yr
- Down + closing
- —
- Monthly P&I
- —
- Monthly cashflow
- —
- DSCR
- —
- Eligible?
- —
Personal DTI + credit; lowest rate.
DSCR
20% down · 8.5% · 30yr
- Down + closing
- —
- Monthly P&I
- —
- Monthly cashflow
- —
- DSCR
- —
- Eligible?
- —
No personal income docs; deal must DSCR.
Hard money
10% down · 12.0% · 12mo
- Down + closing
- —
- Monthly P&I
- —
- Monthly cashflow
- —
- DSCR
- —
- Eligible?
- —
Short-term bridge; refi at stabilization.
Rent comps 9 comps
| Address | Beds | Baths | Sqft | Rent | $/sqft | DOM | Units | Dist |
|---|---|---|---|---|---|---|---|---|
| 15 NE 63rd Ct Ocala, FL | 3.0 | 2.0 | 1500 | $1,700 | $1.13 | 21d | 1 | 0.33mi |
| 6859 NE 1st Pl Ocala, FL | 3.0 | 2.0 | 1250 | $1,400 | $1.12 | 21d | 1 | 0.39mi |
| 6772 NE 1st St Unit Na Ocala, FL | 3.0 | 2.0 | 1300 | $1,500 | $1.15 | 13d | 1 | 0.41mi |
| 6858 NE 2nd Loop Ocala, FL | 2.0 | 2.0 | 950 | $1,250 | $1.32 | 21d | 1 | 0.42mi |
| 100 SE 68th Ct Ocala, FL | 3.0 | 2.0 | 1612 | $1,850 | $1.15 | 21d | 1 | 0.50mi |
| 6001 SE 4th Pl Ocala, FL | 3.0 | 2.0 | 1865 | $2,295 | $1.23 | 13d | 1 | 0.69mi |
| 5725 SE 3rd Pl Ocala, FL | 3.0 | 2.0 | 1608 | $1,550 | $0.96 | 21d | 1 | 0.72mi |
| 1503 Peachtree Ln Ocala, FL | 2.0 | 2.0 | 1152 | $1,450 | $1.26 | 21d | 1 | 1.29mi |
| 4907 NE 6th St Ocala, FL | 3.0 | 2.0 | 1864 | $2,200 | $1.18 | 21d | 1 | 1.34mi |
HOA detail
- Monthly dues
- $150 · $1,800/yr
- Likely covers
- watersewertrashpool
Listing history 4 events
-
2026-06-18days on market $150,000 Active 3 DOM
-
2026-06-17days on market $150,000 Active 2 DOM
-
2026-06-15remarks 699-char remark
-
2026-06-15$150,000 Active 1 DOM
ⓘ Source: listings_history table (triggers on properties + properties_extension) + one-shot
backfill from property_details.listing_events for pre-trigger history.
Tax reassessment forecast FL · Resets to sale price
- Current annual tax
- $926 · $77/mo
- Projected year-2 tax
- $1,245 · $104/mo
- Expected delta
- +$319/yr (+$27/mo · 34.5%)
ⓘ Screening estimate from a state-policy table — verify with the county assessor before closing.
Climate risk First Street
- Flood 1/10 Low FEMA zone X (unshaded) · 0% chance over 30 yrs
- Wildfire 5/10 Major
- Heat 8/10 Severe 7 d/yr ≥108°F today · 21 d/yr by 30 yrs out
- Wind 9/10 Extreme 99% chance of damaging wind over 30 yrs
- Air quality 4/10 Moderate 4 unhealthy d/yr today · 4 by 30 yrs out
Nearby sold comps map
Loading sold comps map…
Walkable amenities ~0.75 mi
Loading nearby amenities…
Taxation est. · year 1
- Rental income
- $20,145
- − Mortgage interest
- −$8,402
- − Property taxes
- −$926
- − Insurance
- −$750
- − Repairs & maintenance
- −$1,612
- − Management
- −$1,612
- − HOA
- −$1,800
- − Depreciation
- −$4,364
- Taxable income
- $680
- Est. tax owed @ 24.0%
- −$163
- After-tax cash flow
- $2,836/yr
For passive investors: Depreciation is non-cash, so a rental often shows a tax loss while cash-flowing — sheltering income. Rental losses are passive: they offset passive income freely, and up to $25,000/yr can offset ordinary (W-2) income if you actively participate and your MAGI is under $100k (phasing out to $0 by $150k); unused losses carry forward. On sale, claimed depreciation is recaptured at up to 25%, and gains may owe capital-gains tax (a 1031 exchange can defer both). Figures are a year-1 estimate at your 24.0% rate — not tax advice; consult a CPA.
Schools (NCES district)
- District
- Marion
- NCES district ID
- 1201260
- Math proficiency
- 42% ▼ -7.00%
- Reading proficiency
- 43% ▼ -4.00%
- Median HH income
- $40,015
- Composite
- 35.61/100
- National rank
- #4890
- State rank
- #61 of 73 in FL
Livability — Silver Springs
No livability data for this city. (Only ~50 U.S. cities are tracked.)
Census & demographics
- County
- Marion County · 315,796 people
- Metro
- Ocala, FL
- Population (ZIP)
- 22,443
- Household income
- $52,083
- Rent vs Own
- Severe rent burden
- 771.0
Population outlook (Marion County) Hauer SSP2
- Today (2025)
- 365,905 people
- By 2030
- 376,768 · +3.0%
- By 2040
- 396,555 · +8.4%
- By 2050
- 412,723 · +12.8%
- By 2075
- 446,090 · +21.9%
- By 2100
- 436,193 · +19.2%
Race, ethnicity, and origin ACS 2023
- Neighborhood character
- Predominantly White (71%)
- Race & ethnicity
- White 71% Two or more races 12% Hispanic / Latino 12% Black 10% Asian 1%
- Hispanic origin (detail)
- Mexican 2% Puerto Rican 6% Cuban 1%
- Common ancestry
- Lithuanian 3% Romanian 2% Italian 2%
- Foreign-born
- 6% · Canada, Jamaica, Vietnam
- Languages at home
- 89% English-only · Spanish 9%
Political lean MEDSL · Marion
- 2024 margin
- Solid R (+31.6) · D 33.8% · R 65.5%
- 2008→2024 swing
- -20.0pp toward R · 2008: -11.6pp · 2024: -31.6pp
- All cycles
- 2024: R+31.6 2020: R+25.9 2016: R+26.2 2012: R+16.2 2008: R+11.6
Not yet ingested
- Civics
- —
Market trends
- HPI YoY
- ▼ -92.74%
- Current HPI
- 242.686
- Rent YoY
- ▼ -0.07%
- Metro
- Ocala, FL
- State GDP YoY
- ▲ 3.28%
- F500 in state
- 36
Industry mix (Fortune 500 HQ in FL)
| Industry | F500 HQs | Revenue |
|---|---|---|
| Industrial Technology | 2 | $29B |
|
||
| Insurance | 2 | $17B |
|
||
| Retail | 1 | $60B |
|
||
| Technology Distribution | 1 | $58B |
|
||
| Homebuilding | 1 | $35B |
|
||
| Technology Manufacturing | 1 | $35B |
|
||
Price history
+455.6% since first listed19 events — show timeline
- 2026-06-15 Listed $150,000 Stellar MLS as Distributed by MLS Grid
- 2025-11-06 Listing Removed — Stellar MLS as Distributed by MLS Grid
- 2025-08-29 Relisted — Stellar MLS as Distributed by MLS Grid
- 2025-08-29 Price Changed $139,900 Stellar MLS as Distributed by MLS Grid
- 2025-07-09 Pending — Stellar MLS as Distributed by MLS Grid
- 2025-06-09 Listed $134,900 Stellar MLS as Distributed by MLS Grid
- 2020-12-02 Sold (Public Records) $90,000 Public Records
- 2020-11-19 Sold (MLS) $90,000 Stellar MLS as Distributed by MLS Grid
- 2020-07-06 Listed $91,500 Stellar MLS as Distributed by MLS Grid
- 2017-11-07 Sold (Public Records) $65,900 Public Records
- 2017-10-19 Sold (MLS) $65,900 Stellar MLS as Distributed by MLS Grid
- 2017-09-18 Listed $69,900 Stellar MLS as Distributed by MLS Grid
- 2012-06-11 Sold (Public Records) $45,000 Public Records
- 2012-06-07 Sold (MLS) $45,000 Stellar MLS as Distributed by MLS Grid
- 2012-06-07 Sold (MLS) $45,000 Stellar MLS as Distributed by MLS Grid
- 2012-03-13 Listed $49,900 Stellar MLS as Distributed by MLS Grid
- 2011-11-03 Listed $49,900 Stellar MLS as Distributed by MLS Grid
- 1989-02-01 Sold (Public Records) $34,100 Public Records
- 1987-06-01 Sold (Public Records) $27,000 Public Records
Property tax history
+8.4%/yrLatest (2025): $926 · +17.9% YoY. Source: county tax records.
Cash-flow waterfall
monthlySold comps — $/sqft
last 12 mo · ≤1 miLoading sold comps…