101 SE 298th St · Cross City, FL
Flood risk 6/10 · Moderate
- FEMA flood zone
- X (unshaded)
- Chance of flooding over 30 yrs
- 0.74%
- Est. flood insurance / yr
- $507 – $1,088
Fire risk 6/10 · Moderate
- Est. fire insurance / yr
- $947 – $1,759
Heat risk 8/10 · Major
- Hot days now (above 105°F)
- 7 days/yr
- Hot days in 30 yrs
- 23 days/yr
Wind risk 9/10 · Severe
- Chance of severe wind over 30 yrs
- 99.0%
Air-quality risk 2/10 · Minimal
- Unhealthy air days now
- 1 days/yr
- Unhealthy air days in 30 yrs
- 2 days/yr
Risk factors via First Street. Map © Google.
Why this score? — see what drove the C+ grade
The composite is a weighted blend of 9 inputs, each scored 0–100. Each bar is that input's sub-score; the figure is the points it added to the 100-point composite (weight × sub-score).
- Cash flow +18.7/30.0
- ARV discount +15.0/15.0
- Appreciation +7.1/10.0
- DSCR +5.9/10.0
- Schools +4.2/10.0
- 1% rule +4.0/10.0
- Livability +3.5/5.0
- Rent growth +2.5/5.0
- Condition / age +2.5/5.0
$129,000
🖨 Deal sheet (PDF) 📄 Offer letter ✓ Due diligence
Listing remarks
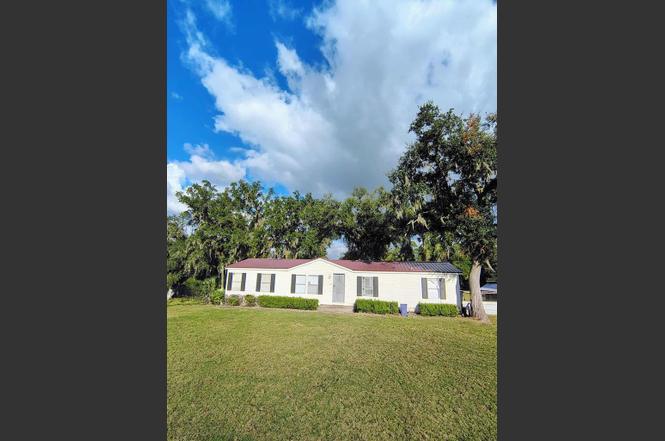
Discover this charming 3-bedroom, 2-bathroom family home featuring a cozy fireplace and a spacious separate living room, all nestled on a generous 0.42-acre lot in Cross City, FL, in Dixie County. This property presents an incredible opportunity for investors or first-time buyers looking to create their perfect place. With just a little TLC, you can transform this space into a stunning haven. Don't miss out on this fantastic chance to invest in your future!
Key facts
- 0.42 acre lot
- Built 1997
- Listed 169 days
Property features AI
Finance
- Financial info: $731.47 annual tax amount
Exterior
- Home design: Residential mobile home; Located in Gauldens 2nd Addition
- Construction: Vinyl siding; Metal roof; Built on crawl space
- Exterior features: Wooded lot
Interior
- Kitchen: Refrigerator
- Bedrooms: 7 total rooms (includes bedrooms and living areas)
- Flooring: Carpet; Vinyl
- Bathrooms: 2 full bathrooms
- Interior features: Walk-in closets; Crawl space basement
Neighborhood map
What this means for you Summary
Snapshot
- This is a 3-bed/1.0-bath manufactured listed at $129k.
Deal economics
- At list price, monthly cash flow is $128 ($2k/yr) — positive.
- The deal already cash-flows at list — no discount required.
- To meet the 1% rule (rent ≥ 1% of price), the offer needs to be $117k (9.5% below list).
- Recommended offer: $114k (12.0% below list) — sets the bar for market timing.
- Cap rate 7.5% vs local median 4.1% in Cross City — top-decile yield for the area; either an underpriced asset or a hidden risk that comps aren't pricing in. Stress-test before assuming the spread holds.
Location & tenants
- Location reads 70/100 on livability (#412 in FL) — a middle-class / working-renter tenant base. Strengths: cost of living A+, housing A+, health & safety A+; Watch: amenities F, commute F, employment F.
- Dixie (rural): math 52% / reading 50% proficiency, ranked #36 of 73 in FL (top 49%) — acceptable for families but not a draw, mixed tenant base, ~2y average lease; 85% free/reduced lunch — lower-income household profile, screen leases tightly.
- Zoned schools: Old Town Elementary School (math 73% / reading 58%, grade B+, #500 of 2,144 statewide, top 24%, 456 students, 80% FRL); Ruth Rains Middle School (math 48% / reading 49%, grade C-, #274 of 571 statewide, top 50%, 431 students, 76% FRL); Dixie County High School (math 31% / reading 42%, grade F, #351 of 667 statewide, top 54%, 714 students, 70% FRL).
- Market conditions: 47 active listings in the ZIP; 49 units permitted in Dixie County in 2024 (0 in 5+ unit buildings).
Forward outlook
- In year one you build about $6k of equity ($892 loan paydown + $5k appreciation (4.2% local appreciation)).
- Dixie County population projected at -16% by 2050 — secular population decline; favor cash flow + early exit over multi-decade hold.
- At projected returns (4.2% appreciation + 3.0% rent growth), your $36k cash investment doubles in ~5 years — after that, you're playing with house money.
- By year 6, paydown + projected appreciation supports a ~$33k cash-out refi (75% LTV) — recoverable capital for the next deal without selling this one.
Negotiation context
- It's been on market 170 days — a 12% lower offer ($114k) is reasonable based on typical stale-listing flexibility.
- 2 sale attempts with the ask held roughly flat each time — persistent listings suggest the price (not the market) is what's stuck; bring a comps-based counter.
Risks & watch-outs
- Climate carrying-cost: major flood risk; severe wind risk, 99% chance of damaging wind over 30y; major wildfire risk; extreme-heat days projected 7→23/yr by 2055 (HVAC capex compounding) — expect insurance premiums to compound above CPI over the hold.
Questions for the listing agent
- It's been on market 170 days. Have you received any prior offers? Is the seller open to a 12% concession, seller financing, or rate buy-down credit?
- Why hasn't it sold? Are there any deal-killer items the seller is aware of (foundation, flood, title, zoning, code violations)?
- Is there a deadline driving the sale (1031 exchange, divorce, estate, relocation)? That informs how much negotiation room exists.
- What's the average days-on-market for RENTAL listings here right now (not sales)? A rising rental-DOM trend means longer vacancies and softer asking-rent achievability than the comps imply.
- What's the recent tenant-quality profile in this submarket — average credit score on applications, eviction rate, late-payment / NSF rate, and stable-employment percentage? A property-management company in the area should have these aggregated.
- How much new for-sale + rental construction is in the pipeline within 1–3 miles? Heavy new supply typically softens prices + rents 12–24 months out; constrained supply supports both.
Investment metrics
- 1% rule
- 0.90% ✗
- Cap rate
- 7.48%
- Cash-on-cash
- 4.25%
- DSCR
- 1.19
- GRM
- 9.2
CMA / ARV
- ARV (on-the-fly)
- $168,480
- Comps found
- 1
Show comp detail 1 sale within ~0.75 mi
| Address | Dist | Beds/Ba | Sqft | Sold | Price | $/sf | Match |
|---|---|---|---|---|---|---|---|
| 477 NE 214th Ave | 0.47mi | 3/2.0 | 1,248 (-13%) | 3mo | $146,500 | $117 | 49 |
Match score weights: distance 35% · size 25% · config 20% · recency 20%. Top-matched comps best support the ARV.
Projected returns pro-forma
4.18% appreciation · 3.0% rent growth · sell at horizon
- IRR
- 14.5%
- Equity multiple
- 1.88×
- Total profit
- $31,879
- Equity at exit
- $66,771
- IRR
- 15.5%
- Equity multiple
- 3.56×
- Total profit
- $92,370
- Equity at exit
- $110,314
Cash invested: $36,120 (down + closing). Projections, not guarantees.
Landlord ↔ Tenant lean methodology
- Overall (STATE)
- 87 Strongly Landlord-Friendly
- State Florida
- 87 Strongly Landlord-Friendly · R+3
- County
- — inherits STATE
- City
- — inherits STATE
ZIP-level market 32628
- Home prices YoY
- 1.1%
- Active inventory
- 47
- Price-to-rent
- 9.2×
Monthly cashflow live
- Estimated rent
- $1,167 medium interval (Pro) →
- Mortgage (P&I)
- −$676
- Tax from tax record
- −$64 /mo · $769/yr
- Insurance
- −$54
- HOA
- −$0
- Vacancy / Maint / Mgmt
- −$245
- Net cashflow
- $128
Break-even live
Sensitivity live
| Price | -10% $201 | -5% $164 | +0% $128 | +5% $91 | +10% $55 |
|---|---|---|---|---|---|
| Rent | -10% $36 | -5% $82 | +0% $128 | +5% $174 | +10% $220 |
| Rate | -1.0pp $193 | -0.5pp $161 | base $128 | +0.5pp $94 | +1.0pp $60 |
UW: 25.0% down · 7.5% · 30yr · 1.5% tax · 5.0% vac · 8.0% maint · 8.0% mgmt
Financing live
Cash to close
- Down payment
- $32,250
- Closing costs
- $3,870
- Reserves months
- —
- Total cash needed
- —
Loan-product check · same deal, 3 products live
Conventional
25% down · 7.5% · 30yr
- Down + closing
- —
- Monthly P&I
- —
- Monthly cashflow
- —
- DSCR
- —
- Eligible?
- —
Personal DTI + credit; lowest rate.
DSCR
20% down · 8.5% · 30yr
- Down + closing
- —
- Monthly P&I
- —
- Monthly cashflow
- —
- DSCR
- —
- Eligible?
- —
No personal income docs; deal must DSCR.
Hard money
10% down · 12.0% · 12mo
- Down + closing
- —
- Monthly P&I
- —
- Monthly cashflow
- —
- DSCR
- —
- Eligible?
- —
Short-term bridge; refi at stabilization.
Listing history 19 events
-
2026-06-21days on market $129,000 Active 170 DOM
-
2026-06-21days on market $129,000 Active 169 DOM
-
2026-06-18days on market $129,000 Active 167 DOM
-
2026-06-17days on market $129,000 Active 166 DOM
-
2026-06-16days on market $129,000 Active 165 DOM
-
2026-06-15days on market $129,000 Active 164 DOM
-
2026-06-13days on market $129,000 Active 162 DOM
-
2026-06-12days on market $129,000 Active 161 DOM
-
2026-06-09days on market $129,000 Active 158 DOM
-
2026-06-08days on market $129,000 Active 157 DOM
-
2026-06-07days on market $129,000 Active 156 DOM
-
2026-06-07days on market $129,000 Active 155 DOM
-
2026-06-04days on market $129,000 Active 152 DOM
-
2026-06-02days on market $129,000 Active 151 DOM
-
2026-06-01days on market $129,000 Active 150 DOM
-
2026-05-31days on market $129,000 Active 149 DOM
-
2026-05-31days on market $129,000 Active 148 DOM
-
2026-01-02$129,000 Active
-
2025-10-02$137,900 Active
ⓘ Source: listings_history table (triggers on properties + properties_extension) + one-shot
backfill from property_details.listing_events for pre-trigger history.
Tax reassessment forecast FL · Resets to sale price
- Current annual tax
- $769 · $64/mo
- Projected year-2 tax
- $1,071 · $89/mo
- Expected delta
- +$302/yr (+$25/mo · 39.2%)
ⓘ Screening estimate from a state-policy table — verify with the county assessor before closing.
Climate risk First Street
- Flood 6/10 Major FEMA zone X (unshaded) · 74% chance over 30 yrs
- Wildfire 6/10 Major
- Heat 8/10 Severe 7 d/yr ≥105°F today · 23 d/yr by 30 yrs out
- Wind 9/10 Extreme 99% chance of damaging wind over 30 yrs
- Air quality 2/10 Low 1 unhealthy d/yr today · 2 by 30 yrs out
Nearby sold comps map
Loading sold comps map…
Walkable amenities ~0.75 mi
Loading nearby amenities…
Taxation est. · year 1
- Rental income
- $14,007
- − Mortgage interest
- −$7,226
- − Property taxes
- −$769
- − Insurance
- −$645
- − Repairs & maintenance
- −$1,121
- − Management
- −$1,121
- − Depreciation
- −$3,753
- Taxable loss
- −$627
- Est. tax savings @ 24.0%
- +$150
- After-tax cash flow
- $1,684/yr
For passive investors: Depreciation is non-cash, so a rental often shows a tax loss while cash-flowing — sheltering income. Rental losses are passive: they offset passive income freely, and up to $25,000/yr can offset ordinary (W-2) income if you actively participate and your MAGI is under $100k (phasing out to $0 by $150k); unused losses carry forward. On sale, claimed depreciation is recaptured at up to 25%, and gains may owe capital-gains tax (a 1031 exchange can defer both). Figures are a year-1 estimate at your 24.0% rate — not tax advice; consult a CPA.
Schools (NCES district)
- District
- Dixie
- NCES district ID
- 1200450
- Math proficiency
- 52% ▼ -3.00%
- Reading proficiency
- 50% ▼ -4.00%
- Median HH income
- $34,799
- Composite
- 42.18/100
- National rank
- #3290
- State rank
- #36 of 73 in FL
Livability — Cross City
- Score
- 70/100
- State rank
- #412
- US rank
- #7340
Category grades
Schools grade is shown separately in the Schools card above.
Census & demographics
- Census place
- Cross City, FL
- Population (ZIP)
- 5,423
Population outlook (Dixie County) Hauer SSP2
- Today (2025)
- 15,122 people
- By 2030
- 14,521 · -4.0%
- By 2040
- 13,503 · -10.7%
- By 2050
- 12,671 · -16.2%
- By 2075
- 10,857 · -28.2%
- By 2100
- 8,344 · -44.8%
Race, ethnicity, and origin ACS 2023
- Neighborhood character
- Diverse neighborhood (Simpson 0.59)
- Race & ethnicity
- White 61% Black 18% Two or more races 15% Hispanic / Latino 7% Asian 1%
- Hispanic origin (detail)
- Cuban 2%
- Common ancestry
- Italian 1% Hispanic 1% Romanian 1%
- Foreign-born
- 3% · Canada
- Languages at home
- 93% English-only · Spanish 5% Arabic 1% Other Asian/Pacific 1%
Political lean MEDSL · Dixie
- 2024 margin
- Solid R (+70.4) · D 14.5% · R 84.9%
- 2008→2024 swing
- -25.4pp toward R · 2008: -45.0pp · 2024: -70.4pp
- All cycles
- 2024: R+70.4 2020: R+66.0 2016: R+63.2 2012: R+46.9 2008: R+45.0
Not yet ingested
- Civics
- —
Market trends
- HPI YoY
- ▲ 4.18%
- Current HPI
- 398.3675
- Rent YoY
- —
- Metro
- —
- State GDP YoY
- ▲ 3.28%
- F500 in state
- 36
Industry mix (Fortune 500 HQ in FL)
| Industry | F500 HQs | Revenue |
|---|---|---|
| Industrial Technology | 2 | $29B |
|
||
| Insurance | 2 | $17B |
|
||
| Retail | 1 | $60B |
|
||
| Technology Distribution | 1 | $58B |
|
||
| Homebuilding | 1 | $35B |
|
||
| Technology Manufacturing | 1 | $35B |
|
||
Price history
-6.5% since first listed2 events — show timeline
- 2026-01-02 Listed $129,000 DGLMLS
- 2025-10-02 Listed $137,900 DGLMLS
Property tax history
+17.5%/yrLatest (2025): $769 · +4.1% YoY. Source: county tax records.
Cash-flow waterfall
monthlySold comps — $/sqft
last 12 mo · ≤1 miLoading sold comps…