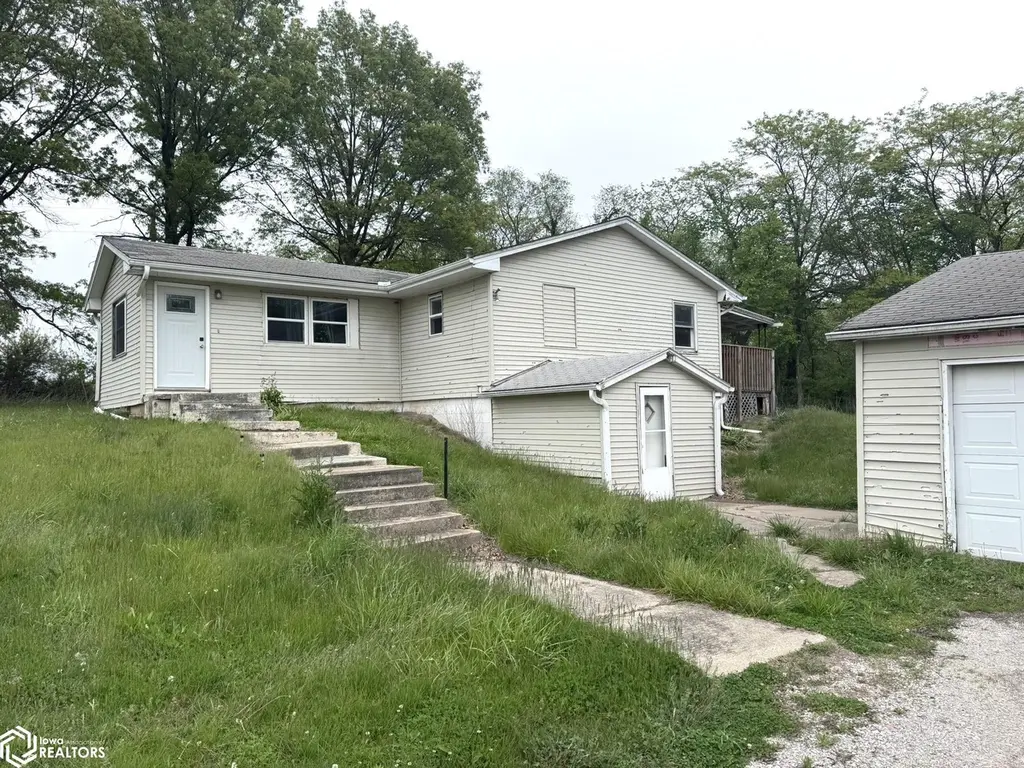
18556 Highway 5 · Centerville, IA
Flood risk 1/10 · Minimal
- FEMA flood zone
- X (unshaded)
- Chance of flooding over 30 yrs
- 0.0%
- Est. flood insurance / yr
- $473 – $860
Fire risk 4/10 · Minor
- Est. fire insurance / yr
- $902 – $1,676
Heat risk 3/10 · Minor
- Hot days now (above 105°F)
- 7 days/yr
- Hot days in 30 yrs
- 14 days/yr
Wind risk 2/10 · Minimal
- Chance of severe wind over 30 yrs
- —
Air-quality risk 2/10 · Minimal
- Unhealthy air days now
- 1 days/yr
- Unhealthy air days in 30 yrs
- 1 days/yr
Risk factors via First Street. Map © Google.
Why this score? — see what drove the C+ grade
The composite is a weighted blend of 9 inputs, each scored 0–100. Each bar is that input's sub-score; the figure is the points it added to the 100-point composite (weight × sub-score).
- Cash flow +18.0/30.0
- ARV discount +15.0/15.0
- 1% rule +5.7/10.0
- DSCR +5.6/10.0
- Appreciation +5.5/10.0
- Schools +5.0/10.0
- Livability +3.7/5.0
- Rent growth +2.5/5.0
- Condition / age +2.5/5.0
$89,000
🖨 Deal sheet 📄 Offer letter ✓ Due diligence
Listing remarks MLS
FSBO For comp purposes only.
Key facts
- 1.2 acres
- Excellent location
- 1.2 acre lot
Tags
Property features AI
Exterior
- Parking: Detached gravel garage with 2 car spaces
- Utilities: Septic tank
- Home design: Single-family residence; Residential property
- Construction: Vinyl siding
- Exterior features: 1.2-acre lot (approximate dimensions: 160 x 330 x 138 x 331)
Interior
- Bathrooms: 2 full bathrooms
- Heating & cooling: Forced air heating; No cooling
- Interior features: Forced air heating
Neighborhood map
What this means for you Summary
Snapshot
- This is a 2-bed/1.0-bath other listed at $89k.
Deal economics
- At list price, monthly cash flow is $76 ($912/yr) — positive.
- The deal already cash-flows at list — no discount required.
- Meets the 1% rule at list price ($950 rent vs $89k).
- Cap rate 7.3% vs local median 4.0% in Centerville — top-decile yield for the area; either an underpriced asset or a hidden risk that comps aren't pricing in. Stress-test before assuming the spread holds.
Location & tenants
- Location reads 73/100 on livability (#277 in IA) — a middle-class / working-renter tenant base. Strengths: cost of living A+, housing A+, health & safety A+; Watch: amenities F, commute F, employment F.
- Centerville Community School District (town): math 57% / reading 65% proficiency, ranked #251 of 289 in IA (top 87%) — acceptable for families but not a draw, mixed tenant base, ~2y average lease.
- Market conditions: 82 active listings in the ZIP; 6 units permitted in Appanoose County in 2024 (0 in 5+ unit buildings).
Forward outlook
- In year one you build about $2k of equity ($615 loan paydown + $961 appreciation (1.1% local appreciation)).
- Appanoose County population projected at -24% by 2050 — secular population decline; favor cash flow + early exit over multi-decade hold.
- At projected returns (1.1% appreciation + 3.0% rent growth), your $25k cash investment doubles in ~8 years — after that, you're playing with house money.
Negotiation context
- Only 9 days on market — expect competitive offers; lowballing is unlikely to land.
- 2 sale attempts since 7y ago with the ask held roughly flat each time — persistent listings suggest the price (not the market) is what's stuck; bring a comps-based counter.
- Current owner paid $20k; list at $89k implies a 345% gain — meaningful room to come down on a strong offer.
Questions for the listing agent
- Built in 1976 — when were the roof, HVAC, electrical panel, plumbing, and water heater last replaced?
- Is there a deadline driving the sale (1031 exchange, divorce, estate, relocation)? That informs how much negotiation room exists.
- Schools are A-rated — typically a magnet for longer-tenancy family renters. What's the average tenant stay here, and is there a school-zone premium baked into asking?
- What's the average days-on-market for RENTAL listings here right now (not sales)? A rising rental-DOM trend means longer vacancies and softer asking-rent achievability than the comps imply.
- What's the recent tenant-quality profile in this submarket — average credit score on applications, eviction rate, late-payment / NSF rate, and stable-employment percentage? A property-management company in the area should have these aggregated.
- How much new for-sale + rental construction is in the pipeline within 1–3 miles? Heavy new supply typically softens prices + rents 12–24 months out; constrained supply supports both.
Investment metrics
- 1% rule
- 1.07% ✓
- Cap rate
- 7.32%
- Cash-on-cash
- 3.66%
- DSCR
- 1.16
- GRM
- 7.8
CMA / ARV
- ARV (median comp)
- $120,336
- List price
- $89,000
- Delta
- -26.04%
- Verdict
- UNDERPRICED
- Comps
- 2 within 2.0 mi
Projected returns pro-forma
1.08% appreciation · 3.0% rent growth · sell at horizon
- IRR
- 5.4%
- Equity multiple
- 1.28×
- Total profit
- $6,905
- Equity at exit
- $30,754
- IRR
- 9.7%
- Equity multiple
- 2.19×
- Total profit
- $29,597
- Equity at exit
- $41,157
Cash invested: $24,920 (down + closing). Projections, not guarantees.
Landlord ↔ Tenant lean methodology
- Overall (STATE)
- 83 Strongly Landlord-Friendly
- State Iowa
- 83 Strongly Landlord-Friendly · R+6
- County
- — inherits STATE
- City
- — inherits STATE
ZIP-level market 52544
- Home prices YoY
- 0.5%
- Active inventory
- 82
- Price-to-rent
- 7.8×
Monthly cashflow live
- Estimated rent
- $950 medium interval (Pro) →
- Mortgage (P&I)
- −$467
- Tax from tax record
- −$171 /mo · $2,052/yr
- Insurance
- −$37
- HOA
- −$0
- Vacancy / Maint / Mgmt
- −$200
- Net cashflow
- $76
Break-even live
UW: 25.0% down · 7.5% · 30yr · 1.5% tax · 5.0% vac · 8.0% maint · 8.0% mgmt
Financing live
Cash to close
- Down payment
- $22,250
- Closing costs
- $2,670
- Reserves months
- —
- Total cash needed
- —
Loan-product check · same deal, 3 products live
Conventional
25% down · 7.5% · 30yr
- Down + closing
- —
- Monthly P&I
- —
- Monthly cashflow
- —
- DSCR
- —
- Eligible?
- —
Personal DTI + credit; lowest rate.
DSCR
20% down · 8.5% · 30yr
- Down + closing
- —
- Monthly P&I
- —
- Monthly cashflow
- —
- DSCR
- —
- Eligible?
- —
No personal income docs; deal must DSCR.
Hard money
10% down · 12.0% · 12mo
- Down + closing
- —
- Monthly P&I
- —
- Monthly cashflow
- —
- DSCR
- —
- Eligible?
- —
Short-term bridge; refi at stabilization.
Listing history 5 events
-
2026-05-14status Pending 224-char remark
-
2026-05-11historical Active Under Contract 224-char remark
-
2026-05-05$89,000 Active 224-char remark
-
2019-05-15soldstatus $20,000 28-char remark
Show marketing remark (28 chars)
FSBO For comp purposes only.
-
2019-05-13$20,000 28-char remark
Show marketing remark (28 chars)
FSBO For comp purposes only.
ⓘ Source: listings_history table (triggers on properties + properties_extension) + one-shot
backfill from property_details.listing_events for pre-trigger history.
Tax reassessment forecast IA · Partial reset (capped growth)
- Current annual tax
- $2,052 · $171/mo
- Projected year-2 tax
- $2,052 · $171/mo
- Expected delta
- $0/yr ($0/mo · 0.0%)
ⓘ Screening estimate from a state-policy table — verify with the county assessor before closing.
Climate risk First Street
- Flood 1/10 Low FEMA zone X (unshaded) · 0% chance over 30 yrs
- Wildfire 4/10 Moderate
- Heat 3/10 Moderate 7 d/yr ≥105°F today · 14 d/yr by 30 yrs out
- Wind 2/10 Low
- Air quality 2/10 Low 1 unhealthy d/yr today · 1 by 30 yrs out
Nearby sold comps map
Loading sold comps map…
Walkable amenities ~0.75 mi
Loading nearby amenities…
Taxation est. · year 1
- Rental income
- $11,405
- − Mortgage interest
- −$4,985
- − Property taxes
- −$2,052
- − Insurance
- −$445
- − Repairs & maintenance
- −$912
- − Management
- −$912
- − Depreciation
- −$2,589
- Taxable loss
- −$491
- Est. tax savings @ 24.0%
- +$118
- After-tax cash flow
- $1,030/yr
For passive investors: Depreciation is non-cash, so a rental often shows a tax loss while cash-flowing — sheltering income. Rental losses are passive: they offset passive income freely, and up to $25,000/yr can offset ordinary (W-2) income if you actively participate and your MAGI is under $100k (phasing out to $0 by $150k); unused losses carry forward. On sale, claimed depreciation is recaptured at up to 25%, and gains may owe capital-gains tax (a 1031 exchange can defer both). Figures are a year-1 estimate at your 24.0% rate — not tax advice; consult a CPA.
Schools (NCES district)
- District
- Centerville Community School District
- NCES district ID
- 1906750
- Math proficiency
- 57% ▼ -8.00%
- Reading proficiency
- 65% ▼ -5.00%
- Median HH income
- $35,401
- Composite
- 50.48/100
- National rank
- #1854
- State rank
- #251 of 289 in IA
Livability — Centerville
- Score
- 73/100
- State rank
- #277
- US rank
- #5375
Category grades
Schools grade is shown separately in the Schools card above.
Census & demographics
- Population (ZIP)
- 8,110
Population outlook (Appanoose County) Hauer SSP2
- Today (2025)
- 11,726 people
- By 2030
- 11,194 · -4.5%
- By 2040
- 10,063 · -14.2%
- By 2050
- 8,976 · -23.5%
- By 2075
- 6,785 · -42.1%
- By 2100
- 4,819 · -58.9%
Race, ethnicity, and origin ACS 2023
- Neighborhood character
- Predominantly White (93%)
- Race & ethnicity
- White 93% Two or more races 4% Hispanic / Latino 2% Black 1%
- Common ancestry
- Italian 6% Lithuanian 3% Slovak 2%
- Foreign-born
- 1% · Canada
- Languages at home
- 94% English-only · German/W. Germanic 5%
Political lean MEDSL · Appanoose
- 2024 margin
- Solid R (+46.7) · D 26.1% · R 72.8% · Other 1.2%
- 2008→2024 swing
- -44.8pp toward R · 2008: -1.9pp · 2024: -46.7pp
- All cycles
- 2024: R+46.7 2020: R+40.2 2016: R+36.4 2012: R+3.5 2008: R+1.9
Not yet ingested
- Civics
- —
Market trends
- HPI YoY
- ▲ 1.08%
- Current HPI
- 212.65
- Rent YoY
- —
- Metro
- —
- State GDP YoY
- ▲ 2.48%
- F500 in state
- 4
Industry mix (Fortune 500 HQ in IA)
| Industry | F500 HQs | Revenue |
|---|---|---|
| Financial Services | 1 | $16B |
|
||
| Retail / Convenience | 1 | $15B |
|
||
Price history
+345.0% since first listed5 events — show timeline
- 2026-05-14 Pending — IAR
- 2026-05-11 Contingent — IAR
- 2026-05-05 Listed $89,000 IAR
- 2019-05-15 Sold (MLS) $20,000 IAR
- 2019-05-13 Listed $20,000 IAR
Property tax history
+4.0%/yrLatest (2025): $2,052 · +0.6% YoY. Source: county tax records.
Cash-flow waterfall
monthlySold comps — $/sqft
last 12 mo · ≤1 miLoading sold comps…