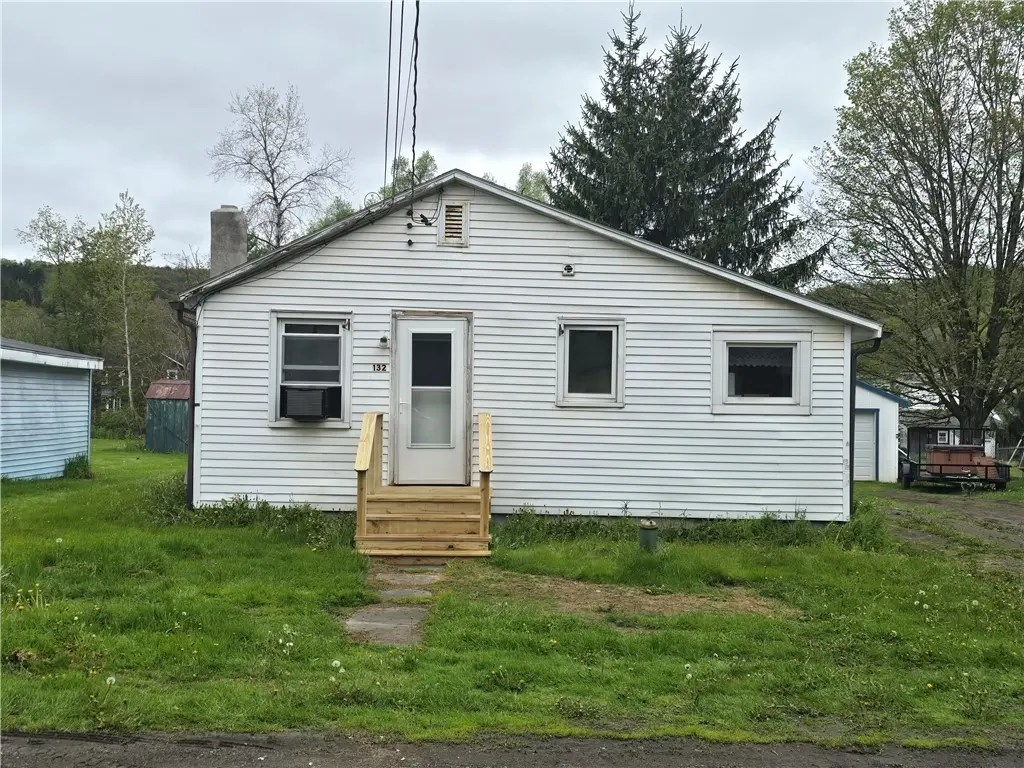
132 Jay St · Unadilla, NY
Flood risk 4/10 · Minor
- FEMA flood zone
- X (unshaded)
- Chance of flooding over 30 yrs
- 0.24%
- Est. flood insurance / yr
- $473 – $860
Fire risk 3/10 · Minor
- Est. fire insurance / yr
- $691 – $1,283
Heat risk 2/10 · Minimal
- Hot days now (above 91°F)
- 8 days/yr
- Hot days in 30 yrs
- 18 days/yr
Wind risk 2/10 · Minimal
- Chance of severe wind over 30 yrs
- 1.0%
Air-quality risk 2/10 · Minimal
- Unhealthy air days now
- 0 days/yr
- Unhealthy air days in 30 yrs
- 1 days/yr
Risk factors via First Street. Map © Google.
Why this score? — see what drove the C grade
The composite is a weighted blend of 9 inputs, each scored 0–100. Each bar is that input's sub-score; the figure is the points it added to the 100-point composite (weight × sub-score).
- Cash flow +16.3/30.0
- Appreciation +10.0/10.0
- ARV discount +7.5/15.0
- DSCR +5.1/10.0
- 1% rule +4.3/10.0
- Schools +3.8/10.0
- Livability +3.0/5.0
- Rent growth +2.5/5.0
- Condition / age +2.5/5.0
$90,000
🖨 Deal sheet (PDF) 📄 Offer letter ✓ Due diligence
Listing remarks
Looking for an affordable place to call home? This snug 2-bedroom home tucked along a quiet road offers comfortable living with important recent upgrades including a new roof, new oil furnace, and new propane hot water heater. A wonderful option for first-time buyers, downsizers, or those seeking a manageable, low-maintenance home.
Key facts
- New oil furnace
- New roof
- 4,792 sq ft lot
Tags
Property features AI
Exterior
- Parking: No garage
- Utilities: Well water; Septic tank
- Home design: Single-story home; Existing structure
- Construction: Vinyl siding; Architectural shingle roof; Pillar/post/pier and slab foundation; Built previously (existing)
- Exterior features: Dirt driveway; Rectangular residential lot; City street frontage; Lot dimensions approximately 50 x 100
Interior
- Kitchen: Gas oven; Gas range; Refrigerator
- Bedrooms: 2 main-level bedrooms
- Flooring: Carpet; Laminate; Varies
- Bathrooms: 1 full bathroom (main level)
- Heating & cooling: Oil forced-air heating; Has heating
- Interior features: Galley kitchen; Bedroom on main level
- Laundry & utility: Washer; Dryer; Laundry on main level; Propane water heater
Neighborhood map
What this means for you Summary
Snapshot
- This is a 2-bed/1.0-bath single-family listed at $90k.
Deal economics
- At list price, monthly cash flow is $50 ($597/yr) — positive.
- The deal already cash-flows at list — no discount required.
- To meet the 1% rule (rent ≥ 1% of price), the offer needs to be $84k (6.7% below list).
- Recommended offer: $84k (6.7% below list) — sets the bar for 1% rule.
- Cap rate 7.0% vs local median 5.5% in Unadilla — meaningfully above typical; check what's discounted (condition, days-on-market, listing class) to confirm the premium yield is real.
Location & tenants
- Location reads 60/100 on livability (#950 in NY) — a middle-class / working-renter tenant base. Strengths: cost of living A+, housing A+; Watch: health & safety C-, employment D, schools F.
- Sidney Central School District (town): math 44% / reading 47% proficiency, ranked #462 of 590 in NY (top 78%) — families likely to look elsewhere, expect single-tenant / working-renter base with shorter leases.
- Market conditions: 14 active listings in the ZIP; 66 units permitted in Delaware County in 2024 (0 in 5+ unit buildings).
Forward outlook
- In year one you build about $10k of equity ($622 loan paydown + $9k appreciation (10.0% local appreciation)).
- Delaware County population projected at -27% by 2050 — secular population decline; favor cash flow + early exit over multi-decade hold.
- At projected returns (10.0% appreciation + 3.0% rent growth), your $25k cash investment doubles in ~3 years — after that, you're playing with house money.
- By year 4, paydown + projected appreciation supports a ~$34k cash-out refi (75% LTV) — recoverable capital for the next deal without selling this one.
Negotiation context
- It's been on market 36 days — a 3% lower offer ($87k) is reasonable based on typical stale-listing flexibility.
- Current owner paid $17k; list at $90k implies a 426% gain — meaningful room to come down on a strong offer.
Risks & watch-outs
- Watch-outs: built in 1940 — expect roof / HVAC / electrical / plumbing capex.
Questions for the listing agent
- It's been on market 36 days. Have you received any prior offers? Is the seller open to a 7% concession, seller financing, or rate buy-down credit?
- Built in 1940 — when were the roof, HVAC, electrical panel, plumbing, and water heater last replaced?
- Is there a deadline driving the sale (1031 exchange, divorce, estate, relocation)? That informs how much negotiation room exists.
- Schools are F-rated, which usually means shorter tenancies and higher turnover. Who's the typical renter profile here, and what's been the actual vacancy rate?
- Crime grade is F in this area — have there been break-ins, vandalism, or insurance claims at this property in the last 3 years? What carrier currently insures it and at what premium?
- What's the average days-on-market for RENTAL listings here right now (not sales)? A rising rental-DOM trend means longer vacancies and softer asking-rent achievability than the comps imply.
- What's the recent tenant-quality profile in this submarket — average credit score on applications, eviction rate, late-payment / NSF rate, and stable-employment percentage? A property-management company in the area should have these aggregated.
- How much new for-sale + rental construction is in the pipeline within 1–3 miles? Heavy new supply typically softens prices + rents 12–24 months out; constrained supply supports both.
Investment metrics
- 1% rule
- 0.93% ✗
- Cap rate
- 6.96%
- Cash-on-cash
- 2.37%
- DSCR
- 1.11
- GRM
- 8.9
CMA / ARV
- ARV (median comp)
- $286,381
- List price
- $90,000
- Delta
- -68.57%
- Verdict
- UNDERPRICED
- Comps
- 1 within 2.0 mi
Projected returns pro-forma
10.0% appreciation · 3.0% rent growth · sell at horizon
- IRR
- 26.0%
- Equity multiple
- 3.07×
- Total profit
- $52,194
- Equity at exit
- $81,079
- IRR
- 22.8%
- Equity multiple
- 7.00×
- Total profit
- $151,225
- Equity at exit
- $174,850
Cash invested: $25,200 (down + closing). Projections, not guarantees.
Landlord ↔ Tenant lean methodology
- Overall (STATE)
- 15 Strongly Tenant-Friendly
- State New York
- 15 Strongly Tenant-Friendly · D+10
- County
- — inherits STATE
- City
- — inherits STATE
ZIP-level market 13839
- Home prices YoY
- 3.1%
- Active inventory
- 14
- Price-to-rent
- 8.9×
Monthly cashflow live
- Estimated rent
- $840 medium interval (Pro) →
- Mortgage (P&I)
- −$472
- Tax from tax record
- −$104 /mo · $1,248/yr
- Insurance
- −$38
- HOA
- −$0
- Vacancy / Maint / Mgmt
- −$176
- Net cashflow
- $50
Break-even live
Sensitivity live
| Price | -10% $101 | -5% $75 | +0% $50 | +5% $24 | +10% $-1 |
|---|---|---|---|---|---|
| Rent | -10% $-17 | -5% $17 | +0% $50 | +5% $83 | +10% $116 |
| Rate | -1.0pp $95 | -0.5pp $73 | base $50 | +0.5pp $26 | +1.0pp $3 |
UW: 25.0% down · 7.5% · 30yr · 1.5% tax · 5.0% vac · 8.0% maint · 8.0% mgmt
Financing live
Cash to close
- Down payment
- $22,500
- Closing costs
- $2,700
- Reserves months
- —
- Total cash needed
- —
Loan-product check · same deal, 3 products live
Conventional
25% down · 7.5% · 30yr
- Down + closing
- —
- Monthly P&I
- —
- Monthly cashflow
- —
- DSCR
- —
- Eligible?
- —
Personal DTI + credit; lowest rate.
DSCR
20% down · 8.5% · 30yr
- Down + closing
- —
- Monthly P&I
- —
- Monthly cashflow
- —
- DSCR
- —
- Eligible?
- —
No personal income docs; deal must DSCR.
Hard money
10% down · 12.0% · 12mo
- Down + closing
- —
- Monthly P&I
- —
- Monthly cashflow
- —
- DSCR
- —
- Eligible?
- —
Short-term bridge; refi at stabilization.
Listing history 17 events
-
2026-06-21days on market $90,000 Active 36 DOM
-
2026-06-18days on market $90,000 Active 34 DOM
-
2026-06-17days on market $90,000 Active 33 DOM
-
2026-06-16days on market $90,000 Active 32 DOM
-
2026-06-15days on market $90,000 Active 31 DOM
-
2026-06-13days on market $90,000 Active 29 DOM
-
2026-06-12days on market $90,000 Active 28 DOM
-
2026-06-09days on market $90,000 Active 25 DOM
-
2026-06-08days on market $90,000 Active 24 DOM
-
2026-06-07days on market $90,000 Active 23 DOM
-
2026-06-07days on market $90,000 Active 22 DOM
-
2026-06-04days on market $90,000 Active 19 DOM
-
2026-06-02days on market $90,000 Active 18 DOM
-
2026-06-01days on market $90,000 Active 17 DOM
-
2026-05-31days on market $90,000 Active 16 DOM
-
2026-05-15$110,000 Active 333-char remark
-
2000-04-14soldstatus $17,100
ⓘ Source: listings_history table (triggers on properties + properties_extension) + one-shot
backfill from property_details.listing_events for pre-trigger history.
Tax reassessment forecast NY · Partial reset (capped growth)
- Current annual tax
- $1,248 · $104/mo
- Projected year-2 tax
- $1,384 · $115/mo
- Expected delta
- +$137/yr (+$11/mo · 10.9%)
ⓘ Screening estimate from a state-policy table — verify with the county assessor before closing.
Climate risk First Street
- Flood 4/10 Moderate FEMA zone X (unshaded) · 24% chance over 30 yrs
- Wildfire 3/10 Moderate
- Heat 2/10 Low 8 d/yr ≥91°F today · 18 d/yr by 30 yrs out
- Wind 2/10 Low 100% chance of damaging wind over 30 yrs
- Air quality 2/10 Low 0 unhealthy d/yr today · 1 by 30 yrs out
Nearby sold comps map
Loading sold comps map…
Walkable amenities ~0.75 mi
Loading nearby amenities…
Taxation est. · year 1
- Rental income
- $10,074
- − Mortgage interest
- −$5,041
- − Property taxes
- −$1,248
- − Insurance
- −$450
- − Repairs & maintenance
- −$806
- − Management
- −$806
- − Depreciation
- −$2,618
- Taxable loss
- −$895
- Est. tax savings @ 24.0%
- +$215
- After-tax cash flow
- $812/yr
For passive investors: Depreciation is non-cash, so a rental often shows a tax loss while cash-flowing — sheltering income. Rental losses are passive: they offset passive income freely, and up to $25,000/yr can offset ordinary (W-2) income if you actively participate and your MAGI is under $100k (phasing out to $0 by $150k); unused losses carry forward. On sale, claimed depreciation is recaptured at up to 25%, and gains may owe capital-gains tax (a 1031 exchange can defer both). Figures are a year-1 estimate at your 24.0% rate — not tax advice; consult a CPA.
Schools (NCES district)
- District
- Sidney Central School District
- NCES district ID
- 3626850
- Math proficiency
- 44% ▼ -2.00%
- Reading proficiency
- 47% ▲ 5.00%
- Median HH income
- $42,110
- Composite
- 38.29/100
- National rank
- #4232
- State rank
- #462 of 590 in NY
Livability — Unadilla
- Score
- 60/100
- State rank
- #950
- US rank
- #18482
Category grades
Schools grade is shown separately in the Schools card above.
Census & demographics
- Population (ZIP)
- 1,362
Population outlook (Delaware County) Hauer SSP2
- Today (2025)
- 42,668 people
- By 2030
- 40,337 · -5.5%
- By 2040
- 35,514 · -16.8%
- By 2050
- 31,265 · -26.7%
- By 2075
- 24,455 · -42.7%
- By 2100
- 19,529 · -54.2%
Race, ethnicity, and origin ACS 2023
- Neighborhood character
- Predominantly White (90%)
- Race & ethnicity
- White 90% Two or more races 8% Hispanic / Latino 2%
- Common ancestry
- Slovak 7% Lithuanian 4% Iranian 3%
- Foreign-born
- 1% · South Korea
- Languages at home
- 98% English-only · Spanish 1%
Political lean MEDSL · Delaware
- 2024 margin
- R (+19.8) · D 40.1% · R 59.9%
- 2008→2024 swing
- -14.6pp toward R · 2008: -5.2pp · 2024: -19.8pp
- All cycles
- 2024: R+19.8 2020: R+18.4 2016: R+29.2 2012: R+9.6 2008: R+5.2
Not yet ingested
- Civics
- —
Market trends
- HPI YoY
- ▲ 10.89%
- Current HPI
- 361.6041
- Rent YoY
- —
- Metro
- —
- State GDP YoY
- ▲ 2.60%
- F500 in state
- 92
Industry mix (Fortune 500 HQ in NY)
| Industry | F500 HQs | Revenue |
|---|---|---|
| Financial Services | 10 | $950B |
|
||
| Consumer Goods | 9 | $162B |
|
||
| Insurance | 4 | $225B |
|
||
| Telecommunications | 2 | $144B |
|
||
| Pharmaceuticals | 2 | $112B |
|
||
| Media / Entertainment | 2 | $69B |
|
||
Price history
+426.3% since first listed3 events — show timeline
- 2026-05-28 Price Changed $90,000 UNYREIS
- 2026-05-15 Listed $110,000 UNYREIS
- 2000-04-14 Sold (Public Records) $17,100 Public Records
Property tax history
+12.9%/yrLatest (2025): $1,248 · +1.7% YoY. Source: county tax records.
Cash-flow waterfall
monthlySold comps — $/sqft
last 12 mo · ≤1 miLoading sold comps…