 Duplex
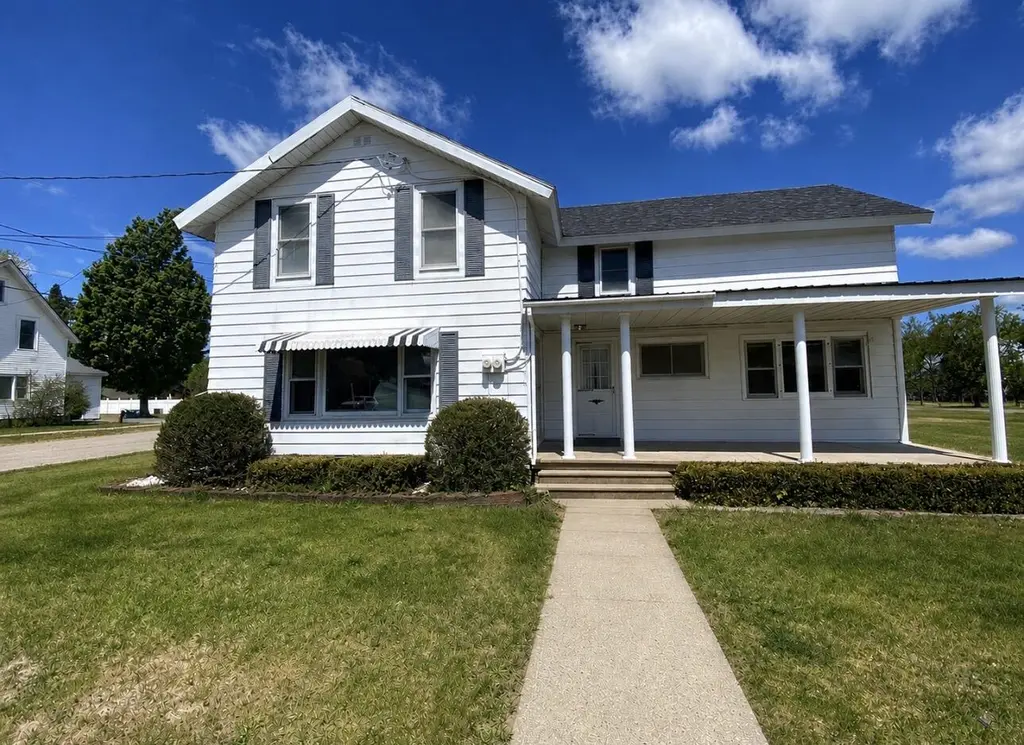
15 Grove Street St · Brushton, NY
Flood risk 1/10 · Minimal
- FEMA flood zone
- X
- Chance of flooding over 30 yrs
- 0.0%
- Est. flood insurance / yr
- $473 – $860
Fire risk 3/10 · Minor
- Est. fire insurance / yr
- $691 – $1,283
Heat risk 2/10 · Minimal
- Hot days now (above 91°F)
- 7 days/yr
- Hot days in 30 yrs
- 16 days/yr
Wind risk 1/10 · Minimal
- Chance of severe wind over 30 yrs
- —
Air-quality risk 1/10 · Minimal
- Unhealthy air days now
- 0 days/yr
- Unhealthy air days in 30 yrs
- 0 days/yr
Risk factors via First Street. Map © Google.
Why this score? — see what drove the A grade
The composite is a weighted blend of 9 inputs, each scored 0–100. Each bar is that input's sub-score; the figure is the points it added to the 100-point composite (weight × sub-score).
- Cash flow +30.0/30.0
- ARV discount +15.0/15.0
- 1% rule +10.0/10.0
- DSCR +10.0/10.0
- Appreciation +10.0/10.0
- Schools +3.5/10.0
- Livability +3.1/5.0
- Rent growth +2.5/5.0
- Condition / age +2.5/5.0
$130,000
🖨 Deal sheet 📄 Offer letter ✓ Due diligence
Multi-family units
County records classify this as Multi-Family (2-4 Unit). Listing-text estimate: 2 units. confirmed
Listing remarks
Turnkey Duplex in the Heart of Brushton, NY - The Perfect Opportunity to Own Your Home While Offsetting Your Mortgage If you've been dreaming of homeownership with extra income potential, this fully renovated duplex may be exactly what you've been waiting for. Whether you're looking for a great starter home, multi-generational living, or the chance to live comfortably while rental income helps cover your monthly expenses, this property offers flexibility, comfort, and opportunity all in one. Located in the heart of Brushton, NY, this thoughtfully updated duplex has been gradually and intentionally renovated throughout ownership and is ready for its new owners! The spacious 3-bedroom u
Key facts
- Covered front porch
- Fully renovated
- Turnkey duplex
Tags
Property features AI
Exterior
- Parking: Open parking available; Driveway parking; On-site parking; Paved and unpaved spaces; Private parking (varies by unit)
- Security: Carbon monoxide detector(s); Smoke detector(s)
- Utilities: Private well water; Private sewer; Electricity connected (100 amp service / fuses); Propane available
- Home design: Duplex / residential income property; Updated / remodeled; Two levels; One total story; Mixed-use possible; One common wall
- Construction: Metal siding and stone construction materials; Stone foundation; Metal, mixed, shingle, and tar/gravel roof types; Built as a duplex/mixed use structure
- Exterior features: Private entrance; Private yard; Front porch; Storm doors; Back yard; Cleared lot; Corner lot; Few trees; Rectangular lot; Has a view; Barn(s) on property; Garage(s) on property
Interior
- Kitchen: Gas cooktop; Microwave; Oven; Refrigerator
- Flooring: Carpet; Combination flooring; Hardwood; Laminate; Vinyl
- Bathrooms: One half bathroom; Two main-level bathrooms
- Heating & cooling: Forced air heating (oil); Window air conditioning units
- Interior features: High-speed internet available; Laminate countertops; Natural woodwork; Wood window frames; Unfinished basement
- Laundry & utility: Washer and dryer included; Laundry located inside on the main level; Electric dryer hookup
Neighborhood map
What this means for you Summary
Snapshot
- This is a 2 × 3-bed/1-bath units multifamily listed at $130k.
Deal economics
- At list price, monthly cash flow is $696 ($8k/yr) — positive. Per door: $348/mo.
- The deal already cash-flows at list — no discount required.
- Meets the 1% rule at list price ($2k rent vs $130k).
- Recommended offer: $126k (3.0% below list) — sets the bar for market timing.
Location & tenants
- Location reads 61/100 on livability (#928 in NY) — a middle-class / working-renter tenant base. Strengths: cost of living A+, housing A+; Watch: employment C-, health & safety C-, schools F.
- Brushton-Moira Central School District (rural): math 38% / reading 46% proficiency, ranked #503 of 590 in NY (top 85%) — families likely to look elsewhere, expect single-tenant / working-renter base with shorter leases.
- Market conditions: 8 active listings in the ZIP; 124 units permitted in Franklin County in 2024 (0 in 5+ unit buildings).
Forward outlook
- In year one you build about $14k of equity ($899 loan paydown + $13k appreciation (10.0% local appreciation)).
- Franklin County population projected at -14% by 2050 — secular population decline; favor cash flow + early exit over multi-decade hold.
- At projected returns (10.0% appreciation + 3.0% rent growth), your $36k cash investment doubles in ~2 years — after that, you're playing with house money.
- By year 3, paydown + projected appreciation supports a ~$35k cash-out refi (75% LTV) — recoverable capital for the next deal without selling this one.
Negotiation context
- It's been on market 37 days — a 3% lower offer ($126k) is reasonable based on typical stale-listing flexibility.
- Current owner paid $80k; list at $130k implies a 62% gain — meaningful room to come down on a strong offer.
Risks & watch-outs
- Watch-outs: built in 1890 — expect roof / HVAC / electrical / plumbing capex.
Questions for the listing agent
- It's been on market 37 days. Have you received any prior offers? Is the seller open to a 3% concession, seller financing, or rate buy-down credit?
- Can we see the unit-by-unit rent roll, current vacancy, and any below-market leases? What's the average tenancy length?
- What capital expenditures (roof, boiler, parking lot, exteriors) have been made in the last 5 years, and what's planned in the next 2?
- Built in 1890 — when were the roof, HVAC, electrical panel, plumbing, and water heater last replaced?
- Is there a deadline driving the sale (1031 exchange, divorce, estate, relocation)? That informs how much negotiation room exists.
- Schools are F-rated, which usually means shorter tenancies and higher turnover. Who's the typical renter profile here, and what's been the actual vacancy rate?
- Crime grade is F in this area — have there been break-ins, vandalism, or insurance claims at this property in the last 3 years? What carrier currently insures it and at what premium?
- What's the average days-on-market for RENTAL listings here right now (not sales)? A rising rental-DOM trend means longer vacancies and softer asking-rent achievability than the comps imply.
- What's the recent tenant-quality profile in this submarket — average credit score on applications, eviction rate, late-payment / NSF rate, and stable-employment percentage? A property-management company in the area should have these aggregated.
- How much new apartment / multifamily construction is in the pipeline within 1–3 miles? Heavy new supply (>2% of stock underway) typically softens rents 12–24 months out; light construction supports rent growth.
Investment metrics
- 1% rule
- 1.59% ✓
- Cap rate
- 12.72%
- Cash-on-cash
- 22.96%
- DSCR
- 2.02
- GRM
- 5.2
CMA / ARV
- ARV (median comp)
- $211,572
- List price
- $130,000
- Delta
- -38.56%
- Verdict
- UNDERPRICED
- Comps
- 2 within 1.0 mi
Projected returns pro-forma
10.0% appreciation · 3.0% rent growth · sell at horizon
- IRR
- 41.5%
- Equity multiple
- 4.17×
- Total profit
- $115,208
- Equity at exit
- $117,114
- IRR
- 35.8%
- Equity multiple
- 9.37×
- Total profit
- $304,499
- Equity at exit
- $252,561
Cash invested: $36,400 (down + closing). Projections, not guarantees.
Landlord ↔ Tenant lean methodology
- Overall (STATE)
- 15 Strongly Tenant-Friendly
- State New York
- 15 Strongly Tenant-Friendly · D+10
- County
- — inherits STATE
- City
- — inherits STATE
ZIP-level market 12916
- Home prices YoY
- 3.2%
- Active inventory
- 8
- Price-to-rent
- 10.5×
Monthly cashflow live
- Estimated rent
- $2,067 medium interval (Pro) →
- Mortgage (P&I)
- −$682
- Tax from tax record
- −$201 /mo · $2,408/yr
- Insurance
- −$54
- HOA
- −$0
- Vacancy / Maint / Mgmt
- −$434
- Net cashflow
- $696
Break-even live
2-unit breakdown (identical units grouped — click to expand)
| Units | Beds | Baths | Est. rent |
|---|---|---|---|
| 2× units | 3 | 1 | $2,068 |
| #1 | 3 | 1 | $1,034 |
| #2 | 3 | 1 | $1,034 |
| Total (2 units) | $2,067 | ||
UW: 25.0% down · 7.5% · 30yr · 1.5% tax · 5.0% vac · 8.0% maint · 8.0% mgmt
Financing live
Cash to close
- Down payment
- $32,500
- Closing costs
- $3,900
- Reserves months
- —
- Total cash needed
- —
Loan-product check · same deal, 3 products live
Conventional
25% down · 7.5% · 30yr
- Down + closing
- —
- Monthly P&I
- —
- Monthly cashflow
- —
- DSCR
- —
- Eligible?
- —
Personal DTI + credit; lowest rate.
DSCR
20% down · 8.5% · 30yr
- Down + closing
- —
- Monthly P&I
- —
- Monthly cashflow
- —
- DSCR
- —
- Eligible?
- —
No personal income docs; deal must DSCR.
Hard money
10% down · 12.0% · 12mo
- Down + closing
- —
- Monthly P&I
- —
- Monthly cashflow
- —
- DSCR
- —
- Eligible?
- —
Short-term bridge; refi at stabilization.
Listing history 16 events
-
2026-06-18days on market $130,000 Active 37 DOM
-
2026-06-17days on market $130,000 Active 36 DOM
-
2026-06-16days on market $130,000 Active 35 DOM
-
2026-06-15days on market $130,000 Active 34 DOM
-
2026-06-13days on market $130,000 Active 32 DOM
-
2026-06-12days on market $130,000 Active 31 DOM
-
2026-06-09days on market $130,000 Active 28 DOM
-
2026-06-08days on market $130,000 Active 27 DOM
-
2026-06-07days on market $130,000 Active 26 DOM
-
2026-06-05days on market $130,000 Active 24 DOM
-
2026-06-04days on market $130,000 Active 22 DOM
-
2026-06-02days on market $130,000 Active 21 DOM
-
2026-06-01days on market $130,000 Active 20 DOM
-
2026-05-31days on market $130,000 Active 19 DOM
-
2026-05-12$130,000 Active 2018-char remark
-
2023-05-02soldstatus $80,000
ⓘ Source: listings_history table (triggers on properties + properties_extension) + one-shot
backfill from property_details.listing_events for pre-trigger history.
Tax reassessment forecast NY · Partial reset (capped growth)
- Current annual tax
- $2,408 · $201/mo
- Projected year-2 tax
- $2,408 · $201/mo
- Expected delta
- $0/yr ($0/mo · 0.0%)
ⓘ Screening estimate from a state-policy table — verify with the county assessor before closing.
Climate risk First Street
- Flood 1/10 Low FEMA zone X · 0% chance over 30 yrs
- Wildfire 3/10 Moderate
- Heat 2/10 Low 7 d/yr ≥91°F today · 16 d/yr by 30 yrs out
- Wind 1/10 Low
- Air quality 1/10 Low 0 unhealthy d/yr today · 0 by 30 yrs out
Nearby sold comps map
Loading sold comps map…
Walkable amenities ~0.75 mi
Loading nearby amenities…
Taxation est. · year 1
- Rental income
- $24,804
- − Mortgage interest
- −$7,282
- − Property taxes
- −$2,408
- − Insurance
- −$650
- − Repairs & maintenance
- −$1,984
- − Management
- −$1,984
- − Depreciation
- −$3,782
- Taxable income
- $6,714
- Est. tax owed @ 24.0%
- −$1,611
- After-tax cash flow
- $6,745/yr
For passive investors: Depreciation is non-cash, so a rental often shows a tax loss while cash-flowing — sheltering income. Rental losses are passive: they offset passive income freely, and up to $25,000/yr can offset ordinary (W-2) income if you actively participate and your MAGI is under $100k (phasing out to $0 by $150k); unused losses carry forward. On sale, claimed depreciation is recaptured at up to 25%, and gains may owe capital-gains tax (a 1031 exchange can defer both). Figures are a year-1 estimate at your 24.0% rate — not tax advice; consult a CPA.
Schools (NCES district)
- District
- Brushton-Moira Central School District
- NCES district ID
- 3605820
- Math proficiency
- 38% ▲ 3.00%
- Reading proficiency
- 46% ▲ 15.00%
- Median HH income
- $40,096
- Composite
- 35.18/100
- National rank
- #5000
- State rank
- #503 of 590 in NY
Livability — Brushton
- Score
- 61/100
- State rank
- #928
- US rank
- #18086
Category grades
Schools grade is shown separately in the Schools card above.
Census & demographics
- Census place
- Brushton, NY
- Population (ZIP)
- 2,250
Population outlook (Franklin County) Hauer SSP2
- Today (2025)
- 48,098 people
- By 2030
- 46,790 · -2.7%
- By 2040
- 44,400 · -7.7%
- By 2050
- 41,256 · -14.2%
- By 2075
- 32,190 · -33.1%
- By 2100
- 23,407 · -51.3%
Race, ethnicity, and origin ACS 2023
- Neighborhood character
- Predominantly White (93%)
- Race & ethnicity
- White 93% Two or more races 5% Native American 2% Hispanic / Latino 1%
- Common ancestry
- Lithuanian 18% Slovak 8% Iranian 5%
- Foreign-born
- 0%
- Languages at home
- 98% English-only · Other Indo-European 1% Spanish 1%
Political lean MEDSL · Franklin
- 2024 margin
- Lean R (+9.0) · D 45.5% · R 54.5%
- 2008→2024 swing
- -31.2pp toward R · 2008: 22.2pp · 2024: -9.0pp
- All cycles
- 2024: R+9.0 2020: R+2.2 2016: R+7.4 2012: D+26.3 2008: D+22.2
Not yet ingested
- Civics
- —
Market trends
- HPI YoY
- ▲ 10.08%
- Current HPI
- 322.8975
- Rent YoY
- —
- Metro
- —
- State GDP YoY
- ▲ 2.60%
- F500 in state
- 92
Industry mix (Fortune 500 HQ in NY)
| Industry | F500 HQs | Revenue |
|---|---|---|
| Financial Services | 10 | $950B |
|
||
| Consumer Goods | 9 | $162B |
|
||
| Insurance | 4 | $225B |
|
||
| Telecommunications | 2 | $144B |
|
||
| Pharmaceuticals | 2 | $112B |
|
||
| Media / Entertainment | 2 | $69B |
|
||
Price history
+62.5% since first listed2 events — show timeline
- 2026-05-12 Listed $130,000 ACVMLS
- 2023-05-02 Sold (Public Records) $80,000 Public Records
Property tax history
+7.0%/yrLatest (2025): $2,408 · +0.1% YoY. Source: county tax records.
Cash-flow waterfall
monthlySold comps — $/sqft
last 12 mo · ≤1 miLoading sold comps…