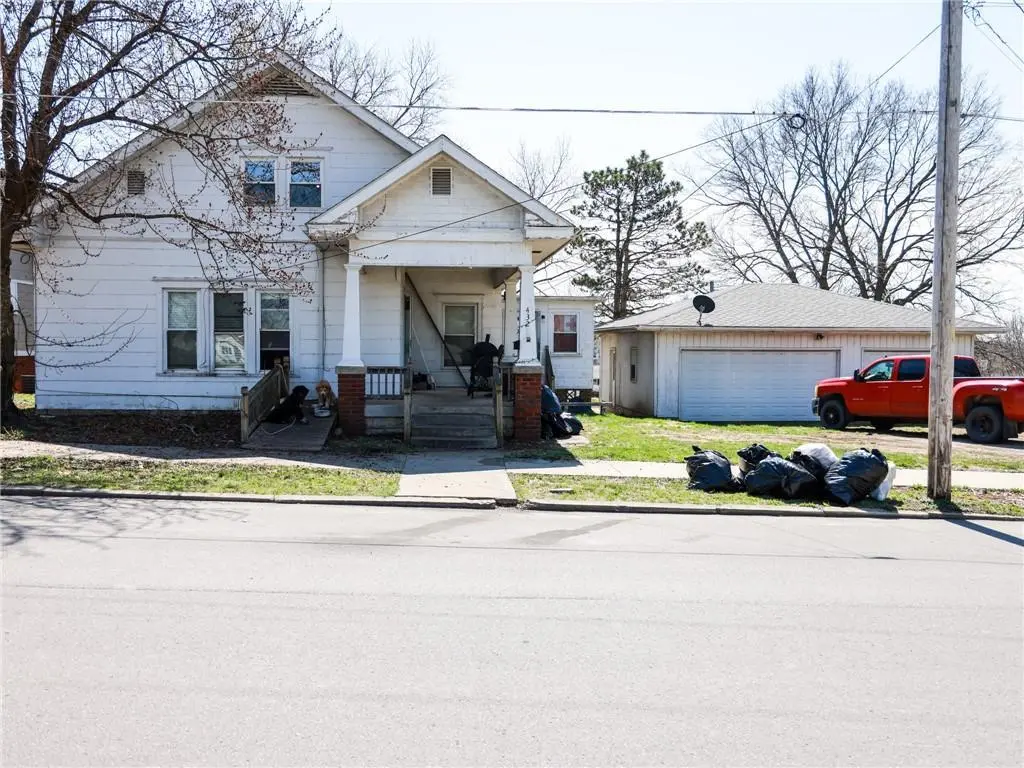
432 W Crowder Rd · Trenton, MO
Flood risk 1/10 · Minimal
- FEMA flood zone
- X (unshaded)
- Chance of flooding over 30 yrs
- 0.0%
- Est. flood insurance / yr
- $473 – $860
Fire risk 1/10 · Minimal
- Est. fire insurance / yr
- $1,054 – $1,958
Heat risk 4/10 · Minor
- Hot days now (above 106°F)
- 7 days/yr
- Hot days in 30 yrs
- 15 days/yr
Wind risk 2/10 · Minimal
- Chance of severe wind over 30 yrs
- —
Air-quality risk 2/10 · Minimal
- Unhealthy air days now
- 0 days/yr
- Unhealthy air days in 30 yrs
- 2 days/yr
Risk factors via First Street. Map © Google.
Why this score? — see what drove the D+ grade
The composite is a weighted blend of 9 inputs, each scored 0–100. Each bar is that input's sub-score; the figure is the points it added to the 100-point composite (weight × sub-score).
- Cash flow +24.0/30.0
- DSCR +7.7/10.0
- 1% rule +5.9/10.0
- Livability +3.8/5.0
- Schools +3.0/10.0
- Rent growth +2.5/5.0
- Condition / age +2.5/5.0
- ARV discount +0.0/15.0
- Appreciation +0.0/10.0
$109,000
🖨 Deal sheet (PDF) 📄 Offer letter ✓ Due diligence
Listing remarks MLS
Over 2,000 sq ft of living space and 4+ bedrooms! This 1 ½ story bungalow features the spacious kitchen, dining room, living room, two bedrooms, and a full bathroom on the main floor. Off of the kitchen is an enclosed porch or mudroom that could also be utilized as an office. Upstairs is home to two bedrooms, and a bathroom, as well as an additional smaller room. The property includes a nice 3 car detached garage with concrete floor and openers. Situated on just over a half acre, you can enjoy the outside space from the covered back deck or the covered front porch.
Key facts
- Back porch
- Sizable lot
- 0.57 acre lot
Tags
Neighborhood map
What this means for you Summary
Snapshot
- This is a 4-bed/2.0-bath single-family listed at $109k.
Deal economics
- At list price, monthly cash flow is $213 ($3k/yr) — positive.
- The deal already cash-flows at list — no discount required.
- Meets the 1% rule at list price ($1k rent vs $109k).
- Cap rate 8.6% vs local median 6.4% in Trenton — top-decile yield for the area; either an underpriced asset or a hidden risk that comps aren't pricing in. Stress-test before assuming the spread holds.
Location & tenants
- Location reads 76/100 on livability (#49 in MO, #3,686 nationally) — a middle-class / working-renter tenant base. Strengths: cost of living A+, housing A+, health & safety A+; Watch: schools C-, employment C-, amenities F.
- Trenton R-IX (town): math 28% / reading 43% proficiency, ranked #223 of 324 in MO (top 69%) — families likely to look elsewhere, expect single-tenant / working-renter base with shorter leases.
- Market conditions: 51 active listings in the ZIP; 2 units permitted in Grundy County in 2024 (0 in 5+ unit buildings).
Forward outlook
- Local home prices are declining (-3.0%/yr); year-one equity from $754 of loan paydown is wiped out by about $3k of value loss. Plan a longer hold.
- Grundy County population projected at -14% by 2050 — secular population decline; favor cash flow + early exit over multi-decade hold.
Negotiation context
- Only 14 days on market — expect competitive offers; lowballing is unlikely to land.
- 2 sale attempts since 4y ago with the ask held roughly flat each time — persistent listings suggest the price (not the market) is what's stuck; bring a comps-based counter.
- Current owner paid $86k; 27% above their basis — modest negotiation headroom, anchor on the comps not their cost.
Risks & watch-outs
- Watch-outs: built in 1935 — expect roof / HVAC / electrical / plumbing capex.
Questions for the listing agent
- Built in 1935 — when were the roof, HVAC, electrical panel, plumbing, and water heater last replaced?
- Is there a deadline driving the sale (1031 exchange, divorce, estate, relocation)? That informs how much negotiation room exists.
- The area grade is low — what's the realistic commute time and amenity access for the typical tenant pool here? Any planned neighborhood developments (good or bad) we should know about?
- What's the average days-on-market for RENTAL listings here right now (not sales)? A rising rental-DOM trend means longer vacancies and softer asking-rent achievability than the comps imply.
- What's the recent tenant-quality profile in this submarket — average credit score on applications, eviction rate, late-payment / NSF rate, and stable-employment percentage? A property-management company in the area should have these aggregated.
- How much new for-sale + rental construction is in the pipeline within 1–3 miles? Heavy new supply typically softens prices + rents 12–24 months out; constrained supply supports both.
Investment metrics
- 1% rule
- 1.09% ✓
- Cap rate
- 8.64%
- Cash-on-cash
- 8.38%
- DSCR
- 1.37
- GRM
- 7.6
CMA / ARV
- ARV (on-the-fly)
- $87,570
- Comps found
- 11
Show comp detail 11 sales within ~0.75 mi
| Address | Dist | Beds/Ba | Sqft | Sold | Price | $/sf | Match |
|---|---|---|---|---|---|---|---|
| 821 W 13th Ct | 0.25mi | 3/2.0 (-1) | 1,200 (-4%) | 6mo | $164,900 | $137 | 72 |
| 1425 Norton St | 0.21mi | 3/1.0 (-1) | 1,360 (+9%) | 7mo | $99,900 | $73 | 61 |
| 605 Monroe St | 0.45mi | 3/2.0 (-1) | 1,200 (-4%) | 9mo | $39,900 | $33 | 59 |
| 310 E 17th St | 0.41mi | 3/2.0 (-1) | 1,162 (-7%) | 9mo | $75,000 | $65 | 56 |
| 601 Pleasant View Ave | 0.54mi | 3/2.0 (-1) | 1,290 (+3%) | 13mo | $105,000 | $81 | 54 |
| 718 W 18th St | 0.30mi | 3/1.0 (-1) | 1,152 (-8%) | 13mo | $49,900 | $43 | 53 |
| 1017 W 13th St | 0.47mi | 3/1.0 (-1) | 1,168 (-7%) | 12mo | $109,900 | $94 | 48 |
| 431 Tindall Ave | 0.38mi | 3/1.5 (-1) | 1,428 (+14%) | 8mo | $29,900 | $21 | 45 |
| 1713 Princeton Rd | 0.57mi | 3/2.0 (-1) | 1,300 (+4%) | 23mo | $134,900 | $104 | 42 |
| 1917 Princeton Rd | 0.67mi | 3/1.5 (-1) | 1,388 (+11%) | 10mo | $59,000 | $43 | 35 |
| 605 E 6th St | 0.72mi | 3/1.5 (-1) | 1,148 (-8%) | 21mo | $79,900 | $70 | 28 |
Match score weights: distance 35% · size 25% · config 20% · recency 20%. Top-matched comps best support the ARV.
Projected returns pro-forma
-3.0% appreciation · 3.0% rent growth · sell at horizon
- IRR
- -3.6%
- Equity multiple
- 0.87×
- Total profit
- $-4,085
- Equity at exit
- $16,252
- IRR
- 6.1%
- Equity multiple
- 1.46×
- Total profit
- $13,929
- Equity at exit
- $9,424
Cash invested: $30,520 (down + closing). Projections, not guarantees.
Landlord ↔ Tenant lean methodology
- Overall (STATE)
- 81 Strongly Landlord-Friendly
- State Missouri
- 81 Strongly Landlord-Friendly · R+10
- County
- — inherits STATE
- City
- — inherits STATE
ZIP-level market 64683
- Home prices YoY
- -14.6%
- Active inventory
- 51
- Price-to-rent
- 7.6×
Monthly cashflow live
- Estimated rent
- $1,189 medium interval (Pro) →
- Mortgage (P&I)
- −$572
- Tax from tax record
- −$109 /mo · $1,308/yr
- Insurance
- −$45
- HOA
- −$0
- Vacancy / Maint / Mgmt
- −$250
- Net cashflow
- $213
Break-even live
Sensitivity live
| Price | -10% $275 | -5% $244 | +0% $213 | +5% $182 | +10% $151 |
|---|---|---|---|---|---|
| Rent | -10% $119 | -5% $166 | +0% $213 | +5% $260 | +10% $307 |
| Rate | -1.0pp $268 | -0.5pp $241 | base $213 | +0.5pp $185 | +1.0pp $156 |
UW: 25.0% down · 7.5% · 30yr · 1.5% tax · 5.0% vac · 8.0% maint · 8.0% mgmt
Financing live
Cash to close
- Down payment
- $27,250
- Closing costs
- $3,270
- Reserves months
- —
- Total cash needed
- —
Loan-product check · same deal, 3 products live
Conventional
25% down · 7.5% · 30yr
- Down + closing
- —
- Monthly P&I
- —
- Monthly cashflow
- —
- DSCR
- —
- Eligible?
- —
Personal DTI + credit; lowest rate.
DSCR
20% down · 8.5% · 30yr
- Down + closing
- —
- Monthly P&I
- —
- Monthly cashflow
- —
- DSCR
- —
- Eligible?
- —
No personal income docs; deal must DSCR.
Hard money
10% down · 12.0% · 12mo
- Down + closing
- —
- Monthly P&I
- —
- Monthly cashflow
- —
- DSCR
- —
- Eligible?
- —
Short-term bridge; refi at stabilization.
Listing history 6 events
-
2026-04-18status Pending
-
2026-04-04$109,000 Active
-
2022-08-04soldstatus Closed 578-char remark
Show marketing remark (578 chars)
Over 2,000 sq ft of living space and 4+ bedrooms! This 1 ½ story bungalow features the spacious kitchen, dining room, living room, two bedrooms, and a full bathroom on the main floor. Off of the kitchen is an enclosed porch or mudroom that could also be utilized as an office. Upstairs is home to two bedrooms, and a bathroom, as well as an additional smaller room. The property includes a nice 3 car detached garage with concrete floor and openers. Situated on just over a half acre, you can enjoy the outside space from the covered back deck or the covered front porch.
-
2022-07-06historical 578-char remark
Show marketing remark (578 chars)
Over 2,000 sq ft of living space and 4+ bedrooms! This 1 ½ story bungalow features the spacious kitchen, dining room, living room, two bedrooms, and a full bathroom on the main floor. Off of the kitchen is an enclosed porch or mudroom that could also be utilized as an office. Upstairs is home to two bedrooms, and a bathroom, as well as an additional smaller room. The property includes a nice 3 car detached garage with concrete floor and openers. Situated on just over a half acre, you can enjoy the outside space from the covered back deck or the covered front porch.
-
2022-05-12$92,000 578-char remark
Show marketing remark (578 chars)
Over 2,000 sq ft of living space and 4+ bedrooms! This 1 ½ story bungalow features the spacious kitchen, dining room, living room, two bedrooms, and a full bathroom on the main floor. Off of the kitchen is an enclosed porch or mudroom that could also be utilized as an office. Upstairs is home to two bedrooms, and a bathroom, as well as an additional smaller room. The property includes a nice 3 car detached garage with concrete floor and openers. Situated on just over a half acre, you can enjoy the outside space from the covered back deck or the covered front porch.
-
2016-02-29soldstatus $85,860
ⓘ Source: listings_history table (triggers on properties + properties_extension) + one-shot
backfill from property_details.listing_events for pre-trigger history.
Tax reassessment forecast MO · Resets to sale price
- Current annual tax
- $1,308 · $109/mo
- Projected year-2 tax
- $1,308 · $109/mo
- Expected delta
- $0/yr ($0/mo · 0.0%)
ⓘ Screening estimate from a state-policy table — verify with the county assessor before closing.
Climate risk First Street
- Flood 1/10 Low FEMA zone X (unshaded) · 0% chance over 30 yrs
- Wildfire 1/10 Low
- Heat 4/10 Moderate 7 d/yr ≥106°F today · 15 d/yr by 30 yrs out
- Wind 2/10 Low
- Air quality 2/10 Low 0 unhealthy d/yr today · 2 by 30 yrs out
Nearby sold comps map
Loading sold comps map…
Walkable amenities ~0.75 mi
Loading nearby amenities…
Taxation est. · year 1
- Rental income
- $14,265
- − Mortgage interest
- −$6,106
- − Property taxes
- −$1,308
- − Insurance
- −$545
- − Repairs & maintenance
- −$1,141
- − Management
- −$1,141
- − Depreciation
- −$3,171
- Taxable income
- $854
- Est. tax owed @ 24.0%
- −$205
- After-tax cash flow
- $2,353/yr
For passive investors: Depreciation is non-cash, so a rental often shows a tax loss while cash-flowing — sheltering income. Rental losses are passive: they offset passive income freely, and up to $25,000/yr can offset ordinary (W-2) income if you actively participate and your MAGI is under $100k (phasing out to $0 by $150k); unused losses carry forward. On sale, claimed depreciation is recaptured at up to 25%, and gains may owe capital-gains tax (a 1031 exchange can defer both). Figures are a year-1 estimate at your 24.0% rate — not tax advice; consult a CPA.
Schools (NCES district)
- District
- Trenton R-IX
- NCES district ID
- 2930360
- Math proficiency
- 28% ▼ -7.00%
- Reading proficiency
- 43% ▼ -4.00%
- Median HH income
- $37,586
- Composite
- 29.52/100
- National rank
- #6499
- State rank
- #223 of 324 in MO
Livability — Trenton
- Score
- 76/100
- State rank
- #49
- US rank
- #3686
Category grades
Schools grade is shown separately in the Schools card above.
Census & demographics
- Census place
- Trenton, MO
- City population
- 7,648
- Population (ZIP)
- 7,648
Population outlook (Grundy County) Hauer SSP2
- Today (2025)
- 9,586 people
- By 2030
- 9,298 · -3.0%
- By 2040
- 8,783 · -8.4%
- By 2050
- 8,262 · -13.8%
- By 2075
- 7,011 · -26.9%
- By 2100
- 5,650 · -41.1%
Race, ethnicity, and origin ACS 2023
- Neighborhood character
- Predominantly White (91%)
- Race & ethnicity
- White 91% Two or more races 5% Hispanic / Latino 3% Asian 1%
- Common ancestry
- Serbian 2% Portuguese 1% Slovak 1%
- Foreign-born
- 1% · China
- Languages at home
- 98% English-only · German/W. Germanic 1% Chinese 1% Spanish 1%
Political lean MEDSL · Grundy
- 2024 margin
- Solid R (+63.6) · D 17.8% · R 81.4%
- 2008→2024 swing
- -33.5pp toward R · 2008: -30.1pp · 2024: -63.6pp
- All cycles
- 2024: R+63.6 2020: R+62.8 2016: R+60.8 2012: R+41.6 2008: R+30.1
Not yet ingested
- Civics
- —
Market trends
- HPI YoY
- ▼ -32.24%
- Current HPI
- 188.2901
- Rent YoY
- —
- Metro
- —
- State GDP YoY
- ▲ 1.84%
- F500 in state
- 20
Industry mix (Fortune 500 HQ in MO)
| Industry | F500 HQs | Revenue |
|---|---|---|
| Healthcare | 1 | $163B |
|
||
| Insurance | 1 | $21B |
|
||
| Industrial Technology | 1 | $17B |
|
||
| Retail | 1 | $16B |
|
||
| Industrial Distribution | 1 | $10B |
|
||
| Utilities | 1 | $9B |
|
||
Price history
+27.0% since first listed6 events — show timeline
- 2026-04-18 Pending — Heartland MLS as Distributed by MLS Grid
- 2026-04-04 Listed $109,000 Heartland MLS as Distributed by MLS Grid
- 2022-08-04 Sold (MLS) — Heartland MLS as Distributed by MLS Grid
- 2022-07-06 Listing Removed — Heartland MLS as Distributed by MLS Grid
- 2022-05-12 Listed $92,000 Heartland MLS as Distributed by MLS Grid
- 2016-02-29 Sold (Public Records) $85,860 Public Records
Property tax history
+8.7%/yrLatest (2025): $1,308 · +15.0% YoY. Source: county tax records.
Cash-flow waterfall
monthlySold comps — $/sqft
last 12 mo · ≤1 miLoading sold comps…