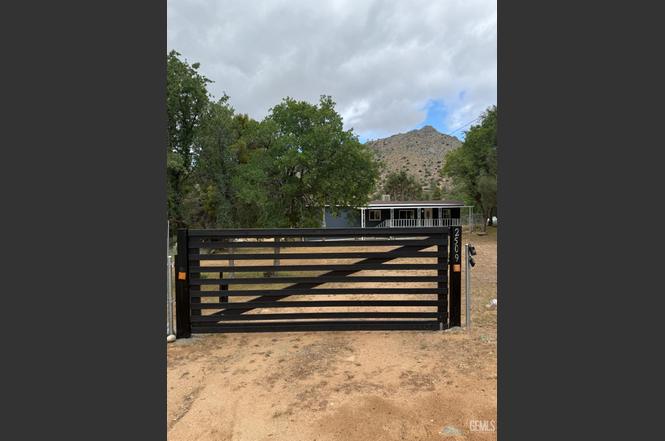
2509 Rembach · Bodfish, CA
Flood risk 1/10 · Minimal
- FEMA flood zone
- X (unshaded)
- Chance of flooding over 30 yrs
- 0.0%
- Est. flood insurance / yr
- $507 – $1,088
Fire risk 9/10 · Severe
- Est. fire insurance / yr
- $659 – $1,223
Heat risk 6/10 · Moderate
- Hot days now (above 91°F)
- 13 days/yr
- Hot days in 30 yrs
- 33 days/yr
Wind risk 1/10 · Minimal
- Chance of severe wind over 30 yrs
- —
Air-quality risk 10/10 · Severe
- Unhealthy air days now
- 24 days/yr
- Unhealthy air days in 30 yrs
- 30 days/yr
Risk factors via First Street. Map © Google.
Why this score? — see what drove the C grade
The composite is a weighted blend of 9 inputs, each scored 0–100. Each bar is that input's sub-score; the figure is the points it added to the 100-point composite (weight × sub-score).
- Cash flow +18.9/30.0
- Appreciation +9.7/10.0
- ARV discount +7.5/15.0
- DSCR +5.9/10.0
- 1% rule +3.9/10.0
- Schools +2.6/10.0
- Rent growth +2.5/5.0
- Condition / age +2.5/5.0
- Livability +2.4/5.0
$158,900
🖨 Deal sheet (PDF) 📄 Offer letter ✓ Due diligence
Listing remarks
Great home in small community with a beautiful view at the mountains of Bodfish. This home has 3 huge bedrooms, 2.5 baths, this property could be your vacation or retirement home!! It has freshly painted inside & out, Features deluxe new hardwood laminate floors, it has new custom kitchen cabinets with new gorgeous granite counter tops, 2 patios & 2 car garage, hookups for washer and dryer, Plenty of room for animals and mush more!!
Key facts
- 2 patios
- 0.59 acre lot
- 2 garage spots
Tags
Neighborhood map
What this means for you Summary
Snapshot
- This is a 2-bed/1.0-bath manufactured listed at $159k.
Deal economics
- At list price, monthly cash flow is $162 ($2k/yr) — positive.
- The deal already cash-flows at list — no discount required.
- To meet the 1% rule (rent ≥ 1% of price), the offer needs to be $142k (10.8% below list).
- Recommended offer: $140k (12.0% below list) — sets the bar for market timing.
- Cap rate 7.5% vs local median 5.9% in Bodfish — meaningfully above typical; check what's discounted (condition, days-on-market, listing class) to confirm the premium yield is real.
Location & tenants
- Location reads 48/100 on livability (#1,207 in CA) — a working-class tenant base; expect higher turnover. Strengths: cost of living B+; Watch: housing D+, schools F, amenities F.
- Kernville Union Elementary (rural): math 20% / reading 37% proficiency, ranked #1,128 of 1,400 in CA (top 81%) — low school quality limits family demand, transient renter base, plan for 1-2y turnover; 65% free/reduced lunch — lower-income household profile, screen leases tightly.
- Market conditions: 36 active listings in the ZIP; 2 comparable units currently listed for rent nearby; 3,244 units permitted in Kern County in 2024 (73 in 5+ unit buildings).
Forward outlook
- In year one you build about $16k of equity ($1k loan paydown + $15k appreciation (9.3% local appreciation)).
- Kern County population projected at +17% by 2050 — long-run rental-demand tailwind backs the buy-and-hold thesis.
- At projected returns (9.3% appreciation + 3.0% rent growth), your $44k cash investment doubles in ~3 years — after that, you're playing with house money.
- By year 3, paydown + projected appreciation supports a ~$40k cash-out refi (75% LTV) — recoverable capital for the next deal without selling this one.
Negotiation context
- It's been on market 341 days — a 12% lower offer ($140k) is reasonable based on typical stale-listing flexibility.
- 9 sale attempts since 4y ago; this cycle's ask has dropped $41k (21%) from the opening price — seller is motivated, your offer sets the floor, not the list.
- Current owner paid $43k; list at $159k implies a 270% gain — meaningful room to come down on a strong offer.
Risks & watch-outs
- Climate carrying-cost: severe wildfire risk; extreme-heat days projected 13→33/yr by 2055 (HVAC capex compounding) — expect insurance premiums to compound above CPI over the hold.
Questions for the listing agent
- It's been on market 341 days. Have you received any prior offers? Is the seller open to a 12% concession, seller financing, or rate buy-down credit?
- Why hasn't it sold? Are there any deal-killer items the seller is aware of (foundation, flood, title, zoning, code violations)?
- Is there a deadline driving the sale (1031 exchange, divorce, estate, relocation)? That informs how much negotiation room exists.
- Schools are F-rated, which usually means shorter tenancies and higher turnover. Who's the typical renter profile here, and what's been the actual vacancy rate?
- What's the average days-on-market for RENTAL listings here right now (not sales)? A rising rental-DOM trend means longer vacancies and softer asking-rent achievability than the comps imply.
- What's the recent tenant-quality profile in this submarket — average credit score on applications, eviction rate, late-payment / NSF rate, and stable-employment percentage? A property-management company in the area should have these aggregated.
- How much new for-sale + rental construction is in the pipeline within 1–3 miles? Heavy new supply typically softens prices + rents 12–24 months out; constrained supply supports both.
Investment metrics
- 1% rule
- 0.89% ✗
- Cap rate
- 7.51%
- Cash-on-cash
- 4.36%
- DSCR
- 1.19
- GRM
- 9.3
CMA / ARV
- ARV (on-the-fly)
- $81,536
- Comps found
- 1
Show comp detail 1 sale within ~0.75 mi
| Address | Dist | Beds/Ba | Sqft | Sold | Price | $/sf | Match |
|---|---|---|---|---|---|---|---|
| 342 Rocky | 0.57mi | 2/1.0 | 768 (-2%) | 3mo | $80,000 | $104 | 68 |
Match score weights: distance 35% · size 25% · config 20% · recency 20%. Top-matched comps best support the ARV.
Projected returns pro-forma
9.33% appreciation · 3.0% rent growth · sell at horizon
- IRR
- 26.1%
- Equity multiple
- 3.01×
- Total profit
- $89,484
- Equity at exit
- $135,403
- IRR
- 23.0%
- Equity multiple
- 6.70×
- Total profit
- $253,639
- Equity at exit
- $284,132
Cash invested: $44,492 (down + closing). Projections, not guarantees.
Landlord ↔ Tenant lean methodology
- Overall (STATE)
- 18 Strongly Tenant-Friendly
- State California
- 18 Strongly Tenant-Friendly · D+13
- County
- — inherits STATE
- City
- — inherits STATE
ZIP-level market 93205
- Home prices YoY
- 2.1%
- Active inventory
- 36
- Price-to-rent
- 9.3×
Monthly cashflow live
- Estimated rent
- $1,417 medium interval (Pro) →
- Mortgage (P&I)
- −$833
- Tax from tax record
- −$58 /mo · $698/yr
- Insurance
- −$66
- HOA
- −$0
- Vacancy / Maint / Mgmt
- −$298
- Net cashflow
- $162
Break-even live
Sensitivity live
| Price | -10% $252 | -5% $207 | +0% $162 | +5% $117 | +10% $72 |
|---|---|---|---|---|---|
| Rent | -10% $50 | -5% $106 | +0% $162 | +5% $218 | +10% $273 |
| Rate | -1.0pp $242 | -0.5pp $202 | base $162 | +0.5pp $120 | +1.0pp $78 |
UW: 25.0% down · 7.5% · 30yr · 1.5% tax · 5.0% vac · 8.0% maint · 8.0% mgmt
Financing live
Cash to close
- Down payment
- $39,725
- Closing costs
- $4,767
- Reserves months
- —
- Total cash needed
- —
Loan-product check · same deal, 3 products live
Conventional
25% down · 7.5% · 30yr
- Down + closing
- —
- Monthly P&I
- —
- Monthly cashflow
- —
- DSCR
- —
- Eligible?
- —
Personal DTI + credit; lowest rate.
DSCR
20% down · 8.5% · 30yr
- Down + closing
- —
- Monthly P&I
- —
- Monthly cashflow
- —
- DSCR
- —
- Eligible?
- —
No personal income docs; deal must DSCR.
Hard money
10% down · 12.0% · 12mo
- Down + closing
- —
- Monthly P&I
- —
- Monthly cashflow
- —
- DSCR
- —
- Eligible?
- —
Short-term bridge; refi at stabilization.
Rent comps 2 comps
| Address | Beds | Baths | Sqft | Rent | $/sqft | DOM | Units | Dist |
|---|---|---|---|---|---|---|---|---|
| 2324 Bodfish Canyon Rd Bodfish, CA | 2.0 | 2.0 | 1040 | $1,250 | $1.20 | 3d | 1 | 0.04mi |
| 216 Kearns Dr Bodfish, CA | 2.0 | 2.0 | 1120 | $1,900 | $1.70 | 3d | 1 | 0.27mi |
Listing history 22 events
-
2026-04-16status Pending
-
2026-04-13historical Active - Contingent
-
2025-12-22status Active
-
2025-12-15status Pending
-
2025-12-04price $158,900
-
2025-10-31price $160,000
-
2025-09-23price $170,000
-
2025-08-14price $175,000
-
2025-07-27historical
-
2025-05-01$199,900 Active
-
2024-10-30$195,000 Active
-
2024-09-12status Active
-
2024-08-25historical Active Under Contract
-
2024-08-23status Active
-
2024-07-30status Active
-
2024-07-20status Pending
-
2024-05-23status Active
-
2024-04-06price $195,000
-
2023-11-22$199,000 Active
-
2022-12-02soldstatus $43,000 Closed
-
2022-06-07$39,000
-
1990-04-19soldstatus $17,000
ⓘ Source: listings_history table (triggers on properties + properties_extension) + one-shot
backfill from property_details.listing_events for pre-trigger history.
Tax reassessment forecast CA · Resets to sale price
- Current annual tax
- $698 · $58/mo
- Projected year-2 tax
- $1,208 · $101/mo
- Expected delta
- +$510/yr (+$43/mo · 73.1%)
ⓘ Screening estimate from a state-policy table — verify with the county assessor before closing.
Climate risk First Street
- Flood 1/10 Low FEMA zone X (unshaded) · 0% chance over 30 yrs
- Wildfire 9/10 Extreme
- Heat 6/10 Major 13 d/yr ≥91°F today · 33 d/yr by 30 yrs out
- Wind 1/10 Low
- Air quality 10/10 Extreme 24 unhealthy d/yr today · 30 by 30 yrs out
Nearby sold comps map
Loading sold comps map…
Walkable amenities ~0.75 mi
Loading nearby amenities…
Taxation est. · year 1
- Rental income
- $17,000
- − Mortgage interest
- −$8,901
- − Property taxes
- −$698
- − Insurance
- −$794
- − Repairs & maintenance
- −$1,360
- − Management
- −$1,360
- − Depreciation
- −$4,623
- Taxable loss
- −$735
- Est. tax savings @ 24.0%
- +$176
- After-tax cash flow
- $2,115/yr
For passive investors: Depreciation is non-cash, so a rental often shows a tax loss while cash-flowing — sheltering income. Rental losses are passive: they offset passive income freely, and up to $25,000/yr can offset ordinary (W-2) income if you actively participate and your MAGI is under $100k (phasing out to $0 by $150k); unused losses carry forward. On sale, claimed depreciation is recaptured at up to 25%, and gains may owe capital-gains tax (a 1031 exchange can defer both). Figures are a year-1 estimate at your 24.0% rate — not tax advice; consult a CPA.
Schools (NCES district)
- District
- Kernville Union Elementary
- NCES district ID
- 0619590
- Math proficiency
- 20% ▲ 4.00%
- Reading proficiency
- 37% ▲ 11.00%
- Median HH income
- $29,896
- Composite
- 25.91/100
- National rank
- #12766
- State rank
- #1128 of 1400 in CA
Livability — Bodfish
- Score
- 48/100
- State rank
- #1207
- US rank
- #26114
Category grades
Schools grade is shown separately in the Schools card above.
Census & demographics
- Census place
- Bodfish, CA
- Population (ZIP)
- 2,191
Population outlook (Kern County) Hauer SSP2
- Today (2025)
- 947,286 people
- By 2030
- 978,984 · +3.3%
- By 2040
- 1,045,018 · +10.3%
- By 2050
- 1,105,232 · +16.7%
- By 2075
- 1,229,538 · +29.8%
- By 2100
- 1,238,059 · +30.7%
Race, ethnicity, and origin ACS 2023
- Neighborhood character
- Predominantly White (85%)
- Race & ethnicity
- White 85% Hispanic / Latino 8% Two or more races 6% Native American 2%
- Hispanic origin (detail)
- Mexican 7% Puerto Rican 1%
- Common ancestry
- Lithuanian 4% Portuguese 2% Iranian 1%
- Foreign-born
- 1% · Canada
- Languages at home
- 96% English-only · Spanish 3% French/Haitian/Cajun 1%
Political lean MEDSL · Kern
- 2024 margin
- Strong R (+21.1) · D 38.2% · R 59.3% · Other 2.5%
- 2008→2024 swing
- -3.3pp toward R · 2008: -17.8pp · 2024: -21.1pp
- All cycles
- 2024: R+21.1 2020: R+10.2 2016: R+15.0 2012: R+20.9 2008: R+17.8
Not yet ingested
- Civics
- —
Market trends
- HPI YoY
- ▲ 9.33%
- Current HPI
- 447.8088
- Rent YoY
- —
- Metro
- —
- State GDP YoY
- ▲ 3.21%
- F500 in state
- 116
Industry mix (Fortune 500 HQ in CA)
| Industry | F500 HQs | Revenue |
|---|---|---|
| Technology | 27 | $1,492B |
|
||
| Financial Services | 3 | $174B |
|
||
| Retail | 3 | $44B |
|
||
| Insurance | 3 | $26B |
|
||
| Media / Entertainment | 2 | $115B |
|
||
| Pharmaceuticals / Biotech | 2 | $62B |
|
||
Price history
+834.7% since first listed22 events — show timeline
- 2026-04-16 Pending — GEMLS
- 2026-04-13 Contingent — GEMLS
- 2025-12-22 Relisted — GEMLS
- 2025-12-15 Pending — GEMLS
- 2025-12-04 Price Changed $158,900 GEMLS
- 2025-10-31 Price Changed $160,000 GEMLS
- 2025-09-23 Price Changed $170,000 GEMLS
- 2025-08-14 Price Changed $175,000 GEMLS
- 2025-07-27 Listing Removed — CRMLS
- 2025-05-01 Listed $199,900 GEMLS
- 2024-10-30 Listed $195,000 CRMLS
- 2024-09-12 Relisted — SSMLS
- 2024-08-25 Contingent — SSMLS
- 2024-08-23 Relisted — SSMLS
- 2024-07-30 Relisted — SSMLS
- 2024-07-20 Pending — SSMLS
- 2024-05-23 Relisted — SSMLS
- 2024-04-06 Price Changed $195,000 SSMLS
- 2023-11-22 Listed $199,000 SSMLS
- 2022-12-02 Sold (MLS) $43,000 SSMLS
- 2022-06-07 Listed $39,000 SSMLS
- 1990-04-19 Sold (Public Records) $17,000 Public Records
Property tax history
+1.0%/yrLatest (2025): $698 · +2.8% YoY. Source: county tax records.
Cash-flow waterfall
monthlySold comps — $/sqft
last 12 mo · ≤1 miLoading sold comps…