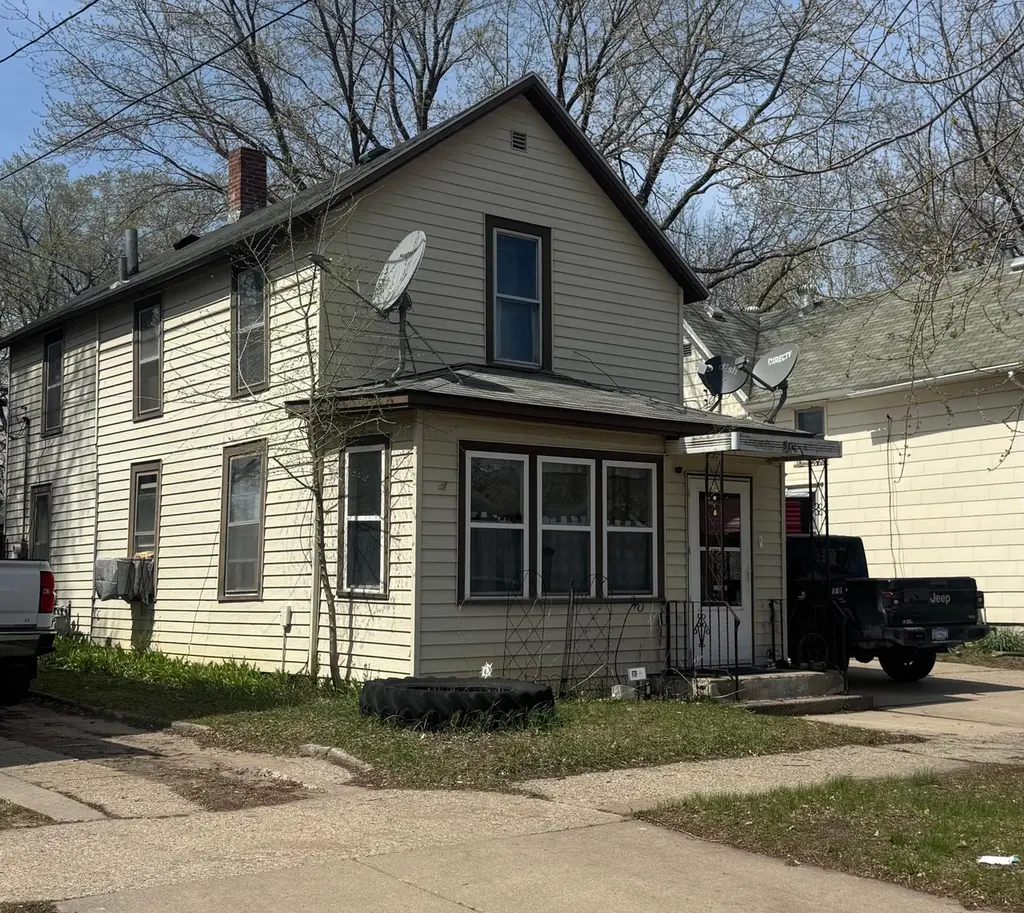
518 7th Ave NW · Faribault, MN
Flood risk 1/10 · Minimal
- FEMA flood zone
- X (unshaded)
- Chance of flooding over 30 yrs
- 0.0%
- Est. flood insurance / yr
- $473 – $860
Fire risk 1/10 · Minimal
- Est. fire insurance / yr
- $888 – $1,650
Heat risk 2/10 · Minimal
- Hot days now (above 99°F)
- 7 days/yr
- Hot days in 30 yrs
- 15 days/yr
Wind risk 2/10 · Minimal
- Chance of severe wind over 30 yrs
- —
Air-quality risk 1/10 · Minimal
- Unhealthy air days now
- 0 days/yr
- Unhealthy air days in 30 yrs
- 0 days/yr
Risk factors via First Street. Map © Google.
Why this score? — see what drove the C- grade
The composite is a weighted blend of 9 inputs, each scored 0–100. Each bar is that input's sub-score; the figure is the points it added to the 100-point composite (weight × sub-score).
- Cash flow +21.0/30.0
- ARV discount +7.5/15.0
- DSCR +6.7/10.0
- 1% rule +5.1/10.0
- Livability +3.8/5.0
- Rent growth +2.5/5.0
- Condition / age +2.5/5.0
- Schools +2.3/10.0
- Appreciation +0.0/10.0
$149,000
🖨 Deal sheet 📄 Offer letter ✓ Due diligence
Listing remarks
Full of charm and potential, this fixer-upper is a great opportunity for investors and savvy buyers! Featuring a detached garage. Convenient main-level laundry, two bedrooms upstairs, and a bath. Enjoy a welcoming front porch and a rear porch perfect for relaxing. Located in a desirable Faribault neighborhood, this home is ready for your vision.
Key facts
- Main-level laundry
- Rear porch
- Detached garage
Tags
Neighborhood map
What this means for you Summary
Snapshot
- This is a 2-bed/1.0-bath single-family listed at $149k.
Deal economics
- At list price, monthly cash flow is $211 ($3k/yr) — positive.
- The deal already cash-flows at list — no discount required.
- Meets the 1% rule at list price ($2k rent vs $149k).
- Cap rate 8.0% vs local median 4.1% in Faribault — top-decile yield for the area; either an underpriced asset or a hidden risk that comps aren't pricing in. Stress-test before assuming the spread holds.
Location & tenants
- Location reads 76/100 on livability (#158 in MN, #3,440 nationally) — a middle-class / working-renter tenant base. Strengths: cost of living A+, housing A+, health & safety A+; Watch: schools C-, employment C-, commute F.
- Faribault Public School District (town): math 17% / reading 34% proficiency, ranked #275 of 301 in MN (top 91%) — low school quality limits family demand, transient renter base, plan for 1-2y turnover.
- Market conditions: 165 active listings in the ZIP; 17 comparable units currently listed for rent nearby; rentals lingering (median 44d on market — plan ~5-8 weeks vacancy on turnover, expect pricing pressure); 82% of comp listings sitting > 30 days — soft ceiling on asking rent; 93 units permitted in Rice County in 2024 (0 in 5+ unit buildings).
Forward outlook
- Local home prices are declining (-3.0%/yr); year-one equity from $1k of loan paydown is wiped out by about $4k of value loss. Plan a longer hold.
Negotiation context
- Only 8 days on market — expect competitive offers; lowballing is unlikely to land.
Risks & watch-outs
- Watch-outs: built in 1889 — expect roof / HVAC / electrical / plumbing capex.
Questions for the listing agent
- Built in 1889 — when were the roof, HVAC, electrical panel, plumbing, and water heater last replaced?
- Is there a deadline driving the sale (1031 exchange, divorce, estate, relocation)? That informs how much negotiation room exists.
- What's the average days-on-market for RENTAL listings here right now (not sales)? A rising rental-DOM trend means longer vacancies and softer asking-rent achievability than the comps imply.
- What's the recent tenant-quality profile in this submarket — average credit score on applications, eviction rate, late-payment / NSF rate, and stable-employment percentage? A property-management company in the area should have these aggregated.
- How much new for-sale + rental construction is in the pipeline within 1–3 miles? Heavy new supply typically softens prices + rents 12–24 months out; constrained supply supports both.
Investment metrics
- 1% rule
- 1.01% ✓
- Cap rate
- 7.99%
- Cash-on-cash
- 6.07%
- DSCR
- 1.27
- GRM
- 8.3
CMA / ARV
No comps found within radius.
Projected returns pro-forma
-3.0% appreciation · 3.0% rent growth · sell at horizon
- IRR
- -6.9%
- Equity multiple
- 0.74×
- Total profit
- $-10,707
- Equity at exit
- $22,216
- IRR
- 2.7%
- Equity multiple
- 1.19×
- Total profit
- $7,949
- Equity at exit
- $12,883
Cash invested: $41,720 (down + closing). Projections, not guarantees.
Landlord ↔ Tenant lean methodology
- Overall (STATE)
- 46 Balanced
- State Minnesota
- 46 Balanced · D+2
- County
- — inherits STATE
- City
- — inherits STATE
ZIP-level market 55021
- Home prices YoY
- -26.9%
- Active inventory
- 165
- Price-to-rent
- 8.3×
Monthly cashflow live
- Estimated rent
- $1,502 high interval (Pro) →
- Mortgage (P&I)
- −$781
- Tax from tax record
- −$132 /mo · $1,580/yr
- Insurance
- −$62
- HOA
- −$0
- Vacancy / Maint / Mgmt
- −$315
- Net cashflow
- $211
Break-even live
UW: 25.0% down · 7.5% · 30yr · 1.5% tax · 5.0% vac · 8.0% maint · 8.0% mgmt
Financing live
Cash to close
- Down payment
- $37,250
- Closing costs
- $4,470
- Reserves months
- —
- Total cash needed
- —
Loan-product check · same deal, 3 products live
Conventional
25% down · 7.5% · 30yr
- Down + closing
- —
- Monthly P&I
- —
- Monthly cashflow
- —
- DSCR
- —
- Eligible?
- —
Personal DTI + credit; lowest rate.
DSCR
20% down · 8.5% · 30yr
- Down + closing
- —
- Monthly P&I
- —
- Monthly cashflow
- —
- DSCR
- —
- Eligible?
- —
No personal income docs; deal must DSCR.
Hard money
10% down · 12.0% · 12mo
- Down + closing
- —
- Monthly P&I
- —
- Monthly cashflow
- —
- DSCR
- —
- Eligible?
- —
Short-term bridge; refi at stabilization.
Rent comps 17 comps
| Address | Beds | Baths | Sqft | Rent | $/sqft | DOM | Units | Dist |
|---|---|---|---|---|---|---|---|---|
| 429 8th Ave NW Unit FA-304 Faribault, MN | 2.0 | 2.0 | 1070 | $1,625 | $1.52 | 43d | 1 | 0.06mi |
| 429 8th Ave NW Unit FA-415 Faribault, MN | 2.0 | 1.0 | 844 | $1,400 | $1.66 | 43d | 1 | 0.06mi |
| 429 8th Ave NW Unit FA-107 Faribault, MN | 2.0 | 1.0 | 857 | $1,395 | $1.63 | 43d | 1 | 0.06mi |
| 429 8th Ave NW Unit FA-404 Faribault, MN | 2.0 | 2.0 | 1070 | $1,675 | $1.57 | 43d | 1 | 0.06mi |
| 429 8th Ave NW Unit FA-209 Faribault, MN | 2.0 | 1.0 | 777 | $1,375 | $1.77 | 43d | 1 | 0.06mi |
| 429 8th Ave NW Unit FA-104 Faribault, MN | 2.0 | 2.0 | 1070 | $1,500 | $1.40 | 43d | 1 | 0.06mi |
| 429 8th Ave NW Unit FA-403 Faribault, MN | 2.0 | 1.0 | 896 | $1,575 | $1.76 | 43d | 1 | 0.06mi |
| 429 8th Ave NW Unit FA-215 Faribault, MN | 2.0 | 1.0 | 844 | $1,325 | $1.57 | 43d | 1 | 0.06mi |
| 429 8th Ave NW Faribault, MN | 1.0–2.0 | 1.0 | 787 | $1,550 | $1.97 | 5d | 7 | 0.06mi |
| 429 8th Ave NW Unit FA-103 Faribault, MN | 2.0 | 1.0 | 896 | $1,450 | $1.62 | 43d | 1 | 0.06mi |
| 417 1st Ave NW Unit 1 Faribault, MN | 2.0 | 1.5 | 1500 | $1,450 | $0.97 | 43d | 1 | 0.52mi |
| 417 1st Ave NW Unit 2 Faribault, MN | 3.0 | 1.0 | 1500 | $1,575 | $1.05 | 43d | 1 | 0.52mi |
| 31 3rd St NE Unit R31-301 Faribault, MN | 2.0 | 1.0 | 1400 | $1,900 | $1.36 | 43d | 1 | 0.67mi |
| 1125 Central Ave N Apt 3 Faribault, MN | 2.0 | 1.0 | 1200 | $1,350 | $1.12 | 43d | 1 | 0.79mi |
| 728 Willow St Faribault, MN | 3.0 | 1.0 | 1200 | $1,995 | $1.66 | 43d | 1 | 0.97mi |
| 2275 4th St NW Faribault, MN | 2.0–3.0 | 2.0 | 1113 | $1,165 | $1.05 | 5d | 8 | 1.25mi |
| 1250 Autumn Dr Faribault, MN | 1.0–3.0 | 1.0 | 814 | $1,162 | $1.43 | 24d | 5 | 1.43mi |
Listing history 3 events
-
2026-04-28status Pending
-
2026-04-24historical Contingent - Inspection
-
2026-04-20$149,000 Active
ⓘ Source: listings_history table (triggers on properties + properties_extension) + one-shot
backfill from property_details.listing_events for pre-trigger history.
Tax reassessment forecast MN · Partial reset (capped growth)
- Current annual tax
- $1,580 · $132/mo
- Projected year-2 tax
- $1,624 · $135/mo
- Expected delta
- +$44/yr (+$4/mo · 2.8%)
ⓘ Screening estimate from a state-policy table — verify with the county assessor before closing.
Climate risk First Street
- Flood 1/10 Low FEMA zone X (unshaded) · 0% chance over 30 yrs
- Wildfire 1/10 Low
- Heat 2/10 Low 7 d/yr ≥99°F today · 15 d/yr by 30 yrs out
- Wind 2/10 Low
- Air quality 1/10 Low 0 unhealthy d/yr today · 0 by 30 yrs out
Nearby sold comps map
Loading sold comps map…
Walkable amenities ~0.75 mi
Loading nearby amenities…
Taxation est. · year 1
- Rental income
- $18,019
- − Mortgage interest
- −$8,346
- − Property taxes
- −$1,580
- − Insurance
- −$745
- − Repairs & maintenance
- −$1,442
- − Management
- −$1,442
- − Depreciation
- −$4,335
- Taxable income
- $130
- Est. tax owed @ 24.0%
- −$31
- After-tax cash flow
- $2,503/yr
For passive investors: Depreciation is non-cash, so a rental often shows a tax loss while cash-flowing — sheltering income. Rental losses are passive: they offset passive income freely, and up to $25,000/yr can offset ordinary (W-2) income if you actively participate and your MAGI is under $100k (phasing out to $0 by $150k); unused losses carry forward. On sale, claimed depreciation is recaptured at up to 25%, and gains may owe capital-gains tax (a 1031 exchange can defer both). Figures are a year-1 estimate at your 24.0% rate — not tax advice; consult a CPA.
Schools (NCES district)
- District
- Faribault Public School District
- NCES district ID
- 2711760
- Math proficiency
- 17% ▼ -18.00%
- Reading proficiency
- 34% ▼ -8.00%
- Median HH income
- $54,584
- Composite
- 22.85/100
- National rank
- #8011
- State rank
- #275 of 301 in MN
Livability — Faribault
- Score
- 76/100
- State rank
- #158
- US rank
- #3440
Category grades
Schools grade is shown separately in the Schools card above.
Census & demographics
- Census place
- Faribault, MN
- County
- Rice County · 56,558 people
- City population
- 30,908
- Metro
- Faribault-Northfield, MN
- Population (ZIP)
- 30,908
- Household income
- $68,820
- Rent vs Own
- Severe rent burden
- 755.0
Population outlook (Rice County) Hauer SSP2
- Today (2025)
- 66,716 people
- By 2030
- 67,352 · +1.0%
- By 2040
- 67,595 · +1.3%
- By 2050
- 67,074 · +0.5%
- By 2075
- 66,641 · -0.1%
- By 2100
- 66,205 · -0.8%
Race, ethnicity, and origin ACS 2023
- Neighborhood character
- Predominantly White (71%)
- Race & ethnicity
- White 71% Black 13% Hispanic / Latino 12% Two or more races 6% Asian 1%
- Hispanic origin (detail)
- Mexican 9%
- Common ancestry
- Portuguese 9% Lithuanian 3% Romanian 2%
- Foreign-born
- 11% · Canada
- Languages at home
- 82% English-only · Spanish 9% Other Asian/Pacific 1%
Political lean MEDSL · Rice
- 2024 margin
- Toss-up / Even · D 47.8% · R 50.3% · Other 1.8%
- 2008→2024 swing
- -14.0pp toward R · 2008: 11.5pp · 2024: -2.5pp
- All cycles
- 2024: R+2.5 2020: R+0.2 2016: R+3.1 2012: D+8.3 2008: D+11.5
Not yet ingested
- Civics
- —
Market trends
- HPI YoY
- ▼ -93.12%
- Current HPI
- 253.3996
- Rent YoY
- —
- Metro
- Faribault-Northfield, MN
- State GDP YoY
- ▲ 2.41%
- F500 in state
- 34
Industry mix (Fortune 500 HQ in MN)
| Industry | F500 HQs | Revenue |
|---|---|---|
| Healthcare | 2 | $407B |
|
||
| Retail | 2 | $150B |
|
||
| Consumer Goods | 2 | $32B |
|
||
| Industrial Machinery | 2 | $6B |
|
||
| Agriculture | 1 | $40B |
|
||
| Healthcare / Medical Devices | 1 | $32B |
|
||
Price history
3 events — show timeline
- 2026-04-28 Pending — NORTHSTARMLS as Distributed by MLS Grid
- 2026-04-24 Contingent — NORTHSTARMLS as Distributed by MLS Grid
- 2026-04-20 Listed $149,000 NORTHSTARMLS as Distributed by MLS Grid
Property tax history
+8.1%/yrLatest (2025): $1,580 · +15.7% YoY. Source: county tax records.
Cash-flow waterfall
monthlySold comps — $/sqft
last 12 mo · ≤1 miLoading sold comps…