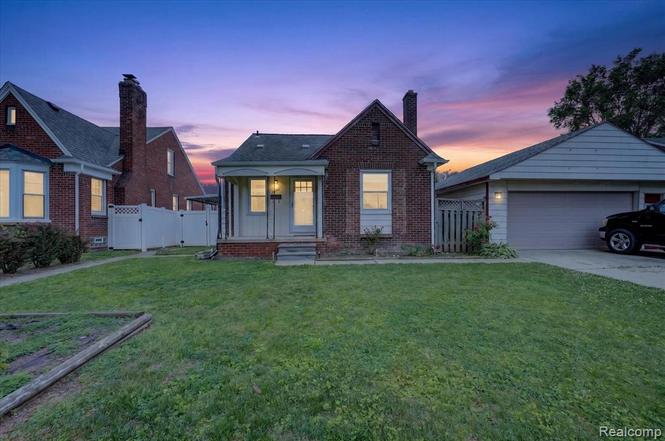
13121 Backus St · Southgate, MI
Flood risk 1/10 · Minimal
- FEMA flood zone
- X (unshaded)
- Chance of flooding over 30 yrs
- 0.0%
- Est. flood insurance / yr
- $473 – $860
Fire risk 1/10 · Minimal
- Est. fire insurance / yr
- $784 – $1,456
Heat risk 3/10 · Minor
- Hot days now (above 96°F)
- 7 days/yr
- Hot days in 30 yrs
- 15 days/yr
Wind risk 2/10 · Minimal
- Chance of severe wind over 30 yrs
- —
Air-quality risk 3/10 · Minor
- Unhealthy air days now
- 3 days/yr
- Unhealthy air days in 30 yrs
- 5 days/yr
Risk factors via First Street. Map © Google.
Why this score? — see what drove the D+ grade
The composite is a weighted blend of 9 inputs, each scored 0–100. Each bar is that input's sub-score; the figure is the points it added to the 100-point composite (weight × sub-score).
- Cash flow +14.5/30.0
- ARV discount +12.8/15.0
- 1% rule +4.6/10.0
- DSCR +4.4/10.0
- Livability +4.2/5.0
- Rent growth +3.5/5.0
- Schools +2.5/10.0
- Condition / age +2.5/5.0
- Appreciation +0.0/10.0
$170,000
🖨 Deal sheet 📄 Offer letter ✓ Due diligence
Listing remarks MLS
Step into a world of comfort and ease at 13121 Backus ST, Southgate, MI. Built in 1940, this single-family residence is a truly inviting home, ready for you to move in and begin your next chapter. The ranch-style architecture offers a seamless flow, creating an atmosphere of simple elegance. With three comfortable bedrooms, there is ample space for rest and rejuvenation. The well-appointed bathroom provides a refreshing retreat. Beyond the interior, discover the joys of outdoor living. A private yard offers a tranquil escape, perfect for quiet mornings or lively gatherings. The attached garage provides convenience and secure parking, while the charming patio and welcoming porch extend your living space outdoors. This home offers a compelling opportunity to embrace a lifestyle of comfort and convenience.
Key facts
- Private yard
- Charming patio
- Welcoming porch
Tags
Property features AI
Exterior
- Parking: Detached 2-car garage
- Utilities: Public water; Public sewer
- Home design: Single-family residence; One and one-half stories; Ground-level entry with steps; Brick and vinyl siding construction; Faces not specified
- Construction: Asphalt roof; Block foundation; Built with brick and vinyl siding
- Exterior features: Deck; In-ground pool; Paved road access
Interior
- Kitchen: Gas water heater; Dryer; Washer
- Bathrooms: 1 full bathroom
- Heating & cooling: Forced air heating (natural gas); Central air conditioning; Ceiling fans
- Interior features: Furnished; Fireplace in the basement; Partially finished basement; 5 total rooms
- Laundry & utility: Washer and dryer included
Neighborhood map
What this means for you Summary
Snapshot
- This is a 3-bed/1.0-bath single-family listed at $170k.
Deal economics
- At list price, monthly cash flow is $36 ($430/yr) — positive.
- The deal already cash-flows at list — no discount required.
- To meet the 1% rule (rent ≥ 1% of price), the offer needs to be $163k (4.0% below list).
- Recommended offer: $163k (4.0% below list) — sets the bar for 1% rule.
- Cap rate 6.5% vs local median 5.2% in Southgate — meaningfully above typical; check what's discounted (condition, days-on-market, listing class) to confirm the premium yield is real.
Location & tenants
- Location reads 85/100 on livability (#29 in MI, #582 nationally) — a professional / high-income tenant draw. Strengths: amenities A+, commute A+, cost of living A+; Watch: schools D, crime D-.
- Southgate Community School District (suburban): math 21% / reading 36% proficiency, ranked #379 of 540 in MI (top 70%) — low school quality limits family demand, transient renter base, plan for 1-2y turnover.
- Market conditions: Rents rising fast (+4.0%/yr); 115 active listings in the ZIP; 23 comparable units currently listed for rent nearby; rentals leasing fast (median 5d on market — plan ~1-2 weeks tenant-placement turnaround); 2,639 units permitted in Wayne County in 2024 (1,216 in 5+ unit buildings).
Forward outlook
- Local home prices are declining (-3.0%/yr); year-one equity from $1k of loan paydown is wiped out by about $5k of value loss. Plan a longer hold.
- Wayne County population projected at -17% by 2050 — secular population decline; favor cash flow + early exit over multi-decade hold.
Negotiation context
- Only 1 days on market — expect competitive offers; lowballing is unlikely to land.
- 7 sale attempts since 12y ago with the ask held roughly flat each time — persistent listings suggest the price (not the market) is what's stuck; bring a comps-based counter.
- Current owner paid $70k; list at $170k implies a 143% gain — meaningful room to come down on a strong offer.
Risks & watch-outs
- Watch-outs: built in 1940 — expect roof / HVAC / electrical / plumbing capex.
Questions for the listing agent
- Built in 1940 — when were the roof, HVAC, electrical panel, plumbing, and water heater last replaced?
- Is there a deadline driving the sale (1031 exchange, divorce, estate, relocation)? That informs how much negotiation room exists.
- Schools are D-rated, which usually means shorter tenancies and higher turnover. Who's the typical renter profile here, and what's been the actual vacancy rate?
- Crime grade is D in this area — have there been break-ins, vandalism, or insurance claims at this property in the last 3 years? What carrier currently insures it and at what premium?
- The area grade is low — what's the realistic commute time and amenity access for the typical tenant pool here? Any planned neighborhood developments (good or bad) we should know about?
- What's the average days-on-market for RENTAL listings here right now (not sales)? A rising rental-DOM trend means longer vacancies and softer asking-rent achievability than the comps imply.
- What's the recent tenant-quality profile in this submarket — average credit score on applications, eviction rate, late-payment / NSF rate, and stable-employment percentage? A property-management company in the area should have these aggregated.
- How much new for-sale + rental construction is in the pipeline within 1–3 miles? Heavy new supply typically softens prices + rents 12–24 months out; constrained supply supports both.
Investment metrics
- 1% rule
- 0.96% ✗
- Cap rate
- 6.55%
- Cash-on-cash
- 0.90%
- DSCR
- 1.04
- GRM
- 8.7
CMA / ARV
- ARV (on-the-fly)
- $192,864
- Comps found
- 12
Show comp detail 12 sales within ~0.75 mi
| Address | Dist | Beds/Ba | Sqft | Sold | Price | $/sf | Match |
|---|---|---|---|---|---|---|---|
| 13152 Superior St | 0.05mi | 3/1.0 | 1,140 (-3%) | 0mo | $200,000 | $175 | 92 |
| 13273 Cunningham St | 0.27mi | 3/2.0 | 1,190 (+1%) | 1mo | $195,000 | $164 | 81 |
| 13360 Jobin St | 0.21mi | 3/1.0 | 1,090 (-7%) | 1mo | $170,500 | $156 | 77 |
| 13668 Agnes St | 0.64mi | 3/1.5 | 1,180 (+0%) | 0mo | $180,000 | $153 | 67 |
| 12984 Callender St | 0.52mi | 3/1.0 | 1,108 (-6%) | 1mo | $203,500 | $184 | 65 |
| 14567 Longtin St | 0.66mi | 3/1.0 | 1,188 (+1%) | 3mo | $159,000 | $134 | 65 |
| 1877 21st St | 0.60mi | 2/1.0 (-1) | 1,157 (-2%) | 4mo | $178,000 | $154 | 61 |
| 2110 21st St | 0.46mi | 3/1.5 | 1,272 (+8%) | 2mo | $255,000 | $200 | 61 |
| 13520 Mercier St | 0.46mi | 3/1.0 | 1,286 (+9%) | 4mo | $180,000 | $140 | 60 |
| 13315 Birrell St | 0.69mi | 3/1.0 | 1,130 (-4%) | 3mo | $135,000 | $119 | 59 |
| 12813 Birrell St | 0.67mi | 3/1.0 | 1,050 (-11%) | 2mo | $212,000 | $202 | 50 |
| 1518 Chestnut St | 0.64mi | 2/1.0 (-1) | 1,008 (-14%) | 1mo | $169,000 | $168 | 41 |
Match score weights: distance 35% · size 25% · config 20% · recency 20%. Top-matched comps best support the ARV.
Projected returns pro-forma
-3.0% appreciation · 4.04% rent growth · sell at horizon
- IRR
- -13.6%
- Equity multiple
- 0.51×
- Total profit
- $-23,468
- Equity at exit
- $25,348
- IRR
- -3.0%
- Equity multiple
- 0.79×
- Total profit
- $-9,971
- Equity at exit
- $14,698
Cash invested: $47,600 (down + closing). Projections, not guarantees.
Landlord ↔ Tenant lean methodology
- Overall (STATE)
- 62 Landlord-Friendly
- State Michigan
- 62 Landlord-Friendly · EVEN
- County
- — inherits STATE
- City
- — inherits STATE
ZIP-level market 48195
- Rents YoY
- 4.0%
- Active inventory
- 115
- Price-to-rent
- 8.7×
Monthly cashflow live
- Estimated rent
- $1,632 high interval (Pro) →
- Mortgage (P&I)
- −$891
- Tax from tax record
- −$291 /mo · $3,490/yr
- Insurance
- −$71
- HOA
- −$0
- Vacancy / Maint / Mgmt
- −$343
- Net cashflow
- $36
Break-even live
UW: 25.0% down · 7.5% · 30yr · 1.5% tax · 5.0% vac · 8.0% maint · 8.0% mgmt
Financing live
Cash to close
- Down payment
- $42,500
- Closing costs
- $5,100
- Reserves months
- —
- Total cash needed
- —
Loan-product check · same deal, 3 products live
Conventional
25% down · 7.5% · 30yr
- Down + closing
- —
- Monthly P&I
- —
- Monthly cashflow
- —
- DSCR
- —
- Eligible?
- —
Personal DTI + credit; lowest rate.
DSCR
20% down · 8.5% · 30yr
- Down + closing
- —
- Monthly P&I
- —
- Monthly cashflow
- —
- DSCR
- —
- Eligible?
- —
No personal income docs; deal must DSCR.
Hard money
10% down · 12.0% · 12mo
- Down + closing
- —
- Monthly P&I
- —
- Monthly cashflow
- —
- DSCR
- —
- Eligible?
- —
Short-term bridge; refi at stabilization.
Rent comps 23 comps
| Address | Beds | Baths | Sqft | Rent | $/sqft | DOM | Units | Dist |
|---|---|---|---|---|---|---|---|---|
| 13020 Pullman St Southgate, MI | 4.0 | 1.0 | 1050 | $1,550 | $1.48 | 2d | 1 | 0.38mi |
| 13185 Sycamore St Southgate, MI | 3.0 | 1.0 | 1080 | $1,700 | $1.57 | 24d | 1 | 0.49mi |
| 1569 Sycamore St Wyandotte, MI | 3.0 | 1.0 | 944 | $1,695 | $1.80 | 43d | 1 | 0.73mi |
| 1650 19th St Wyandotte, MI | 3.0 | 2.0 | 1100 | $1,899 | $1.73 | 18d | 1 | 0.77mi |
| 1130 21st St Wyandotte, MI | 3.0 | 1.0 | 864 | $1,420 | $1.64 | 1d | 1 | 0.93mi |
| 1163 17th St Wyandotte, MI | 3.0 | 1.0 | 1010 | $1,695 | $1.68 | 43d | 1 | 1.01mi |
| 3851 17th St Wyandotte, MI | 2.0 | 1.0 | 764 | $1,200 | $1.57 | 2d | 1 | 1.08mi |
| 1024 Adelaide St Wyandotte, MI | 2.0 | 1.0 | 800 | $3,100 | $3.88 | 1d | 1 | 1.13mi |
| 4163 Burns Ave Lincoln Park, MI | 3.0 | 1.0 | 900 | $1,500 | $1.67 | 1d | 1 | 1.15mi |
| 13861 Strathcona St Southgate, MI | 1.0–2.0 | 1.0–1.5 | 797 | $1,140 | $1.43 | 1d | 5 | 1.19mi |
| 2700 6th St Wyandotte, MI | 1.0–2.0 | 1.0 | 900 | $1,095 | $1.22 | 43d | 2 | 1.23mi |
| 854 Harrison Blvd Lincoln Park, MI | 3.0 | 1.0 | 1410 | $1,750 | $1.24 | 43d | 1 | 1.26mi |
| 750 Harrison Blvd Unit 5 Lincoln Park, MI | 2.0 | 1.0 | 800 | $995 | $1.24 | 5d | 1 | 1.32mi |
| 720 Harrison Blvd Unit 20 Lincoln Park, MI | 2.0 | 1.0 | 800 | $1,025 | $1.28 | 2d | 1 | 1.32mi |
| 1750 Saint Johns Blvd Unit 17 Lincoln Park, MI | 2.0 | 1.0 | 750 | $1,025 | $1.37 | 24d | 1 | 1.33mi |
| 610 Harrison Blvd Apt 43 Lincoln Park, MI | 2.0 | 1.0 | 800 | $1,050 | $1.31 | 24d | 1 | 1.33mi |
| 610 Harrison Blvd Unit 46 Lincoln Park, MI | 2.0 | 1.0 | 800 | $995 | $1.24 | 2d | 1 | 1.33mi |
| 1760 Saint Johns Blvd Apt 14 Lincoln Park, MI | 2.0 | 1.0 | 750 | $995 | $1.33 | 24d | 1 | 1.34mi |
| 13165 Turnberry Ct Southgate, MI | 2.0 | 2.0 | 1275 | $1,795 | $1.41 | 5d | 1 | 1.34mi |
| 13165 Turnberry Ct Southgate, MI | 2.0 | 2.0 | 1275 | $1,795 | $1.41 | 43d | 1 | 1.34mi |
| 13750 Village Green Blvd Southgate, MI | 1.0–2.0 | 1.0 | 862 | $1,625 | $1.88 | 1d | 9 | 1.37mi |
| 667 Pine St Unit 1 Wyandotte, MI | 3.0 | 1.0 | 1000 | $1,500 | $1.50 | 1d | 1 | 1.39mi |
| 667 Pine St Unit 2 Wyandotte, MI | 2.0 | 1.0 | 800 | $1,400 | $1.75 | 1d | 1 | 1.39mi |
Listing history 2 events
-
2026-06-19remarks 699-char remark
-
2026-06-19$170,000 Active 1 DOM
ⓘ Source: listings_history table (triggers on properties + properties_extension) + one-shot
backfill from property_details.listing_events for pre-trigger history.
Tax reassessment forecast MI · Partial reset (capped growth)
- Current annual tax
- $3,490 · $291/mo
- Projected year-2 tax
- $3,490 · $291/mo
- Expected delta
- $0/yr ($0/mo · 0.0%)
ⓘ Screening estimate from a state-policy table — verify with the county assessor before closing.
Climate risk First Street
- Flood 1/10 Low FEMA zone X (unshaded) · 0% chance over 30 yrs
- Wildfire 1/10 Low
- Heat 3/10 Moderate 7 d/yr ≥96°F today · 15 d/yr by 30 yrs out
- Wind 2/10 Low
- Air quality 3/10 Moderate 3 unhealthy d/yr today · 5 by 30 yrs out
Nearby sold comps map
Loading sold comps map…
Walkable amenities ~0.75 mi
Loading nearby amenities…
Taxation est. · year 1
- Rental income
- $19,579
- − Mortgage interest
- −$9,523
- − Property taxes
- −$3,490
- − Insurance
- −$850
- − Repairs & maintenance
- −$1,566
- − Management
- −$1,566
- − Depreciation
- −$4,945
- Taxable loss
- −$2,361
- Est. tax savings @ 24.0%
- +$567
- After-tax cash flow
- $997/yr
For passive investors: Depreciation is non-cash, so a rental often shows a tax loss while cash-flowing — sheltering income. Rental losses are passive: they offset passive income freely, and up to $25,000/yr can offset ordinary (W-2) income if you actively participate and your MAGI is under $100k (phasing out to $0 by $150k); unused losses carry forward. On sale, claimed depreciation is recaptured at up to 25%, and gains may owe capital-gains tax (a 1031 exchange can defer both). Figures are a year-1 estimate at your 24.0% rate — not tax advice; consult a CPA.
Schools (NCES district)
- District
- Southgate Community School District
- NCES district ID
- 2632340
- Math proficiency
- 21% ▼ -8.00%
- Reading proficiency
- 36% ▬ 0.00%
- Median HH income
- $49,234
- Composite
- 24.83/100
- National rank
- #7591
- State rank
- #379 of 540 in MI
Livability — Southgate
- Score
- 85/100
- State rank
- #29
- US rank
- #582
Category grades
Schools grade is shown separately in the Schools card above.
Census & demographics
- Census place
- Southgate, MI
- County
- Wayne County · 1,562,939 people
- City population
- 29,366
- Metro
- Detroit-Warren-Dearborn, MI
- Population (ZIP)
- 29,366
- Household income
- $66,118
- Rent vs Own
- Severe rent burden
- 727.0
Population outlook (Wayne County) Hauer SSP2
- Today (2025)
- 1,675,273 people
- By 2030
- 1,620,300 · -3.3%
- By 2040
- 1,502,341 · -10.3%
- By 2050
- 1,384,039 · -17.4%
- By 2075
- 1,124,592 · -32.9%
- By 2100
- 881,193 · -47.4%
Race, ethnicity, and origin ACS 2023
- Neighborhood character
- Predominantly White (75%)
- Race & ethnicity
- White 75% Hispanic / Latino 11% Black 8% Two or more races 8% Asian 3%
- Hispanic origin (detail)
- Mexican 8% Puerto Rican 1%
- Common ancestry
- Romanian 9% Lithuanian 3% Slovak 3%
- Foreign-born
- 6% · Canada, China
- Languages at home
- 90% English-only · Other Indo-European 4% Spanish 3% Other Asian/Pacific 1%
Political lean MEDSL · Wayne
- 2024 margin
- Strong D (+29.0) · D 62.7% · R 33.7% · Other 3.6%
- 2008→2024 swing
- -20.5pp toward R · 2008: 49.5pp · 2024: 29.0pp
- All cycles
- 2024: D+29.0 2020: D+38.1 2016: D+37.3 2012: D+46.9 2008: D+49.5
Not yet ingested
- Civics
- —
Market trends
- HPI YoY
- ▼ -187.28%
- Current HPI
- 207.9776
- Rent YoY
- ▲ 4.04%
- Metro
- Detroit-Warren-Dearborn, MI
- State GDP YoY
- ▲ 1.37%
- F500 in state
- 28
Industry mix (Fortune 500 HQ in MI)
| Industry | F500 HQs | Revenue |
|---|---|---|
| Automotive Parts | 3 | $48B |
|
||
| Automotive | 2 | $372B |
|
||
| Chemicals | 1 | $45B |
|
||
| Automotive Retail | 1 | $29B |
|
||
| Healthcare / Medical Devices | 1 | $23B |
|
||
| Automotive Technology | 1 | $20B |
|
||
Price history
+115.2% since first listed21 events — show timeline
- 2026-06-18 Listed $170,000 REALCOMP
- 2026-06-18 Listed $170,000 MiRealSource-MiMLS
- 2016-09-19 Listing Removed — REALCOMP
- 2016-09-19 Listing Removed — MiRealSource-MiMLS
- 2016-04-25 Listed $111,000 MiRealSource-MiMLS
- 2016-04-25 Listed $111,000 REALCOMP
- 2016-04-25 Listing Removed — MiRealSource-MiMLS
- 2016-04-25 Listing Removed — REALCOMP
- 2016-04-07 Price Changed $111,000 MiRealSource-MiMLS
- 2016-04-07 Relisted — MiRealSource-MiMLS
- 2016-04-06 Price Changed $111,000 REALCOMP
- 2016-03-02 Listing Removed — MiRealSource-MiMLS
- 2016-03-01 Listed $113,500 MiRealSource-MiMLS
- 2015-06-22 Price Changed $113,500 REALCOMP
- 2015-03-25 Price Changed $119,555 REALCOMP
- 2015-01-02 Price Changed $125,000 REALCOMP
- 2014-12-05 Price Changed $129,900 REALCOMP
- 2014-11-19 Price Changed $137,500 REALCOMP
- 2014-10-24 Listed $139,900 REALCOMP
- 1995-03-23 Sold (Public Records) $70,000 Public Records
- 1991-08-27 Sold (Public Records) $79,000 Public Records
Property tax history
+3.4%/yrLatest (2025): $3,490 · +3.9% YoY. Source: county tax records.
Cash-flow waterfall
monthlySold comps — $/sqft
last 12 mo · ≤1 miLoading sold comps…