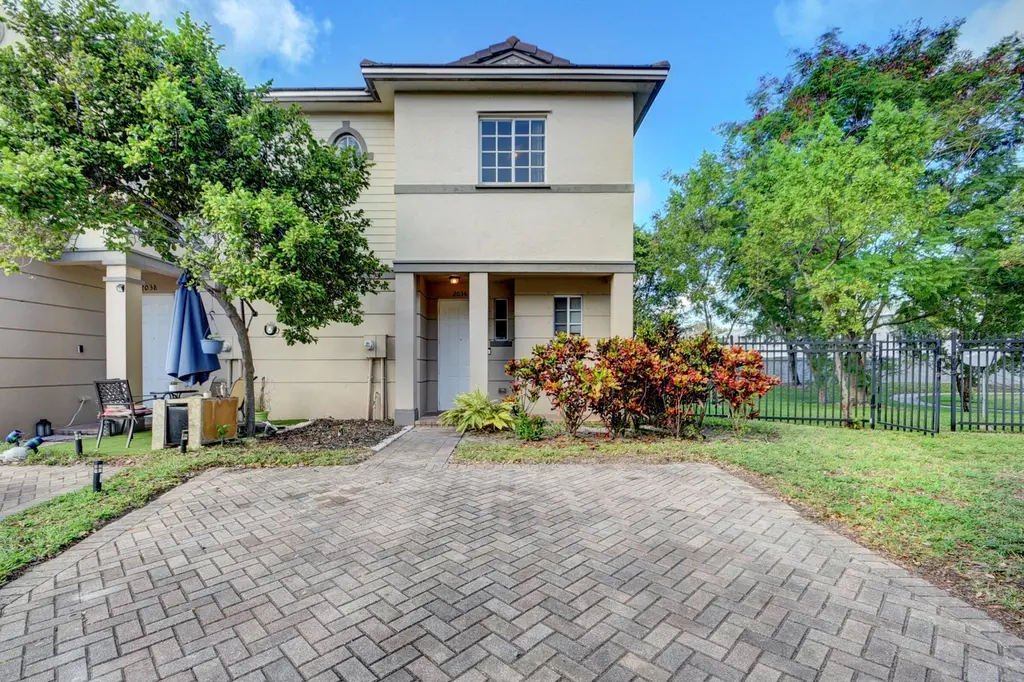
2036 Marsh Harbor Dr · Riviera Beach, FL
Flood risk 1/10 · Minimal
- FEMA flood zone
- X (unshaded)
- Chance of flooding over 30 yrs
- 0.0%
- Est. flood insurance / yr
- $507 – $1,088
Fire risk 1/10 · Minimal
- Est. fire insurance / yr
- $947 – $1,759
Heat risk 9/10 · Severe
- Hot days now (above 106°F)
- 6 days/yr
- Hot days in 30 yrs
- 18 days/yr
Wind risk 10/10 · Severe
- Chance of severe wind over 30 yrs
- 99.0%
Air-quality risk 2/10 · Minimal
- Unhealthy air days now
- 0 days/yr
- Unhealthy air days in 30 yrs
- 1 days/yr
Risk factors via First Street. Map © Google.
Why this score? — see what drove the D grade
The composite is a weighted blend of 9 inputs, each scored 0–100. Each bar is that input's sub-score; the figure is the points it added to the 100-point composite (weight × sub-score).
- Cash flow +13.1/30.0
- ARV discount +7.5/15.0
- 1% rule +6.3/10.0
- Schools +4.3/10.0
- DSCR +3.9/10.0
- Livability +3.4/5.0
- Condition / age +2.5/5.0
- Rent growth +2.3/5.0
- Appreciation +0.0/10.0
$253,000
🖨 Deal sheet 📄 Offer letter ✓ Due diligence
Listing remarks MLS
Beautifully Appointed 2BR/ 2.5BA Townhome. Tile and Laminate Floors. Kitchen Black Appliances with real wood cabinets.
Key facts
- Gated community
- Brand-new a/c
- Fitness center
Tags
Property features AI
Finance
- Financial info: Pets allowed with possible restrictions (number and size limits may apply)
- HOA & community: Association with monthly fee of $345; HOA covers common areas, reserve funds, roof repairs and pool service; Community amenities include heated pool, spa/hot tub, tennis courts, basketball court, clubhouse, fitness center, jogging path, park, playground, parking, street lights and gated security
Exterior
- Parking: Three assigned/open parking spaces; Driveway and guest parking available; Open parking
- Security: Fire alarm and smoke detectors; Security system with gated entry, security gate and security guard; Security fence
- Utilities: Public water; Public sewer; Electricity connected with 220 volts (kitchen and laundry); Cable available; Natural gas not available
- Home design: Townhouse; Two levels; Entry-level living area; Faces south
- Construction: Stucco exterior; Shingle roof; Attic/crawl hatchway(s) insulated; One story listed for building (unit configured as two levels)
- Exterior features: Open patio and open porch; Patio and porch; Fenced backyard with gate; Corner lot; Landscaped; Public maintained road frontage; Waterfront: Yes (no specific waterfront features listed)
Interior
- Kitchen: Electric range; Dishwasher; Disposal; Microwave; Refrigerator; Electric water heater (owned)
- Bedrooms: No main-level bedrooms (all bedrooms upstairs)
- Flooring: Carpet; Ceramic tile; Tile; Vinyl; Wood
- Bathrooms: Two full bathrooms and one half bathroom; One bathroom on the main level
- Heating & cooling: Central electric heating (individual units); Central individual cooling with electric and ceiling fans; ENERGY STAR qualified cooling equipment; Exhaust fan
- Interior features: High ceilings; Walk-in closets; Split bedroom layout; Satellite dish; Unfurnished
- Laundry & utility: In-unit laundry located in an upper-level laundry closet; ENERGY STAR qualified dryer; 220-volt in laundry
Neighborhood map
What this means for you Summary
Snapshot
- This is a 2-bed/2.5-bath townhouse listed at $253k.
Deal economics
- At list price, monthly cash flow is $-10 ($-124/yr) — negative.
- To cash-flow at today's rent, offer at most $251k (0.7% below list).
- Meets the 1% rule at list price ($3k rent vs $253k).
- Recommended offer: $251k (0.7% below list) — sets the bar for cash-flow.
Location & tenants
- Location reads 67/100 on livability (#581 in FL) — a middle-class / working-renter tenant base. Strengths: housing A+, health & safety A+, cost of living A-; Watch: employment D, crime F, amenities F.
- Palm Beach (suburban): math 46% / reading 53% proficiency, ranked #34 of 73 in FL (top 47%) — families likely to look elsewhere, expect single-tenant / working-renter base with shorter leases.
- Zoned schools: Dr. Mary Mcleod Bethune Elementary (math 28% / reading 25%, grade F, #2,009 of 2,144 statewide, top 94%, 540 students, 87% FRL); John F. Kennedy Middle School (math 28% / reading 29%, grade F, #482 of 571 statewide, top 85%, 826 students, 78% FRL); William T. Dwyer High School (math 36% / reading 58%, grade D-, #207 of 667 statewide, top 32%, 2,206 students, 37% FRL) — zoned schools average 68% FRL vs 52% district-wide (16 pts higher); higher-poverty schools than district average — tighter screening recommended.
- Zoned-school proficiency averages 34% at this address vs 50% district-wide (-16 pts) — the specific schools serving this property underperform the Palm Beach average; the district grade overstates school quality for this exact location.
- Market conditions: Rents soft (-0.7%/yr); 506 active listings in the ZIP; 3 comparable units currently listed for rent nearby; rentals at typical pace (median 24d on market — plan ~3-4 weeks tenant-placement turnaround); 3,974 units permitted in Palm Beach County in 2024 (1,012 in 5+ unit buildings).
- At $2,865/mo this rent would consume 53% of the median local household income ($65k/yr) (locally 1838% of renters already pay >50% of income on rent) — very limited rent-growth headroom before tenants either downsize or default.
Forward outlook
- Local home prices are declining (-3.0%/yr); year-one equity from $2k of loan paydown is wiped out by about $8k of value loss. Plan a longer hold.
- Palm Beach County population projected at +30% by 2050 — long-run rental-demand tailwind backs the buy-and-hold thesis.
Negotiation context
- Only 10 days on market — expect competitive offers; lowballing is unlikely to land.
- 5 sale attempts since 14y ago; this cycle's ask is 11948% above the opening price — seller raised mid-cycle; expect resistance to lowballs.
- Current owner paid $90k; list at $253k implies a 181% gain — meaningful room to come down on a strong offer.
Risks & watch-outs
- Climate carrying-cost: severe wind risk, 99% chance of damaging wind over 30y; extreme-heat days projected 6→18/yr by 2055 (HVAC capex compounding) — expect insurance premiums to compound above CPI over the hold.
Questions for the listing agent
- What do current leases actually rent for vs. the listed asking? Can we see a recent rent roll and the last 12 months of T-12 income?
- What does the HOA fee cover, when was the last increase, and are there any pending special assessments or reserve-fund shortfalls?
- Is there a deadline driving the sale (1031 exchange, divorce, estate, relocation)? That informs how much negotiation room exists.
- Crime grade is F in this area — have there been break-ins, vandalism, or insurance claims at this property in the last 3 years? What carrier currently insures it and at what premium?
- The area grade is low — what's the realistic commute time and amenity access for the typical tenant pool here? Any planned neighborhood developments (good or bad) we should know about?
- What's the average days-on-market for RENTAL listings here right now (not sales)? A rising rental-DOM trend means longer vacancies and softer asking-rent achievability than the comps imply.
- What's the recent tenant-quality profile in this submarket — average credit score on applications, eviction rate, late-payment / NSF rate, and stable-employment percentage? A property-management company in the area should have these aggregated.
- How much new for-sale + rental construction is in the pipeline within 1–3 miles? Heavy new supply typically softens prices + rents 12–24 months out; constrained supply supports both.
Investment metrics
- 1% rule
- 1.13% ✓
- Cap rate
- 6.24%
- Cash-on-cash
- -0.18%
- DSCR
- 0.99
- GRM
- 7.4
CMA / ARV
No comps found within radius.
Projected returns pro-forma
-3.0% appreciation · 0.0% rent growth · sell at horizon
- IRR
- -20.9%
- Equity multiple
- 0.30×
- Total profit
- $-49,687
- Equity at exit
- $37,723
- IRR
- -27.3%
- Equity multiple
- -0.06×
- Total profit
- $-75,077
- Equity at exit
- $21,875
Cash invested: $70,840 (down + closing). Projections, not guarantees.
Landlord ↔ Tenant lean methodology
- Overall (STATE)
- 87 Strongly Landlord-Friendly
- State Florida
- 87 Strongly Landlord-Friendly · R+3
- County
- — inherits STATE
- City
- — inherits STATE
ZIP-level market 33404
- Home prices YoY
- -31.1%
- Rents YoY
- -0.7%
- Active inventory
- 506
- Price-to-rent
- 7.4×
Monthly cashflow live
- Estimated rent
- $2,865 medium interval (Pro) →
- Mortgage (P&I)
- −$1,327
- Tax from tax record
- −$496 /mo · $5,958/yr
- Insurance
- −$105
- HOA
- −$345
- Vacancy / Maint / Mgmt
- −$602
- Net cashflow
- $-10
Break-even live
UW: 25.0% down · 7.5% · 30yr · 1.5% tax · 5.0% vac · 8.0% maint · 8.0% mgmt
Financing live
Cash to close
- Down payment
- $63,250
- Closing costs
- $7,590
- Reserves months
- —
- Total cash needed
- —
Loan-product check · same deal, 3 products live
Conventional
25% down · 7.5% · 30yr
- Down + closing
- —
- Monthly P&I
- —
- Monthly cashflow
- —
- DSCR
- —
- Eligible?
- —
Personal DTI + credit; lowest rate.
DSCR
20% down · 8.5% · 30yr
- Down + closing
- —
- Monthly P&I
- —
- Monthly cashflow
- —
- DSCR
- —
- Eligible?
- —
No personal income docs; deal must DSCR.
Hard money
10% down · 12.0% · 12mo
- Down + closing
- —
- Monthly P&I
- —
- Monthly cashflow
- —
- DSCR
- —
- Eligible?
- —
Short-term bridge; refi at stabilization.
Rent comps 3 comps
| Address | Beds | Baths | Sqft | Rent | $/sqft | DOM | Units | Dist |
|---|---|---|---|---|---|---|---|---|
| 1401 W 9th St Riviera Beach, FL | 3.0 | 2.0 | 1304 | $3,200 | $2.45 | 24d | 1 | 1.03mi |
| 5649 Mentmore Dr Riviera Beach, FL | 3.0 | 2.5 | 1450 | $2,900 | $2.00 | 24d | 1 | 1.12mi |
| 195 River Grove Way West Palm Beach, FL | 2.0 | 1.0–2.0 | 828 | $3,002 | $3.63 | 1d | 18 | 1.45mi |
HOA detail
- Monthly dues
- $345 · $4,140/yr
Listing history 3 events
-
2026-06-18days on market $253,000 Active 10 DOM
-
2026-06-17remarks 699-char remark
-
2026-06-17$253,000 Active 9 DOM
ⓘ Source: listings_history table (triggers on properties + properties_extension) + one-shot
backfill from property_details.listing_events for pre-trigger history.
Tax reassessment forecast FL · Resets to sale price
- Current annual tax
- $5,958 · $496/mo
- Projected year-2 tax
- $5,958 · $496/mo
- Expected delta
- $0/yr ($0/mo · 0.0%)
ⓘ Screening estimate from a state-policy table — verify with the county assessor before closing.
Climate risk First Street
- Flood 1/10 Low FEMA zone X (unshaded) · 0% chance over 30 yrs
- Wildfire 1/10 Low
- Heat 9/10 Extreme 6 d/yr ≥106°F today · 18 d/yr by 30 yrs out
- Wind 10/10 Extreme 99% chance of damaging wind over 30 yrs
- Air quality 2/10 Low 0 unhealthy d/yr today · 1 by 30 yrs out
Nearby sold comps map
Loading sold comps map…
Walkable amenities ~0.75 mi
Loading nearby amenities…
Taxation est. · year 1
- Rental income
- $34,379
- − Mortgage interest
- −$14,172
- − Property taxes
- −$5,958
- − Insurance
- −$1,265
- − Repairs & maintenance
- −$2,750
- − Management
- −$2,750
- − HOA
- −$4,140
- − Depreciation
- −$7,360
- Taxable loss
- −$4,016
- Est. tax savings @ 24.0%
- +$964
- After-tax cash flow
- $839/yr
For passive investors: Depreciation is non-cash, so a rental often shows a tax loss while cash-flowing — sheltering income. Rental losses are passive: they offset passive income freely, and up to $25,000/yr can offset ordinary (W-2) income if you actively participate and your MAGI is under $100k (phasing out to $0 by $150k); unused losses carry forward. On sale, claimed depreciation is recaptured at up to 25%, and gains may owe capital-gains tax (a 1031 exchange can defer both). Figures are a year-1 estimate at your 24.0% rate — not tax advice; consult a CPA.
Schools (NCES district)
- District
- Palm Beach
- NCES district ID
- 1201500
- Math proficiency
- 46% ▼ -16.00%
- Reading proficiency
- 53% ▼ -4.00%
- Median HH income
- $53,943
- Composite
- 42.72/100
- National rank
- #3160
- State rank
- #34 of 73 in FL
Livability — Riviera Beach
- Score
- 67/100
- State rank
- #581
- US rank
- #11060
Category grades
Schools grade is shown separately in the Schools card above.
Census & demographics
- Census place
- Riviera Beach, FL
- County
- Palm Beach County · 1,438,312 people
- City population
- 30,912
- Metro
- Miami-Fort Lauderdale-Pompano Beach, FL
- Population (ZIP)
- 30,912
- Household income
- $65,063
- Rent vs Own
- Severe rent burden
- 1838.0
Population outlook (Palm Beach County) Hauer SSP2
- Today (2025)
- 1,637,487 people
- By 2030
- 1,743,255 · +6.5%
- By 2040
- 1,948,712 · +19.0%
- By 2050
- 2,132,979 · +30.3%
- By 2075
- 2,530,027 · +54.5%
- By 2100
- 2,706,979 · +65.3%
Race, ethnicity, and origin ACS 2023
- Neighborhood character
- Majority Black (64%)
- Race & ethnicity
- Black 64% White 22% Hispanic / Latino 9% Two or more races 8%
- Hispanic origin (detail)
- Mexican 1% Puerto Rican 1%
- Common ancestry
- Hispanic 8% Romanian 1% Italian 1%
- Foreign-born
- 21% · Canada, Jamaica
- Languages at home
- 82% English-only · Spanish 8% French/Haitian/Cajun 7% Other Indo-European 1%
Political lean MEDSL · Palm Beach
- 2024 margin
- Toss-up / Even · D 50.0% · R 49.2%
- 2008→2024 swing
- -22.1pp toward R · 2008: 22.9pp · 2024: 0.8pp
- All cycles
- 2024: D+0.8 2020: D+12.8 2016: D+15.3 2012: D+17.0 2008: D+22.9
Not yet ingested
- Civics
- —
Market trends
- HPI YoY
- ▼ -153.74%
- Current HPI
- 341.1761
- Rent YoY
- ▼ -0.72%
- Metro
- Miami-Fort Lauderdale-Pompano Beach, FL
- State GDP YoY
- ▲ 3.28%
- F500 in state
- 36
Industry mix (Fortune 500 HQ in FL)
| Industry | F500 HQs | Revenue |
|---|---|---|
| Industrial Technology | 2 | $29B |
|
||
| Insurance | 2 | $17B |
|
||
| Retail | 1 | $60B |
|
||
| Technology Distribution | 1 | $58B |
|
||
| Homebuilding | 1 | $35B |
|
||
| Technology Manufacturing | 1 | $35B |
|
||
Price history
-95.1% since first listed14 events — show timeline
- 2026-06-16 Relisted — Beaches MLS
- 2026-05-22 Listing Removed — Beaches MLS
- 2026-05-22 Rental Removed $2,100 GFLMLS
- 2026-05-15 Listed for Rent $2,100 GFLMLS
- 2026-05-14 Listed $253,000 Beaches MLS
- 2022-11-29 Rental Removed — RMLSFL
- 2016-12-07 Sold (MLS) $90,000 Beaches MLS
- 2016-12-05 Pending — Beaches MLS
- 2016-12-03 Listed $90,000 Beaches MLS
- 2016-10-18 Sold (Public Records) $90,000 Public Records
- 2012-12-11 Sold (Public Records) $48,000 Public Records
- 2012-11-19 Sold (MLS) $48,000 Beaches MLS
- 2012-11-01 Listing Removed — Beaches MLS
- 2012-05-13 Listed $42,500 Beaches MLS
Property tax history
+5.9%/yrLatest (2025): $5,958 · +3.6% YoY. Source: county tax records.
Cash-flow waterfall
monthlySold comps — $/sqft
last 12 mo · ≤1 miLoading sold comps…