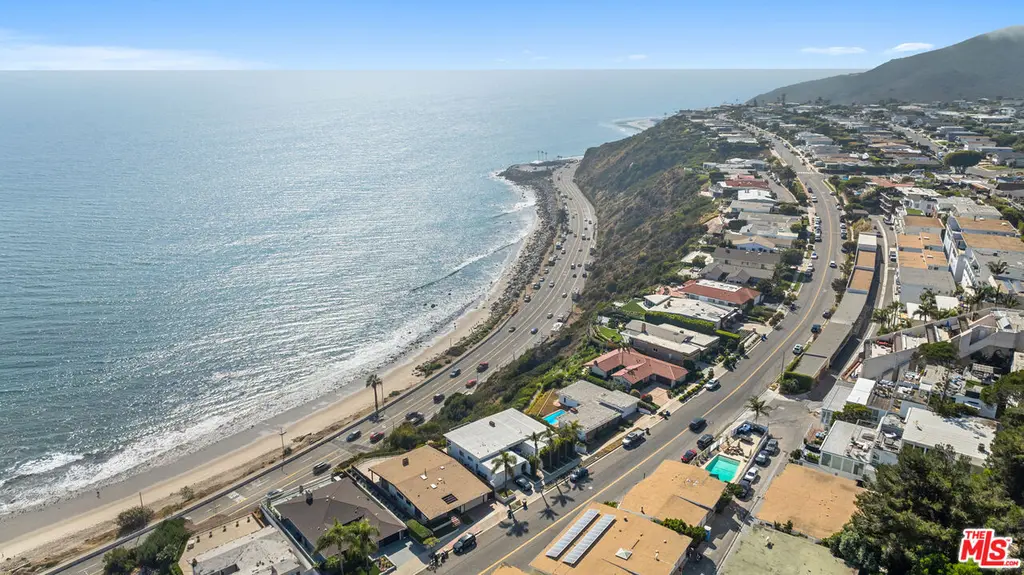
18111 Coastline Dr #1 · Topanga, CA
Flood risk 1/10 · Minimal
- FEMA flood zone
- X (unshaded)
- Chance of flooding over 30 yrs
- 0.0%
- Est. flood insurance / yr
- $507 – $1,088
Fire risk 5/10 · Moderate
- Est. fire insurance / yr
- $659 – $1,223
Heat risk 7/10 · Major
- Hot days now (above 80°F)
- 8 days/yr
- Hot days in 30 yrs
- 21 days/yr
Wind risk 1/10 · Minimal
- Chance of severe wind over 30 yrs
- —
Air-quality risk 4/10 · Minor
- Unhealthy air days now
- 6 days/yr
- Unhealthy air days in 30 yrs
- 6 days/yr
Risk factors via First Street. Map © Google.
Why this score? — see what drove the D grade
The composite is a weighted blend of 9 inputs, each scored 0–100. Each bar is that input's sub-score; the figure is the points it added to the 100-point composite (weight × sub-score).
- ARV discount +11.9/15.0
- Cash flow +8.6/30.0
- Schools +6.2/10.0
- Appreciation +5.3/10.0
- Livability +2.8/5.0
- 1% rule +2.5/10.0
- Condition / age +2.5/5.0
- DSCR +2.3/10.0
- Rent growth +1.7/5.0
$1,250,000
🖨 Deal sheet (PDF) 📄 Offer letter ✓ Due diligence
Listing remarks
With stunning ocean views from nearly every room, this beautiful coastal condo is located in the highly desirable Sunset Mesa neighborhood. The main living room features sweeping Pacific vistas and opens to a spacious balcony, perfect for relaxing or entertaining. A dedicated dining area with more spectacular views leads into the recently remodeled kitchen, which includes quartz countertops, brand-new stainless-steel appliances, and custom cabinetry. The guest bedroom is spacious and bright, accompanied by an updated bathroom with a large soaking tub. The primary suite offers a continuation of views along the coastline, with a private balcony overlooking the iconic Queen's Necklace and a ta
Key facts
- Coastal condo
- Quartz countertops
- Spacious balcony
Tags
Property features AI
Finance
- Other: Complex name: Malibu Coastline Views; Unit located on floor 1; directions: PCH to Coastline Drive
- HOA & community: Monthly HOA dues (approximately $423); Association maintains landscaping; Association allows pets; HOA fees include earthquake insurance, trash, water and sewer; Small complex with 4 units
Exterior
- Parking: Assigned attached 1-car garage with door opener; One additional covered parking space; One additional open parking space (total 2 parking spaces)
- Utilities: Water and sewer included in association fees
- Home design: Residential condominium; Garden-style, attached building; One level; Entry on level 1
- Construction: Attached common walls
- Exterior features: Ocean view
Interior
- Kitchen: Electric cooktop; Electric oven; Microwave; Refrigerator; Freezer; Ice maker; Dishwasher
- Bedrooms: Entry on level 1
- Flooring: Hardwood floors
- Bathrooms: 2 full bathrooms
- Heating & cooling: Radiant heat; No cooling
- Interior features: Dining area; Covered patio; Jack-and-Jill layout; Living room; Great room; Cable available; Garbage disposal; Water line to refrigerator; Has ocean view
- Laundry & utility: In-unit laundry (washer and dryer included)
Neighborhood map
What this means for you Summary
Snapshot
- This is a 2-bed/2.0-bath condo listed at $1.25M.
Deal economics
- At list price, monthly cash flow is $-1k ($-13k/yr) — negative.
- To cash-flow at today's rent, offer at most $1.06M (15.3% below list).
- To meet the 1% rule (rent ≥ 1% of price), the offer needs to be $937k (25.1% below list).
- Recommended offer: $937k (25.1% below list) — sets the bar for 1% rule.
- Cap rate 5.3% vs local median 2.6% in Topanga — top-decile yield for the area; either an underpriced asset or a hidden risk that comps aren't pricing in. Stress-test before assuming the spread holds.
Location & tenants
- Location reads 55/100 on livability (#846 in CA) — a working-class tenant base; expect higher turnover. Strengths: employment A+, crime A; Watch: amenities F, commute F, cost of living F.
- Santa Monica-Malibu Unified (urban): math 61% / reading 74% proficiency, ranked #123 of 1,400 in CA (top 9%) — acceptable for families but not a draw, mixed tenant base, ~2y average lease.
- Zoned schools: Webster Elementary (214 students, 10% FRL).
- Market conditions: Rents falling (-3.4%/yr); 636 active listings in the ZIP; 9 comparable units currently listed for rent nearby; rentals lingering (median 46d on market — plan ~5-8 weeks vacancy on turnover, expect pricing pressure); 78% of comp listings sitting > 30 days — soft ceiling on asking rent; high-income renter base; 19,697 units permitted in Los Angeles County in 2024 (9,426 in 5+ unit buildings).
- At $9,368/mo this rent would consume 57% of the median local household income ($197k/yr) (locally 420% of renters already pay >50% of income on rent) — very limited rent-growth headroom before tenants either downsize or default.
Forward outlook
- In year one you build about $16k of equity ($9k loan paydown + $8k appreciation (0.6% local appreciation)).
- Los Angeles County population projected at +9% by 2050 — modest demand growth; plan on rents tracking national, not racing it.
- By year 5, paydown + projected appreciation supports a ~$80k cash-out refi (75% LTV) — recoverable capital for the next deal without selling this one.
Negotiation context
- It's been on market 31 days — a 3% lower offer ($1.21M) is reasonable based on typical stale-listing flexibility.
- 15 sale attempts since 19y ago with the ask held roughly flat each time — persistent listings suggest the price (not the market) is what's stuck; bring a comps-based counter.
- Current owner paid $896k; 40% above their basis — modest negotiation headroom, anchor on the comps not their cost.
Risks & watch-outs
- Climate carrying-cost: moderate wildfire risk; extreme-heat days projected 8→21/yr by 2055 (HVAC capex compounding) — expect insurance premiums to compound above CPI over the hold.
Questions for the listing agent
- What do current leases actually rent for vs. the listed asking? Can we see a recent rent roll and the last 12 months of T-12 income?
- It's been on market 31 days. Have you received any prior offers? Is the seller open to a 25% concession, seller financing, or rate buy-down credit?
- Built in 1967 — when were the roof, HVAC, electrical panel, plumbing, and water heater last replaced?
- What does the HOA fee cover, when was the last increase, and are there any pending special assessments or reserve-fund shortfalls?
- Any open or pending special assessments — roof, HVAC, plumbing, elevator, façade? What's the per-unit balance and payoff schedule, and is the seller paying it off at close or rolling it to the buyer?
- Is there a deadline driving the sale (1031 exchange, divorce, estate, relocation)? That informs how much negotiation room exists.
- Schools are A-rated — typically a magnet for longer-tenancy family renters. What's the average tenant stay here, and is there a school-zone premium baked into asking?
- The area grade is low — what's the realistic commute time and amenity access for the typical tenant pool here? Any planned neighborhood developments (good or bad) we should know about?
- What's the average days-on-market for RENTAL listings here right now (not sales)? A rising rental-DOM trend means longer vacancies and softer asking-rent achievability than the comps imply.
- What's the recent tenant-quality profile in this submarket — average credit score on applications, eviction rate, late-payment / NSF rate, and stable-employment percentage? A property-management company in the area should have these aggregated.
- How much new apartment / multifamily construction is in the pipeline within 1–3 miles? Heavy new supply (>2% of stock underway) typically softens rents 12–24 months out; light construction supports rent growth.
Investment metrics
- 1% rule
- 0.75% ✗
- Cap rate
- 5.25%
- Cash-on-cash
- -3.72%
- DSCR
- 0.83
- GRM
- 11.1
CMA / ARV
- ARV (median comp)
- $1,385,151
- List price
- $1,250,000
- Delta
- -6.51%
- Verdict
- FAIR
- Comps
- 7 within 1.0 mi
Projected returns pro-forma
0.62% appreciation · 0.0% rent growth · sell at horizon
- IRR
- -5.7%
- Equity multiple
- 0.72×
- Total profit
- $-96,381
- Equity at exit
- $402,060
- IRR
- -1.9%
- Equity multiple
- 0.79×
- Total profit
- $-72,248
- Equity at exit
- $515,718
Cash invested: $350,000 (down + closing). Projections, not guarantees.
Landlord ↔ Tenant lean methodology
- Overall (STATE)
- 18 Strongly Tenant-Friendly
- State California
- 18 Strongly Tenant-Friendly · D+13
- County
- — inherits STATE
- City
- — inherits STATE
ZIP-level market 90265
- Home prices YoY
- 0.1%
- Rents YoY
- -3.4%
- Active inventory
- 636
- Price-to-rent
- 11.1×
Monthly cashflow live
- Estimated rent
- $9,368 high interval (Pro) →
- Mortgage (P&I)
- −$6,555
- Tax from tax record
- −$988 /mo · $11,852/yr
- Insurance
- −$521
- HOA
- −$423
- Vacancy / Maint / Mgmt
- −$1,967
- Net cashflow
- $-1,086
Break-even live
Sensitivity live
| Price | -10% $-378 | -5% $-732 | +0% $-1,086 | +5% $-1,440 | +10% $-1,793 |
|---|---|---|---|---|---|
| Rent | -10% $-1,826 | -5% $-1,456 | +0% $-1,086 | +5% $-716 | +10% $-346 |
| Rate | -1.0pp $-456 | -0.5pp $-768 | base $-1,086 | +0.5pp $-1,410 | +1.0pp $-1,739 |
UW: 25.0% down · 7.5% · 30yr · 1.5% tax · 5.0% vac · 8.0% maint · 8.0% mgmt
Financing live
Cash to close
- Down payment
- $312,500
- Closing costs
- $37,500
- Reserves months
- —
- Total cash needed
- —
Loan-product check · same deal, 3 products live
Conventional
25% down · 7.5% · 30yr
- Down + closing
- —
- Monthly P&I
- —
- Monthly cashflow
- —
- DSCR
- —
- Eligible?
- —
Personal DTI + credit; lowest rate.
DSCR
20% down · 8.5% · 30yr
- Down + closing
- —
- Monthly P&I
- —
- Monthly cashflow
- —
- DSCR
- —
- Eligible?
- —
No personal income docs; deal must DSCR.
Hard money
10% down · 12.0% · 12mo
- Down + closing
- —
- Monthly P&I
- —
- Monthly cashflow
- —
- DSCR
- —
- Eligible?
- —
Short-term bridge; refi at stabilization.
Rent comps 9 comps
| Address | Beds | Baths | Sqft | Rent | $/sqft | DOM | Units | Dist |
|---|---|---|---|---|---|---|---|---|
| 18103 Coastline Dr Unit 7 Malibu, CA | 2.0 | 2.0 | 1200 | $5,400 | $4.50 | 45d | 1 | 0.02mi |
| 18103 Coastline Dr Unit 8 Malibu, CA | 2.0 | 2.0 | 1200 | $5,800 | $4.83 | 45d | 1 | 0.02mi |
| 18065 Coastline Dr Unit 1 Malibu, CA | 2.0 | 2.0 | 1100 | $9,360 | $8.51 | 45d | 1 | 0.05mi |
| 18139 Coastline Dr Unit 2 Malibu, CA | 2.0 | 2.0 | 1200 | $6,500 | $5.42 | 45d | 1 | 0.07mi |
| 18139 Coastline Dr Unit 3 Malibu, CA | 2.0 | 2.0 | 1200 | $6,000 | $5.00 | 7d | 1 | 0.07mi |
| 18139 Coastline Dr Unit 1 Malibu, CA | 2.0 | 2.0 | 1200 | $6,000 | $5.00 | 45d | 1 | 0.07mi |
| 18147 Coastline Dr #5 Malibu, CA | 2.0 | 1.5 | 1210 | $5,000 | $4.13 | 45d | 1 | 0.08mi |
| 17350 W Sunset Blvd Pacific Palisades, CA | 1.0–2.0 | 1.0 | 944 | $5,000 | $5.29 | 0d | 2 | 0.99mi |
| 17366 W Sunset Blvd #201 Pacific Palisades, CA | 1.0 | 1.0 | 1051 | $5,500 | $5.23 | 45d | 1 | 1.01mi |
HOA detail condo
- Monthly dues
- $423 · $5,076/yr
- Assessments
- None detected in remarks — confirm with the listing agent.
Listing history 50 events
-
2026-06-21days on market $1,250,000 Active 31 DOM
-
2026-06-18days on market $1,250,000 Active 28 DOM
-
2026-06-17days on market $1,250,000 Active 27 DOM
-
2026-06-16days on market $1,250,000 Active 26 DOM
-
2026-06-15days on market $1,250,000 Active 25 DOM
-
2026-06-13days on market $1,250,000 Active 23 DOM
-
2026-06-13days on market $1,250,000 Active 22 DOM
-
2026-06-09days on market $1,250,000 Active 19 DOM
-
2026-06-08days on market $1,250,000 Active 18 DOM
-
2026-06-07days on market $1,250,000 Active 17 DOM
-
2026-06-04days on market $1,250,000 Active 14 DOM
-
2026-06-03days on market $1,250,000 Active 13 DOM
-
2026-06-02days on market $1,250,000 Active 12 DOM
-
2026-06-01days on market $1,250,000 Active 11 DOM
-
2026-05-31days on market $1,250,000 Active 10 DOM
-
2026-02-24$5,700
-
2026-01-06$1,295,000 Active 1202-char remark
-
2025-06-18Active
-
2025-04-17price
-
2025-03-14Active
-
2024-10-30price
-
2024-10-02Active
-
2024-05-14status Active
-
2024-03-12price
-
2024-02-19Active
-
2020-07-31soldstatus $895,787 Sold
-
2020-07-31soldstatus $896,000
-
2020-06-26historical Backup Offers Accepted
-
2020-06-19$999,000 Active
-
2020-06-17historical
-
2020-01-20price $1,099,000
-
2019-10-09$1,149,000 Active
-
2015-09-16soldstatus $814,000
-
2013-11-22historical Withdrawn
-
2013-09-27status Active
-
2013-08-30status Pending
-
2013-07-23Active
-
2011-01-01historical Expired
-
2010-07-23Active
-
2008-07-03soldstatus $1,165,000 Closed
-
2008-07-02soldstatus $1,165,000
-
2008-06-30historical
-
2008-06-18historical
-
2008-05-09price $1,198,000
-
2008-04-18price $1,268,000
-
2008-04-05price $1,298,000
-
2008-04-02price $1,348,000
-
2008-03-13price $1,368,000
-
2008-02-21price $1,268,000
-
2008-01-18price $1,253,000
ⓘ Source: listings_history table (triggers on properties + properties_extension) + one-shot
backfill from property_details.listing_events for pre-trigger history.
Tax reassessment forecast CA · Resets to sale price
- Current annual tax
- $11,852 · $988/mo
- Projected year-2 tax
- $11,852 · $988/mo
- Expected delta
- $0/yr ($0/mo · 0.0%)
ⓘ Screening estimate from a state-policy table — verify with the county assessor before closing.
Climate risk First Street
- Flood 1/10 Low FEMA zone X (unshaded) · 0% chance over 30 yrs
- Wildfire 5/10 Major
- Heat 7/10 Severe 8 d/yr ≥80°F today · 21 d/yr by 30 yrs out
- Wind 1/10 Low
- Air quality 4/10 Moderate 6 unhealthy d/yr today · 6 by 30 yrs out
Nearby sold comps map
Loading sold comps map…
Walkable amenities ~0.75 mi
Loading nearby amenities…
Taxation est. · year 1
- Rental income
- $112,416
- − Mortgage interest
- −$70,019
- − Property taxes
- −$11,852
- − Insurance
- −$6,250
- − Repairs & maintenance
- −$8,993
- − Management
- −$8,993
- − HOA
- −$5,076
- − Depreciation
- −$36,364
- Taxable loss
- −$35,131
- Est. tax savings @ 24.0%
- +$8,432
- After-tax cash flow
- $-4,599/yr
For passive investors: Depreciation is non-cash, so a rental often shows a tax loss while cash-flowing — sheltering income. Rental losses are passive: they offset passive income freely, and up to $25,000/yr can offset ordinary (W-2) income if you actively participate and your MAGI is under $100k (phasing out to $0 by $150k); unused losses carry forward. On sale, claimed depreciation is recaptured at up to 25%, and gains may owe capital-gains tax (a 1031 exchange can defer both). Figures are a year-1 estimate at your 24.0% rate — not tax advice; consult a CPA.
Schools (NCES district)
- District
- Santa Monica-Malibu Unified
- NCES district ID
- 0635700
- Math proficiency
- 61% ▬ 0.00%
- Reading proficiency
- 74% ▬ 0.00%
- Median HH income
- $81,489
- Composite
- 61.58/100
- National rank
- #1535
- State rank
- #123 of 1400 in CA
Livability — Topanga
- Score
- 55/100
- State rank
- #846
- US rank
- #23336
Category grades
Schools grade is shown separately in the Schools card above.
Census & demographics
- Census place
- Topanga, CA
- County
- Los Angeles County · 9,444,647 people
- City population
- 6,315
- Metro
- Los Angeles-Long Beach-Anaheim, CA
- Population (ZIP)
- 15,918
- Household income
- $196,742
- Rent vs Own
- Severe rent burden
- 420.0
Population outlook (Los Angeles County) Hauer SSP2
- Today (2025)
- 10,940,515 people
- By 2030
- 11,256,481 · +2.9%
- By 2040
- 11,729,929 · +7.2%
- By 2050
- 11,948,407 · +9.2%
- By 2075
- 11,818,114 · +8.0%
- By 2100
- 10,842,928 · -0.9%
Race, ethnicity, and origin ACS 2023
- Neighborhood character
- Predominantly White (77%)
- Race & ethnicity
- White 77% Two or more races 10% Hispanic / Latino 9% Asian 5% Black 1%
- Hispanic origin (detail)
- Mexican 6%
- Common ancestry
- Italian 8% Scotch-Irish 3% Romanian 3%
- Foreign-born
- 16% · Canada, South Korea, China
- Languages at home
- 82% English-only · Spanish 6% Other Indo-European 6% French/Haitian/Cajun 2%
Political lean MEDSL · Los Angeles
- 2024 margin
- Solid D (+32.9) · D 64.8% · R 31.9% · Other 3.3%
- 2008→2024 swing
- -7.4pp toward R · 2008: 40.4pp · 2024: 32.9pp
- All cycles
- 2024: D+32.9 2020: D+44.2 2016: D+48.0 2012: D+40.0 2008: D+40.4
Not yet ingested
- Civics
- —
Market trends
- HPI YoY
- ▲ 0.62%
- Current HPI
- 498.5117
- Rent YoY
- ▼ -3.39%
- Metro
- Los Angeles-Long Beach-Anaheim, CA
- State GDP YoY
- ▲ 3.21%
- F500 in state
- 116
Industry mix (Fortune 500 HQ in CA)
| Industry | F500 HQs | Revenue |
|---|---|---|
| Technology | 27 | $1,492B |
|
||
| Financial Services | 3 | $174B |
|
||
| Retail | 3 | $44B |
|
||
| Insurance | 3 | $26B |
|
||
| Media / Entertainment | 2 | $115B |
|
||
| Pharmaceuticals / Biotech | 2 | $62B |
|
||
Price history
+2.0% since first listed42 events — show timeline
- 2026-05-21 Listed $1,250,000 TheMLS
- 2026-02-24 Listed for Rent $5,700 CLAW
- 2026-01-06 Listed — TheMLS
- 2025-06-18 Listed — TheMLS
- 2025-04-17 Price Changed — TheMLS
- 2025-03-14 Listed — TheMLS
- 2024-10-30 Price Changed — TheMLS
- 2024-10-02 Listed — TheMLS
- 2024-05-14 Relisted — TheMLS
- 2024-03-12 Price Changed — TheMLS
- 2024-02-19 Listed — TheMLS
- 2020-07-31 Sold (Public Records) $896,000 Public Records
- 2020-07-31 Sold (MLS) $895,787 TheMLS
- 2020-06-26 Contingent — TheMLS
- 2020-06-19 Listed $999,000 TheMLS
- 2020-06-17 Listing Removed — CRMLS
- 2020-01-20 Price Changed $1,099,000 CRMLS
- 2019-10-09 Listed $1,149,000 CRMLS
- 2015-09-16 Sold (Public Records) $814,000 Public Records
- 2013-11-22 Delisted — TheMLS
- 2013-09-27 Relisted — TheMLS
- 2013-08-30 Pending — TheMLS
- 2013-07-23 Listed — TheMLS
- 2011-01-01 Delisted — TheMLS
- 2010-07-23 Listed — TheMLS
- 2008-07-03 Sold (MLS) $1,165,000 TheMLS
- 2008-07-02 Sold (Public Records) $1,165,000 Public Records
- 2008-06-30 Delisted — TheMLS
- 2008-06-18 Contingent — TheMLS
- 2008-05-09 Price Changed $1,198,000 TheMLS
- 2008-04-18 Price Changed $1,268,000 TheMLS
- 2008-04-05 Price Changed $1,298,000 TheMLS
- 2008-04-02 Price Changed $1,348,000 TheMLS
- 2008-03-13 Price Changed $1,368,000 TheMLS
- 2008-02-21 Price Changed $1,268,000 TheMLS
- 2008-01-18 Price Changed $1,253,000 TheMLS
- 2008-01-08 Price Changed $1,258,000 TheMLS
- 2008-01-03 Price Changed $1,263,000 TheMLS
- 2007-11-18 Listed $1,268,000 TheMLS
- 2007-11-15 Delisted — TheMLS
- 2007-09-21 Listed — TheMLS
- 2001-08-29 Sold (Public Records) $1,225,000 Public Records
Property tax history
+7.5%/yrLatest (2025): $11,852 · -0.4% YoY. Source: county tax records.
Cash-flow waterfall
monthlySold comps — $/sqft
last 12 mo · ≤1 miLoading sold comps…