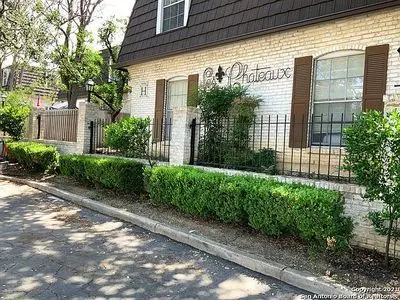
8038 Broadway · San Antonio, TX
Flood risk 1/10 · Minimal
- FEMA flood zone
- X (unshaded)
- Chance of flooding over 30 yrs
- 0.0%
- Est. flood insurance / yr
- $507 – $1,088
Fire risk 1/10 · Minimal
- Est. fire insurance / yr
- $1,222 – $2,270
Heat risk 8/10 · Major
- Hot days now (above 108°F)
- 7 days/yr
- Hot days in 30 yrs
- 22 days/yr
Wind risk 6/10 · Moderate
- Chance of severe wind over 30 yrs
- 77.0%
Air-quality risk 2/10 · Minimal
- Unhealthy air days now
- 1 days/yr
- Unhealthy air days in 30 yrs
- 1 days/yr
Risk factors via First Street. Map © Google.
Why this score? — see what drove the F grade
The composite is a weighted blend of 9 inputs, each scored 0–100. Each bar is that input's sub-score; the figure is the points it added to the 100-point composite (weight × sub-score).
- ARV discount +7.5/15.0
- 1% rule +6.4/10.0
- Cash flow +5.7/30.0
- Schools +5.0/10.0
- Livability +4.0/5.0
- Condition / age +2.5/5.0
- Rent growth +2.2/5.0
- DSCR +0.1/10.0
- Appreciation +0.0/10.0
$145,000
🖨 Deal sheet 📄 Offer letter ✓ Due diligence
Listing remarks
GREAT ground floor 2/1 w/ fenced patio next to pool * OWNER WILL CARRY NOTE * Alamo Heights schools * On Broadway and busline straight downtown * * covered parking * * guest parking * * Owner is licensed agent
Key facts
- Fenced patio
- Next to pool
- Guest parking
Tags
Property features AI
Exterior
- Home design: Built in 1965
- Construction: Living area approximately 1,133
- Exterior features: Located in the Uptown Central subdivision
Neighborhood map
What this means for you Summary
Snapshot
- This is a 2-bed/2.0-bath condo listed at $145k.
Deal economics
- At list price, monthly cash flow is $-298 ($-4k/yr) — negative.
- The deal already cash-flows at list — no discount required.
- Meets the 1% rule at list price ($2k rent vs $145k).
- Recommended offer: $143k (1.5% below list) — sets the bar for market timing.
Location & tenants
- Location reads 80/100 on livability (#31 in TX, #1,616 nationally) — a professional / high-income tenant draw. Strengths: amenities A+, commute A+, cost of living A+; Watch: schools C-, crime F.
- Alamo Heights ISD (urban): math 52% / reading 60% proficiency, ranked #73 of 826 in TX (top 9%) — acceptable for families but not a draw, mixed tenant base, ~2y average lease.
- Market conditions: Rents soft (-1.0%/yr); 363 active listings in the ZIP; 40 comparable units currently listed for rent nearby; rentals at typical pace (median 22d on market — plan ~3-4 weeks tenant-placement turnaround); solid renter incomes; 8,308 units permitted in Bexar County in 2024 (2,506 in 5+ unit buildings).
Forward outlook
- Local home prices are declining (-3.0%/yr); year-one equity from $1k of loan paydown is wiped out by about $4k of value loss. Plan a longer hold.
- Bexar County population projected at +50% by 2050 — long-run rental-demand tailwind backs the buy-and-hold thesis.
Negotiation context
- It's been on market 21 days — a 2% lower offer ($143k) is reasonable based on typical stale-listing flexibility.
- 4 sale attempts since 2y ago with the ask held roughly flat each time — persistent listings suggest the price (not the market) is what's stuck; bring a comps-based counter.
Risks & watch-outs
- Watch-outs: property tax is 2.6% of price; HOA is 28% of rent.
- Climate carrying-cost: major wind risk, 77% chance of damaging wind over 30y; extreme-heat days projected 7→22/yr by 2055 (HVAC capex compounding) — expect insurance premiums to compound above CPI over the hold.
Questions for the listing agent
- What do current leases actually rent for vs. the listed asking? Can we see a recent rent roll and the last 12 months of T-12 income?
- Built in 1965 — when were the roof, HVAC, electrical panel, plumbing, and water heater last replaced?
- Property tax is high relative to price — has the assessment been appealed recently, and will the sale trigger a re-assessment?
- What does the HOA fee cover, when was the last increase, and are there any pending special assessments or reserve-fund shortfalls?
- Any open or pending special assessments — roof, HVAC, plumbing, elevator, façade? What's the per-unit balance and payoff schedule, and is the seller paying it off at close or rolling it to the buyer?
- Is there a deadline driving the sale (1031 exchange, divorce, estate, relocation)? That informs how much negotiation room exists.
- Crime grade is F in this area — have there been break-ins, vandalism, or insurance claims at this property in the last 3 years? What carrier currently insures it and at what premium?
- The area grade is low — what's the realistic commute time and amenity access for the typical tenant pool here? Any planned neighborhood developments (good or bad) we should know about?
- What's the average days-on-market for RENTAL listings here right now (not sales)? A rising rental-DOM trend means longer vacancies and softer asking-rent achievability than the comps imply.
- What's the recent tenant-quality profile in this submarket — average credit score on applications, eviction rate, late-payment / NSF rate, and stable-employment percentage? A property-management company in the area should have these aggregated.
- How much new apartment / multifamily construction is in the pipeline within 1–3 miles? Heavy new supply (>2% of stock underway) typically softens rents 12–24 months out; light construction supports rent growth.
Investment metrics
- 1% rule
- 1.14% ✓
- Cap rate
- 3.83%
- Cash-on-cash
- -8.81%
- DSCR
- 0.61
- GRM
- 7.3
CMA / ARV
No comps found within radius.
Projected returns pro-forma
-3.0% appreciation · 0.0% rent growth · sell at horizon
- IRR
- -37.8%
- Equity multiple
- -0.16×
- Total profit
- $-46,918
- Equity at exit
- $21,620
- IRR
- -99.4%
- Equity multiple
- -1.03×
- Total profit
- $-82,379
- Equity at exit
- $12,537
Cash invested: $40,600 (down + closing). Projections, not guarantees.
Landlord ↔ Tenant lean methodology
- Overall (STATE)
- 87 Strongly Landlord-Friendly
- State Texas
- 87 Strongly Landlord-Friendly · R+5
- County
- — inherits STATE
- City
- — inherits STATE
ZIP-level market 78209
- Rents YoY
- -1.0%
- Active inventory
- 363
- Price-to-rent
- 7.3×
Monthly cashflow live
- Estimated rent
- $1,649 high interval (Pro) →
- Mortgage (P&I)
- −$760
- Tax from tax record
- −$320 /mo · $3,840/yr
- Insurance
- −$60
- HOA est. from 11 same-building comps
- −$460
- Vacancy / Maint / Mgmt
- −$346
- Net cashflow
- $-298
Break-even live
UW: 25.0% down · 7.5% · 30yr · 1.5% tax · 5.0% vac · 8.0% maint · 8.0% mgmt
Financing live
Cash to close
- Down payment
- $36,250
- Closing costs
- $4,350
- Reserves months
- —
- Total cash needed
- —
Loan-product check · same deal, 3 products live
Conventional
25% down · 7.5% · 30yr
- Down + closing
- —
- Monthly P&I
- —
- Monthly cashflow
- —
- DSCR
- —
- Eligible?
- —
Personal DTI + credit; lowest rate.
DSCR
20% down · 8.5% · 30yr
- Down + closing
- —
- Monthly P&I
- —
- Monthly cashflow
- —
- DSCR
- —
- Eligible?
- —
No personal income docs; deal must DSCR.
Hard money
10% down · 12.0% · 12mo
- Down + closing
- —
- Monthly P&I
- —
- Monthly cashflow
- —
- DSCR
- —
- Eligible?
- —
Short-term bridge; refi at stabilization.
Rent comps 40 comps
| Address | Beds | Baths | Sqft | Rent | $/sqft | DOM | Units | Dist |
|---|---|---|---|---|---|---|---|---|
| 8030 Broadway Unit 102E San Antonio, TX | 2.0 | 2.0 | 1155 | $1,300 | $1.13 | 43d | 1 | 0.04mi |
| 8030 Broadway San Antonio, TX | 1.0 | 1.0 | 871 | $1,671 | $1.92 | 43d | 1 | 0.05mi |
| 8051 Broadway San Antonio, TX | 1.0–2.0 | 1.0–2.0 | 761 | $1,293 | $1.70 | 2d | 27 | 0.11mi |
| 112 E Sunset Rd San Antonio, TX | 3.0 | 2.0 | 1179 | $2,300 | $1.95 | 23d | 1 | 0.14mi |
| 8123 Scottshill San Antonio, TX | 2.0 | 2.5 | 1348 | $1,495 | $1.11 | 12d | 1 | 0.15mi |
| 1903 Flamingo Dr San Antonio, TX | 3.0 | 2.5 | 1384 | $1,995 | $1.44 | 12d | 1 | 0.18mi |
| 7926 Broadway #608 San Antonio, TX | 2.0 | 2.0 | 1075 | $1,795 | $1.67 | 23d | 1 | 0.21mi |
| 7926 Broadway #102 San Antonio, TX | 2.0 | 2.0 | 1153 | $1,499 | $1.30 | 14d | 1 | 0.21mi |
| 100 Lorenz Rd San Antonio, TX | 3.0 | 3.0 | 1440 | $1,495 | $1.04 | 43d | 1 | 0.29mi |
| 100 Lorenz Rd San Antonio, TX | 2.0 | 2.0 | 1169 | $1,800 | $1.54 | 17d | 1 | 0.29mi |
| 2010 Edgehill Dr San Antonio, TX | 2.0 | 2.0 | 1290 | $2,395 | $1.86 | 17d | 1 | 0.32mi |
| 2010 Edgehill Dr San Antonio, TX | 2.0 | 2.0 | 1290 | $2,395 | $1.86 | 43d | 1 | 0.32mi |
| 8222 Gault Ln Unit 710 San Antonio, TX | 2.0 | 2.0 | 789 | $981 | $1.24 | 2d | 1 | 0.36mi |
| 327 W Sunset Rd San Antonio, TX | 1.0–2.0 | 1.0–2.0 | 847 | $1,571 | $1.85 | 2d | 2 | 0.39mi |
| 8011 N New Braunfels Ave San Antonio, TX | 1.0–2.0 | 1.0–2.0 | 775 | $1,399 | $1.81 | 43d | 4 | 0.41mi |
| 2118 Edgehill Dr Unit 710 San Antonio, TX | 2.0 | 2.0 | 750 | $1,332 | $1.78 | 2d | 1 | 0.43mi |
| 384 Treeline Park San Antonio, TX | 1.0–3.0 | 1.0–2.0 | 956 | $1,415 | $1.48 | 4d | 8 | 0.47mi |
| 8401 N New Braunfels Ave San Antonio, TX | 1.0–2.0 | 1.0–2.0 | 793 | $1,150 | $1.45 | 23d | 5 | 0.50mi |
| 8446 Country Village St Unit 710 San Antonio, TX | 2.0 | 2.0 | 850 | $881 | $1.04 | 2d | 1 | 0.50mi |
| 103 Oakhurst Pl San Antonio, TX | 2.0 | 1.0 | 1235 | $1,550 | $1.26 | 4d | 1 | 0.50mi |
| 7731 Broadway San Antonio, TX | 1.0 | 1.0 | 874 | $1,597 | $1.83 | 23d | 1 | 0.50mi |
| 340 Treeline Park San Antonio, TX | 1.0–3.0 | 1.0–2.0 | 1001 | $1,630 | $1.63 | 1d | 29 | 0.51mi |
| 100 Lorenz Rd San Antonio, TX | 2.0 | 2.0–2.5 | 1225 | $1,700 | $1.39 | 4d | 2 | 0.52mi |
| 100 Lorenz Rd San Antonio, TX | 1.0–2.0 | 1.0–2.0 | 1016 | $1,800 | $1.77 | 23d | 2 | 0.52mi |
| 8446 Country Village St San Antonio, TX | 1.0–3.0 | 1.0 | 800 | $1,176 | $1.47 | 23d | 45 | 0.52mi |
| 7711 Broadway Unit 27C San Antonio, TX | 2.0 | 2.0 | 1123 | $1,950 | $1.74 | 43d | 1 | 0.54mi |
| 7711 Broadway Unit 11C San Antonio, TX | 2.0 | 2.0 | 1161 | $2,200 | $1.89 | 23d | 1 | 0.55mi |
| 7711 Broadway Unit 4B San Antonio, TX | 3.0 | 2.0 | 1362 | $2,150 | $1.58 | 43d | 1 | 0.55mi |
| 7711 Broadway Unit 3B San Antonio, TX | 2.0 | 2.0 | 1127 | $1,925 | $1.71 | 43d | 1 | 0.55mi |
| 7711 Broadway Unit 1C San Antonio, TX | 3.0 | 2.0 | 1300 | $2,400 | $1.85 | 17d | 1 | 0.55mi |
| 7709 Broadway San Antonio, TX | 1.0 | 1.0 | 724 | $1,725 | $2.38 | 43d | 1 | 0.57mi |
| 7709 Broadway San Antonio, TX | 1.0 | 1.0 | 816 | $1,200 | $1.47 | 23d | 1 | 0.57mi |
| 7709 Broadway #123 San Antonio, TX | 1.0 | 1.0 | 816 | $1,100 | $1.35 | 21d | 1 | 0.57mi |
| 7709 Broadway #323 San Antonio, TX | 1.0 | 1.0 | 862 | $1,500 | $1.74 | 43d | 1 | 0.57mi |
| 390 Treeline Park San Antonio, TX | 1.0 | 1.0 | 712 | $1,145 | $1.61 | 43d | 1 | 0.58mi |
| 250 Treeline Park Unit 3213 San Antonio, TX | 3.0 | 2.0 | 1445 | $2,505 | $1.73 | 2d | 1 | 0.58mi |
| 250 Treeline Park Apt 710 San Antonio, TX | 2.0 | 2.0 | 1144 | $1,879 | $1.64 | 2d | 1 | 0.58mi |
| 250 Treeline Park Apt 610 San Antonio, TX | 1.0 | 1.0 | 834 | $1,459 | $1.75 | 2d | 1 | 0.58mi |
| 7707 Broadway San Antonio, TX | 2.0 | 2.0 | 1170 | $1,995 | $1.71 | 2d | 1 | 0.59mi |
| 7707 Broadway Unit 12 San Antonio, TX | 2.0 | 1.0 | 866 | $1,400 | $1.62 | 4d | 1 | 0.59mi |
HOA detail condo
- Monthly dues
- $0 · $0/yr
- Likely covers
- pool
- Assessments
- None detected in remarks — confirm with the listing agent.
Listing history 25 events
-
2026-06-18days on market $145,000 Active 21 DOM
-
2026-06-17days on market $145,000 Active 20 DOM
-
2026-06-16days on market $145,000 Active 19 DOM
-
2026-06-15days on market $145,000 Active 18 DOM
-
2026-06-13days on market $145,000 Active 16 DOM
-
2026-06-09days on market $145,000 Active 12 DOM
-
2026-06-08days on market $145,000 Active 11 DOM
-
2026-06-07days on market $145,000 Active 10 DOM
-
2026-06-04days on market $145,000 Active 7 DOM
-
2026-06-03days on market $145,000 Active 6 DOM
-
2026-06-02days on market $145,000 Active 5 DOM
-
2026-06-01days on market $145,000 Active 4 DOM
-
2026-05-31days on market $145,000 Active 3 DOM
-
2026-05-29$145,000 Active
-
2026-05-28$1,325
-
2025-04-25historical $1,275
-
2025-04-04price $1,275
-
2025-03-20$1,295
-
2024-10-12historical $1,150
-
2024-04-10$1,150
-
2019-04-18soldstatus
-
2014-01-10soldstatus
-
2010-04-15soldstatus
-
2000-10-09soldstatus
-
1999-07-09soldstatus
ⓘ Source: listings_history table (triggers on properties + properties_extension) + one-shot
backfill from property_details.listing_events for pre-trigger history.
Tax reassessment forecast TX · Resets to sale price
- Current annual tax
- $3,840 · $320/mo
- Projected year-2 tax
- $3,840 · $320/mo
- Expected delta
- $0/yr ($0/mo · 0.0%)
ⓘ Screening estimate from a state-policy table — verify with the county assessor before closing.
Climate risk First Street
- Flood 1/10 Low FEMA zone X (unshaded) · 0% chance over 30 yrs
- Wildfire 1/10 Low
- Heat 8/10 Severe 7 d/yr ≥108°F today · 22 d/yr by 30 yrs out
- Wind 6/10 Major 77% chance of damaging wind over 30 yrs
- Air quality 2/10 Low 1 unhealthy d/yr today · 1 by 30 yrs out
Nearby sold comps map
Loading sold comps map…
Walkable amenities ~0.75 mi
Loading nearby amenities…
Taxation est. · year 1
- Rental income
- $19,789
- − Mortgage interest
- −$8,122
- − Property taxes
- −$3,840
- − Insurance
- −$725
- − Repairs & maintenance
- −$1,583
- − Management
- −$1,583
- − HOA
- −$5,520
- − Depreciation
- −$4,218
- Taxable loss
- −$5,803
- Est. tax savings @ 24.0%
- +$1,393
- After-tax cash flow
- $-2,184/yr
For passive investors: Depreciation is non-cash, so a rental often shows a tax loss while cash-flowing — sheltering income. Rental losses are passive: they offset passive income freely, and up to $25,000/yr can offset ordinary (W-2) income if you actively participate and your MAGI is under $100k (phasing out to $0 by $150k); unused losses carry forward. On sale, claimed depreciation is recaptured at up to 25%, and gains may owe capital-gains tax (a 1031 exchange can defer both). Figures are a year-1 estimate at your 24.0% rate — not tax advice; consult a CPA.
Schools (NCES district)
- District
- Alamo Heights ISD
- NCES district ID
- 4807590
- Math proficiency
- 52% ▼ -9.00%
- Reading proficiency
- 60% ▼ -3.00%
- Median HH income
- $78,337
- Composite
- 50.44/100
- National rank
- #1865
- State rank
- #73 of 826 in TX
Livability — San Antonio
- Score
- 80/100
- State rank
- #31
- US rank
- #1616
Category grades
Schools grade is shown separately in the Schools card above.
Census & demographics
- Census place
- San Antonio, TX
- County
- Bexar County · 1,990,555 people
- City population
- 1,806,925
- Metro
- San Antonio-New Braunfels, TX
- Population (ZIP)
- 43,400
- Household income
- $86,514
- Rent vs Own
- Severe rent burden
- 1480.0
Population outlook (Bexar County) Hauer SSP2
- Today (2025)
- 2,336,851 people
- By 2030
- 2,560,728 · +9.6%
- By 2040
- 3,020,569 · +29.3%
- By 2050
- 3,493,522 · +49.5%
- By 2075
- 4,668,459 · +99.8%
- By 2100
- 5,533,242 · +136.8%
Race, ethnicity, and origin ACS 2023
- Neighborhood character
- Diverse neighborhood (Simpson 0.56)
- Race & ethnicity
- White 59% Hispanic / Latino 30% Two or more races 19% Black 4% Asian 3%
- Hispanic origin (detail)
- Mexican 25%
- Common ancestry
- Slovak 3% Lithuanian 2% Romanian 2%
- Foreign-born
- 9% · Canada, South Korea
- Languages at home
- 79% English-only · Spanish 17% Other Indo-European 2% Tagalog/Filipino 0%
Political lean MEDSL · Bexar
- 2024 margin
- Lean D (+9.8) · D 54.3% · R 44.6% · Other 1.1%
- 2008→2024 swing
- +4.2pp toward D · 2008: 5.6pp · 2024: 9.8pp
- All cycles
- 2024: D+9.8 2020: D+18.2 2016: D+13.5 2012: D+4.6 2008: D+5.6
Not yet ingested
- Civics
- —
Market trends
- HPI YoY
- ▼ -386.19%
- Current HPI
- 251.5759
- Rent YoY
- ▼ -1.04%
- Metro
- San Antonio-New Braunfels, TX
- State GDP YoY
- ▲ 3.95%
- F500 in state
- 110
Industry mix (Fortune 500 HQ in TX)
| Industry | F500 HQs | Revenue |
|---|---|---|
| Energy | 16 | $1,198B |
|
||
| Technology | 5 | $198B |
|
||
| Engineering / Construction | 4 | $72B |
|
||
| Energy Services | 3 | $60B |
|
||
| Utilities | 3 | $41B |
|
||
| Healthcare | 2 | $330B |
|
||
Price history
+12508.7% since first listed12 events — show timeline
- 2026-05-29 Listed $145,000 FSBO.com
- 2026-05-28 Listed for Rent $1,325 SHOWMOJO
- 2025-04-25 Rental Removed $1,275 SHOWMOJO
- 2025-04-04 Price Changed $1,275 SHOWMOJO
- 2025-03-20 Listed for Rent $1,295 SHOWMOJO
- 2024-10-12 Rental Removed $1,150 APPFOLIO
- 2024-04-10 Listed for Rent $1,150 APPFOLIO
- 2019-04-18 Sold (Public Records) — Public Records
- 2014-01-10 Sold (Public Records) — Public Records
- 2010-04-15 Sold (Public Records) — Public Records
- 2000-10-09 Sold (Public Records) — Public Records
- 1999-07-09 Sold (Public Records) — Public Records
Property tax history
+7.3%/yrLatest (2025): $3,840 · -0.4% YoY. Source: county tax records.
Cash-flow waterfall
monthlySold comps — $/sqft
last 12 mo · ≤1 miLoading sold comps…