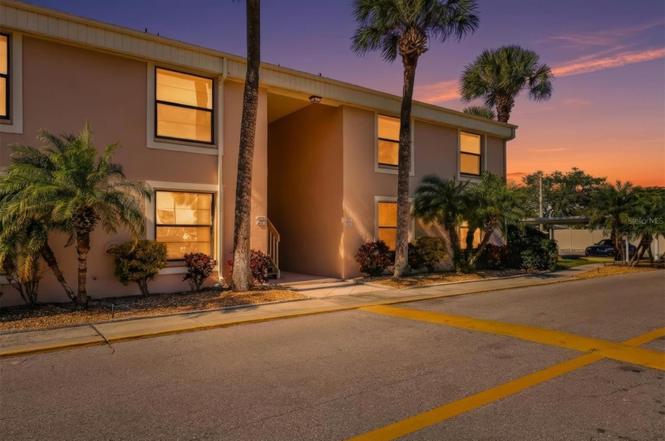
6343 Manatee Ave W · Bradenton, FL
Flood risk 1/10 · Minimal
- FEMA flood zone
- X (unshaded)
- Chance of flooding over 30 yrs
- 0.0%
- Est. flood insurance / yr
- $507 – $1,088
Fire risk 1/10 · Minimal
- Est. fire insurance / yr
- $947 – $1,759
Heat risk 10/10 · Severe
- Hot days now (above 107°F)
- 7 days/yr
- Hot days in 30 yrs
- 30 days/yr
Wind risk 10/10 · Severe
- Chance of severe wind over 30 yrs
- 99.0%
Air-quality risk 3/10 · Minor
- Unhealthy air days now
- 2 days/yr
- Unhealthy air days in 30 yrs
- 2 days/yr
Risk factors via First Street. Map © Google.
Why this score? — see what drove the C+ grade
The composite is a weighted blend of 9 inputs, each scored 0–100. Each bar is that input's sub-score; the figure is the points it added to the 100-point composite (weight × sub-score).
- Cash flow +24.0/30.0
- 1% rule +10.0/10.0
- DSCR +7.7/10.0
- ARV discount +7.5/15.0
- Schools +4.4/10.0
- Livability +4.0/5.0
- Condition / age +2.5/5.0
- Rent growth +2.4/5.0
- Appreciation +0.0/10.0
$115,000
🖨 Deal sheet 📄 Offer letter ✓ Due diligence
Listing remarks MLS
Located in desirable Cluster VI - very pretty unit! Entire condo has been gone over - Brand new carpet and tile throughout - completely repainted in soft neutral tones - all work professionally done - largest 2/2 floorplan available - shows fantastically!Perfect for year round residence- good for all ages- or winter retreat for Northern visitors! Poss. owner financing.
Key facts
- Updated condo
- Screened balcony
- Clubhouse pool
Tags
Neighborhood map
What this means for you Summary
Snapshot
- This is a 2-bed/2.0-bath condo listed at $115k.
Deal economics
- At list price, monthly cash flow is $226 ($3k/yr) — positive.
- The deal already cash-flows at list — no discount required.
- Meets the 1% rule at list price ($2k rent vs $115k).
- Recommended offer: $112k (3.0% below list) — sets the bar for market timing.
- Cap rate 8.6% vs local median 3.6% in Bradenton — top-decile yield for the area; either an underpriced asset or a hidden risk that comps aren't pricing in. Stress-test before assuming the spread holds.
Location & tenants
- Location reads 81/100 on livability (#101 in FL, #1,528 nationally) — a professional / high-income tenant draw. Strengths: commute A+, cost of living A+, housing A+; Watch: employment D+, crime D, amenities F.
- Manatee (suburban): math 54% / reading 50% proficiency, ranked #26 of 73 in FL (top 36%) — acceptable for families but not a draw, mixed tenant base, ~2y average lease.
- Market conditions: Rents soft (-0.3%/yr); 510 active listings in the ZIP; 30 comparable units currently listed for rent nearby; rentals at typical pace (median 16d on market — plan ~3-4 weeks tenant-placement turnaround); solid renter incomes; 7,472 units permitted in Manatee County in 2024 (1,782 in 5+ unit buildings).
- This rent runs 33% of the median local income ($82k/yr) — at the standard rent-burdened threshold; future hikes will face affordability resistance.
Forward outlook
- Local home prices are declining (-3.0%/yr); year-one equity from $795 of loan paydown is wiped out by about $3k of value loss. Plan a longer hold.
- Manatee County population projected at +43% by 2050 — long-run rental-demand tailwind backs the buy-and-hold thesis.
Negotiation context
- It's been on market 44 days — a 3% lower offer ($112k) is reasonable based on typical stale-listing flexibility.
- 2 sale attempts since 20y ago; this cycle's ask has dropped $20k (15%) from the opening price — seller is motivated, your offer sets the floor, not the list.
Risks & watch-outs
- Watch-outs: HOA is 31% of rent.
- Climate carrying-cost: severe wind risk, 99% chance of damaging wind over 30y; extreme-heat days projected 7→30/yr by 2055 (HVAC capex compounding) — expect insurance premiums to compound above CPI over the hold.
Questions for the listing agent
- It's been on market 44 days. Have you received any prior offers? Is the seller open to a 3% concession, seller financing, or rate buy-down credit?
- Built in 1979 — when were the roof, HVAC, electrical panel, plumbing, and water heater last replaced?
- What does the HOA fee cover, when was the last increase, and are there any pending special assessments or reserve-fund shortfalls?
- Any open or pending special assessments — roof, HVAC, plumbing, elevator, façade? What's the per-unit balance and payoff schedule, and is the seller paying it off at close or rolling it to the buyer?
- Is there a deadline driving the sale (1031 exchange, divorce, estate, relocation)? That informs how much negotiation room exists.
- Crime grade is D in this area — have there been break-ins, vandalism, or insurance claims at this property in the last 3 years? What carrier currently insures it and at what premium?
- What's the average days-on-market for RENTAL listings here right now (not sales)? A rising rental-DOM trend means longer vacancies and softer asking-rent achievability than the comps imply.
- What's the recent tenant-quality profile in this submarket — average credit score on applications, eviction rate, late-payment / NSF rate, and stable-employment percentage? A property-management company in the area should have these aggregated.
- How much new apartment / multifamily construction is in the pipeline within 1–3 miles? Heavy new supply (>2% of stock underway) typically softens rents 12–24 months out; light construction supports rent growth.
Investment metrics
- 1% rule
- 1.94% ✓
- Cap rate
- 8.65%
- Cash-on-cash
- 8.41%
- DSCR
- 1.37
- GRM
- 4.3
CMA / ARV
No comps found within radius.
Projected returns pro-forma
-3.0% appreciation · 0.0% rent growth · sell at horizon
- IRR
- -9.2%
- Equity multiple
- 0.68×
- Total profit
- $-10,312
- Equity at exit
- $17,147
- IRR
- -9.1%
- Equity multiple
- 0.57×
- Total profit
- $-13,736
- Equity at exit
- $9,943
Cash invested: $32,200 (down + closing). Projections, not guarantees.
Landlord ↔ Tenant lean methodology
- Overall (STATE)
- 87 Strongly Landlord-Friendly
- State Florida
- 87 Strongly Landlord-Friendly · R+3
- County
- — inherits STATE
- City
- — inherits STATE
ZIP-level market 34209
- Rents YoY
- -0.3%
- Active inventory
- 510
- Price-to-rent
- 4.3×
Monthly cashflow live
- Estimated rent
- $2,228 high interval (Pro) →
- Mortgage (P&I)
- −$603
- Tax from tax record
- −$187 /mo · $2,242/yr
- Insurance
- −$48
- HOA
- −$697
- Vacancy / Maint / Mgmt
- −$468
- Net cashflow
- $226
Break-even live
UW: 25.0% down · 7.5% · 30yr · 1.5% tax · 5.0% vac · 8.0% maint · 8.0% mgmt
Financing live
Cash to close
- Down payment
- $28,750
- Closing costs
- $3,450
- Reserves months
- —
- Total cash needed
- —
Loan-product check · same deal, 3 products live
Conventional
25% down · 7.5% · 30yr
- Down + closing
- —
- Monthly P&I
- —
- Monthly cashflow
- —
- DSCR
- —
- Eligible?
- —
Personal DTI + credit; lowest rate.
DSCR
20% down · 8.5% · 30yr
- Down + closing
- —
- Monthly P&I
- —
- Monthly cashflow
- —
- DSCR
- —
- Eligible?
- —
No personal income docs; deal must DSCR.
Hard money
10% down · 12.0% · 12mo
- Down + closing
- —
- Monthly P&I
- —
- Monthly cashflow
- —
- DSCR
- —
- Eligible?
- —
Short-term bridge; refi at stabilization.
Rent comps 30 comps
| Address | Beds | Baths | Sqft | Rent | $/sqft | DOM | Units | Dist |
|---|---|---|---|---|---|---|---|---|
| 6102 7th Ave W Unit 6102 Bradenton, FL | 2.0 | 2.0 | 1050 | $2,600 | $2.48 | 24d | 1 | 0.20mi |
| 6306 7th Ave W Bradenton, FL | 3.0 | 2.0 | 984 | $1,800 | $1.83 | 16d | 1 | 0.20mi |
| 6318 7th Ave W Unit None Bradenton, FL | 2.0 | 2.0 | 1025 | $2,000 | $1.95 | 24d | 1 | 0.20mi |
| 6318 7th Ave W Bradenton, FL | 2.0 | 2.0 | 1025 | $1,800 | $1.76 | 24d | 1 | 0.20mi |
| 6448 7th Avenue Cir W Bradenton, FL | 3.0 | 2.0 | 1482 | $3,100 | $2.09 | 24d | 1 | 0.20mi |
| 6446 7th Avenue Cir W Unit 6446 Bradenton, FL | 2.0 | 2.0 | 1440 | $2,400 | $1.67 | 24d | 1 | 0.22mi |
| 6618 7th Ave Cir W #1404 Bradenton, FL | 2.0 | 2.0 | 1440 | $3,400 | $2.36 | 24d | 1 | 0.23mi |
| 6646 7th Avenue Cir W Bradenton, FL | 2.0 | 2.0 | 1440 | $2,500 | $1.74 | 24d | 1 | 0.24mi |
| 6652 7th Avenue Cir W Bradenton, FL | 3.0 | 2.0 | 1495 | $2,800 | $1.87 | 14d | 1 | 0.27mi |
| 5513 3rd Avenue Plz W Bradenton, FL | 3.0 | 2.0 | 1282 | $2,019 | $1.57 | 3d | 1 | 0.45mi |
| 6904 Manatee Ave W Bradenton, FL | 1.0–3.0 | 1.0–2.0 | 1068 | $1,678 | $1.57 | 2d | 76 | 0.50mi |
| 1225 56th St W Bradenton, FL | 2.0 | 2.0 | 1222 | $1,800 | $1.47 | 3d | 1 | 0.63mi |
| 109 53rd St W Bradenton, FL | 3.0 | 2.5 | 1492 | $2,700 | $1.81 | 24d | 1 | 0.67mi |
| 1403 56th St W Bradenton, FL | 1.0 | 1.0 | 812 | $1,445 | $1.78 | 16d | 1 | 0.68mi |
| 1403 56th St W #1403 Bradenton, FL | 1.0 | 1.0 | 812 | $1,595 | $1.96 | 24d | 1 | 0.69mi |
| 5132 1st Ave W Bradenton, FL | 3.0 | 2.0 | 1249 | $2,500 | $2.00 | 16d | 1 | 0.72mi |
| 5008 Manatee Ave W Unit 1 Bradenton, FL | 1.0 | 1.0 | 875 | $1,000 | $1.14 | 24d | 1 | 0.78mi |
| 7507 4th Ave W Unit 1546087P Bradenton, FL | 3.0 | 2.0 | 1474 | $2,258 | $1.53 | 16d | 1 | 0.82mi |
| 6415 21st Ave W Bradenton, FL | 1.0–2.0 | 1.0–2.0 | 1150 | $1,896 | $1.65 | 3d | 5 | 0.99mi |
| 6914 20th Ave W Bradenton, FL | 2.0 | 2.0 | 1383 | $2,795 | $2.02 | 16d | 1 | 1.02mi |
| 6304 Pointe West Blvd Unit A309 Bradenton, FL | 2.0 | 2.0 | 1042 | $1,795 | $1.72 | 10d | 1 | 1.03mi |
| 4607 7th Ave W Bradenton, FL | 3.0 | 1.0 | 1296 | $1,950 | $1.50 | 24d | 1 | 1.03mi |
| 6817 11th Ave NW Bradenton, FL | 3.0 | 2.0 | 1308 | $3,200 | $2.45 | 24d | 1 | 1.04mi |
| 202 46th St W Unit 207 Bradenton, FL | 2.0 | 2.0 | 951 | $1,800 | $1.89 | 16d | 1 | 1.07mi |
| 5933 28th Ave W Bradenton, FL | 1.0–2.0 | 1.0–2.0 | 945 | $2,013 | $2.13 | 2d | 6 | 1.27mi |
| 2724 72nd St W Unit 2010 Bradenton, FL | 2.0 | 2.0 | 942 | $1,950 | $2.07 | 3d | 1 | 1.43mi |
| 2926 63rd St W Bradenton, FL | 2.0 | 2.0 | 946 | $2,100 | $2.22 | 3d | 1 | 1.43mi |
| 2107 Palma Sola Blvd #8 Bradenton, FL | 2.0 | 2.0 | 1056 | $1,850 | $1.75 | 16d | 1 | 1.45mi |
| 2914 64th St W Bradenton, FL | 2.0 | 2.0 | 1135 | $2,025 | $1.78 | 24d | 1 | 1.46mi |
| 2727 75th St W Bradenton, FL | 1.0–2.0 | 1.5 | 835 | $1,700 | $2.04 | 3d | 4 | 1.48mi |
HOA detail condo
- Monthly dues
- $697 · $8,364/yr
- Assessments
- None detected in remarks — confirm with the listing agent.
Listing history 14 events
-
2026-05-15status Pending
-
2026-03-06status Pending
-
2026-03-03historical
-
2026-02-26price $115,000
-
2026-02-16price $125,000
-
2026-01-30price $130,000
-
2026-01-21$135,000 Active
-
2023-09-29soldstatus $222,000
-
2006-03-20soldstatus $157,900
-
2006-03-17soldstatus $157,900 372-char remark
Show marketing remark (372 chars)
Located in desirable Cluster VI - very pretty unit! Entire condo has been gone over - Brand new carpet and tile throughout - completely repainted in soft neutral tones - all work professionally done - largest 2/2 floorplan available - shows fantastically!Perfect for year round residence- good for all ages- or winter retreat for Northern visitors! Poss. owner financing.
-
2006-01-30$158,900 372-char remark
Show marketing remark (372 chars)
Located in desirable Cluster VI - very pretty unit! Entire condo has been gone over - Brand new carpet and tile throughout - completely repainted in soft neutral tones - all work professionally done - largest 2/2 floorplan available - shows fantastically!Perfect for year round residence- good for all ages- or winter retreat for Northern visitors! Poss. owner financing.
-
2005-12-23soldstatus $130,000
-
2002-08-01soldstatus $74,000
-
1997-05-16soldstatus $43,000
ⓘ Source: listings_history table (triggers on properties + properties_extension) + one-shot
backfill from property_details.listing_events for pre-trigger history.
Tax reassessment forecast FL · Resets to sale price
- Current annual tax
- $2,242 · $187/mo
- Projected year-2 tax
- $2,242 · $187/mo
- Expected delta
- $0/yr ($0/mo · 0.0%)
ⓘ Screening estimate from a state-policy table — verify with the county assessor before closing.
Climate risk First Street
- Flood 1/10 Low FEMA zone X (unshaded) · 0% chance over 30 yrs
- Wildfire 1/10 Low
- Heat 10/10 Extreme 7 d/yr ≥107°F today · 30 d/yr by 30 yrs out
- Wind 10/10 Extreme 99% chance of damaging wind over 30 yrs
- Air quality 3/10 Moderate 2 unhealthy d/yr today · 2 by 30 yrs out
Nearby sold comps map
Loading sold comps map…
Walkable amenities ~0.75 mi
Loading nearby amenities…
Taxation est. · year 1
- Rental income
- $26,739
- − Mortgage interest
- −$6,442
- − Property taxes
- −$2,242
- − Insurance
- −$575
- − Repairs & maintenance
- −$2,139
- − Management
- −$2,139
- − HOA
- −$8,364
- − Depreciation
- −$3,345
- Taxable income
- $1,493
- Est. tax owed @ 24.0%
- −$358
- After-tax cash flow
- $2,348/yr
For passive investors: Depreciation is non-cash, so a rental often shows a tax loss while cash-flowing — sheltering income. Rental losses are passive: they offset passive income freely, and up to $25,000/yr can offset ordinary (W-2) income if you actively participate and your MAGI is under $100k (phasing out to $0 by $150k); unused losses carry forward. On sale, claimed depreciation is recaptured at up to 25%, and gains may owe capital-gains tax (a 1031 exchange can defer both). Figures are a year-1 estimate at your 24.0% rate — not tax advice; consult a CPA.
Schools (NCES district)
- District
- Manatee
- NCES district ID
- 1201230
- Math proficiency
- 54% ▼ -6.00%
- Reading proficiency
- 50% ▼ -2.00%
- Median HH income
- $49,607
- Composite
- 44.43/100
- National rank
- #2806
- State rank
- #26 of 73 in FL
Livability — Bradenton
- Score
- 81/100
- State rank
- #101
- US rank
- #1528
Category grades
Schools grade is shown separately in the Schools card above.
Census & demographics
- County
- Manatee County · 416,364 people
- City population
- 227,091
- Metro
- North Port-Sarasota-Bradenton, FL
- Population (ZIP)
- 33,224
- Household income
- $81,728
- Rent vs Own
- Severe rent burden
- 1126.0
Population outlook (Manatee County) Hauer SSP2
- Today (2025)
- 447,342 people
- By 2030
- 488,911 · +9.3%
- By 2040
- 567,934 · +27.0%
- By 2050
- 637,995 · +42.6%
- By 2075
- 781,970 · +74.8%
- By 2100
- 848,272 · +89.6%
Race, ethnicity, and origin ACS 2023
- Neighborhood character
- Predominantly White (84%)
- Race & ethnicity
- White 84% Hispanic / Latino 11% Two or more races 6% Black 2% Asian 1%
- Hispanic origin (detail)
- Puerto Rican 4% Cuban 3%
- Common ancestry
- Romanian 3% Slovak 3% Lithuanian 3%
- Foreign-born
- 9% · Canada, Jamaica, China
- Languages at home
- 90% English-only · Spanish 6% Russian/Polish/Slavic 1% Other Indo-European 1%
Political lean MEDSL · Manatee
- 2024 margin
- Strong R (+23.5) · D 37.9% · R 61.4%
- 2008→2024 swing
- -16.5pp toward R · 2008: -7.0pp · 2024: -23.5pp
- All cycles
- 2024: R+23.5 2020: R+16.1 2016: R+17.1 2012: R+12.5 2008: R+7.0
Not yet ingested
- Civics
- —
Market trends
- HPI YoY
- ▼ -360.34%
- Current HPI
- 320.0061
- Rent YoY
- ▼ -0.30%
- Metro
- North Port-Sarasota-Bradenton, FL
- State GDP YoY
- ▲ 3.28%
- F500 in state
- 36
Industry mix (Fortune 500 HQ in FL)
| Industry | F500 HQs | Revenue |
|---|---|---|
| Industrial Technology | 2 | $29B |
|
||
| Insurance | 2 | $17B |
|
||
| Retail | 1 | $60B |
|
||
| Technology Distribution | 1 | $58B |
|
||
| Homebuilding | 1 | $35B |
|
||
| Technology Manufacturing | 1 | $35B |
|
||
Price history
+167.4% since first listed14 events — show timeline
- 2026-05-15 Pending — Stellar MLS as Distributed by MLS Grid
- 2026-03-06 Pending — Stellar MLS as Distributed by MLS Grid
- 2026-03-03 Listing Removed — Stellar MLS as Distributed by MLS Grid
- 2026-02-26 Price Changed $115,000 Stellar MLS as Distributed by MLS Grid
- 2026-02-16 Price Changed $125,000 Stellar MLS as Distributed by MLS Grid
- 2026-01-30 Price Changed $130,000 Stellar MLS as Distributed by MLS Grid
- 2026-01-21 Listed $135,000 Stellar MLS as Distributed by MLS Grid
- 2023-09-29 Sold (Public Records) $222,000 Public Records
- 2006-03-20 Sold (Public Records) $157,900 Public Records
- 2006-03-17 Sold (MLS) $157,900 Stellar MLS as Distributed by MLS Grid
- 2006-01-30 Listed $158,900 Stellar MLS as Distributed by MLS Grid
- 2005-12-23 Sold (Public Records) $130,000 Public Records
- 2002-08-01 Sold (Public Records) $74,000 Public Records
- 1997-05-16 Sold (Public Records) $43,000 Public Records
Property tax history
+9.4%/yrLatest (2025): $2,242 · -8.0% YoY. Source: county tax records.
Cash-flow waterfall
monthlySold comps — $/sqft
last 12 mo · ≤1 miLoading sold comps…