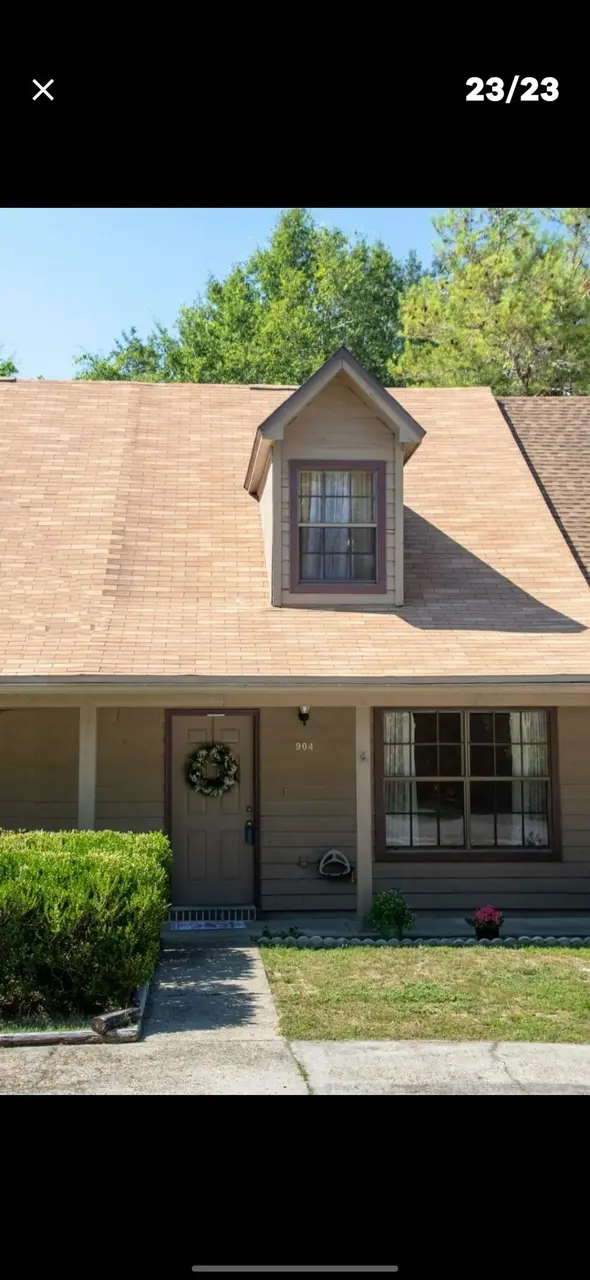
904 48th St · Niceville, FL
Flood risk 1/10 · Minimal
- FEMA flood zone
- X (unshaded)
- Chance of flooding over 30 yrs
- 0.0%
- Est. flood insurance / yr
- $507 – $1,088
Fire risk 2/10 · Minimal
- Est. fire insurance / yr
- $947 – $1,759
Heat risk 10/10 · Severe
- Hot days now (above 104°F)
- 7 days/yr
- Hot days in 30 yrs
- 22 days/yr
Wind risk 9/10 · Severe
- Chance of severe wind over 30 yrs
- 99.0%
Air-quality risk 1/10 · Minimal
- Unhealthy air days now
- 0 days/yr
- Unhealthy air days in 30 yrs
- 0 days/yr
Risk factors via First Street. Map © Google.
Why this score? — see what drove the D- grade
The composite is a weighted blend of 9 inputs, each scored 0–100. Each bar is that input's sub-score; the figure is the points it added to the 100-point composite (weight × sub-score).
- Cash flow +12.2/30.0
- ARV discount +6.0/15.0
- Schools +5.2/10.0
- Livability +4.0/5.0
- DSCR +3.6/10.0
- 1% rule +3.5/10.0
- Rent growth +2.4/5.0
- Condition / age +2.2/5.0
- Appreciation +0.0/10.0
$200,000
🖨 Deal sheet (PDF) 📄 Offer letter ✓ Due diligence
Listing remarks MLS
For sale by owner 2br 1.5ba townhouse in niceville walking distance from college and children's park. Buyer pays all closing fees . Small back yard with privacy fence. Large attack for storage inside bedroom closet upstairs and under stairs as well. .stainless steel appliances in kitchen (fridge, flat top stove, microwave, dishwasher) large living area hardwood flooring downstairs carpet on stairs and in bedrooms
Key facts
- Built 1982
- Listed 162 days
Neighborhood map
What this means for you Summary
Snapshot
- This is a 2-bed/1.5-bath townhouse listed at $200k. Condition is rated fair.
Deal economics
- At list price, monthly cash flow is $-41 ($-493/yr) — negative.
- To cash-flow at today's rent, offer at most $194k (3.0% below list).
- To meet the 1% rule (rent ≥ 1% of price), the offer needs to be $170k (15.1% below list).
- Recommended offer: $170k (15.1% below list) — sets the bar for 1% rule.
- Cap rate 6.0% vs local median 3.0% in Niceville — top-decile yield for the area; either an underpriced asset or a hidden risk that comps aren't pricing in. Stress-test before assuming the spread holds.
Location & tenants
- Location reads 79/100 on livability (#147 in FL, #2,207 nationally) — a middle-class / working-renter tenant base. Strengths: schools A+, employment A+, housing A+; Watch: amenities F, commute F.
- Okaloosa (other): math 60% / reading 60% proficiency, ranked #12 of 73 in FL (top 16%) — acceptable for families but not a draw, mixed tenant base, ~2y average lease.
- Market conditions: Rents soft (-0.4%/yr); 340 active listings in the ZIP; 8 comparable units currently listed for rent nearby; rentals lingering (median 45d on market — plan ~5-8 weeks vacancy on turnover, expect pricing pressure); 62% of comp listings sitting > 30 days — soft ceiling on asking rent; solid renter incomes; 1,268 units permitted in Okaloosa County in 2024 (175 in 5+ unit buildings).
Forward outlook
- Local home prices are declining (-3.0%/yr); year-one equity from $1k of loan paydown is wiped out by about $6k of value loss. Plan a longer hold.
- Okaloosa County population projected at +37% by 2050 — long-run rental-demand tailwind backs the buy-and-hold thesis.
Negotiation context
- It's been on market 162 days — a 12% lower offer ($176k) is reasonable based on typical stale-listing flexibility.
Risks & watch-outs
- Climate carrying-cost: severe wind risk, 99% chance of damaging wind over 30y; extreme-heat days projected 7→22/yr by 2055 (HVAC capex compounding) — expect insurance premiums to compound above CPI over the hold.
Questions for the listing agent
- What do current leases actually rent for vs. the listed asking? Can we see a recent rent roll and the last 12 months of T-12 income?
- It's been on market 162 days. Have you received any prior offers? Is the seller open to a 15% concession, seller financing, or rate buy-down credit?
- Have any recent inspections been done? Can we get a copy of the seller's disclosures and any deferred-maintenance estimates?
- Why hasn't it sold? Are there any deal-killer items the seller is aware of (foundation, flood, title, zoning, code violations)?
- Is there a deadline driving the sale (1031 exchange, divorce, estate, relocation)? That informs how much negotiation room exists.
- Schools are A-rated — typically a magnet for longer-tenancy family renters. What's the average tenant stay here, and is there a school-zone premium baked into asking?
- The area grade is low — what's the realistic commute time and amenity access for the typical tenant pool here? Any planned neighborhood developments (good or bad) we should know about?
- What's the average days-on-market for RENTAL listings here right now (not sales)? A rising rental-DOM trend means longer vacancies and softer asking-rent achievability than the comps imply.
- What's the recent tenant-quality profile in this submarket — average credit score on applications, eviction rate, late-payment / NSF rate, and stable-employment percentage? A property-management company in the area should have these aggregated.
- How much new for-sale + rental construction is in the pipeline within 1–3 miles? Heavy new supply typically softens prices + rents 12–24 months out; constrained supply supports both.
Investment metrics
- 1% rule
- 0.85% ✗
- Cap rate
- 6.05%
- Cash-on-cash
- -0.88%
- DSCR
- 0.96
- GRM
- 9.8
CMA / ARV
- ARV (median comp)
- $193,405
- List price
- $200,000
- Delta
- 3.41%
- Verdict
- FAIR
- Comps
- 20 within 1.0 mi
Show comp detail 2 sales within ~0.75 mi
| Address | Dist | Beds/Ba | Sqft | Sold | Price | $/sf | Match |
|---|---|---|---|---|---|---|---|
| 904 48th St #3 | 0.00mi | 2/1.5 | 1,308 (0%) | 1mo | $241,900 | $185 | 99 |
| 1501 N Partin Dr Apt 159 | 0.58mi | 3/2.0 (+1) | 1,250 (-4%) | 15mo | $242,500 | $194 | 46 |
Match score weights: distance 35% · size 25% · config 20% · recency 20%. Top-matched comps best support the ARV.
Projected returns pro-forma
-3.0% appreciation · 0.0% rent growth · sell at horizon
- IRR
- -21.2%
- Equity multiple
- 0.29×
- Total profit
- $-39,977
- Equity at exit
- $29,821
- IRR
- -23.7%
- Equity multiple
- -0.02×
- Total profit
- $-57,305
- Equity at exit
- $17,292
Cash invested: $56,000 (down + closing). Projections, not guarantees.
Landlord ↔ Tenant lean methodology
- Overall (STATE)
- 87 Strongly Landlord-Friendly
- State Florida
- 87 Strongly Landlord-Friendly · R+3
- County
- — inherits STATE
- City
- — inherits STATE
ZIP-level market 32578
- Home prices YoY
- -2.5%
- Rents YoY
- -0.4%
- Active inventory
- 340
- Price-to-rent
- 9.8×
Monthly cashflow live
- Estimated rent
- $1,698 high interval (Pro) →
- Mortgage (P&I)
- −$1,049
- Tax est. 1.5%
- −$250 /mo · $3,000/yr
- Insurance
- −$83
- HOA
- −$0
- Vacancy / Maint / Mgmt
- −$356
- Net cashflow
- $-41
Break-even live
Sensitivity live
| Price | -10% $97 | -5% $28 | +0% $-41 | +5% $-110 | +10% $-179 |
|---|---|---|---|---|---|
| Rent | -10% $-175 | -5% $-108 | +0% $-41 | +5% $26 | +10% $93 |
| Rate | -1.0pp $60 | -0.5pp $10 | base $-41 | +0.5pp $-93 | +1.0pp $-146 |
UW: 25.0% down · 7.5% · 30yr · 1.5% tax · 5.0% vac · 8.0% maint · 8.0% mgmt
Financing live
Cash to close
- Down payment
- $50,000
- Closing costs
- $6,000
- Reserves months
- —
- Total cash needed
- —
Loan-product check · same deal, 3 products live
Conventional
25% down · 7.5% · 30yr
- Down + closing
- —
- Monthly P&I
- —
- Monthly cashflow
- —
- DSCR
- —
- Eligible?
- —
Personal DTI + credit; lowest rate.
DSCR
20% down · 8.5% · 30yr
- Down + closing
- —
- Monthly P&I
- —
- Monthly cashflow
- —
- DSCR
- —
- Eligible?
- —
No personal income docs; deal must DSCR.
Hard money
10% down · 12.0% · 12mo
- Down + closing
- —
- Monthly P&I
- —
- Monthly cashflow
- —
- DSCR
- —
- Eligible?
- —
Short-term bridge; refi at stabilization.
Rent comps 8 comps
| Address | Beds | Baths | Sqft | Rent | $/sqft | DOM | Units | Dist |
|---|---|---|---|---|---|---|---|---|
| 700 Palm Blvd N Unit C Niceville, FL | 2.0 | 1.0 | 880 | $1,400 | $1.59 | 14d | 1 | 0.01mi |
| Hickory Ave Niceville, FL | 2.0 | 1.5 | 1030 | $1,475 | $1.43 | 44d | 1 | 0.27mi |
| 1145 46th St Unit B Niceville, FL | 3.0 | 1.5 | 1230 | $1,695 | $1.38 | 44d | 1 | 0.31mi |
| 1018 Alderwood Way Niceville, FL | 2.0 | 2.0 | 1086 | $1,700 | $1.57 | 14d | 1 | 0.40mi |
| 133 3rd St Unit B Niceville, FL | 2.0 | 1.0 | 915 | $1,425 | $1.56 | 44d | 1 | 0.73mi |
| 1038 37th St Niceville, FL | 3.0 | 3.0 | 1745 | $2,100 | $1.20 | 22d | 1 | 0.77mi |
| 203 John Sims Pkwy Unit F Niceville, FL | 2.0 | 1.0 | 900 | $1,295 | $1.44 | 44d | 1 | 1.27mi |
| 561 Bayshore Dr Unit 1 Niceville, FL | 2.0 | 2.0 | 1644 | $2,200 | $1.34 | 44d | 1 | 1.37mi |
Listing history 16 events
-
2026-06-18days on market $200,000 Active 162 DOM
-
2026-06-17days on market $200,000 Active 161 DOM
-
2026-06-16days on market $200,000 Active 160 DOM
-
2026-06-15days on market $200,000 Active 159 DOM
-
2026-06-14days on market $200,000 Active 157 DOM
-
2026-06-13days on market $200,000 Active 156 DOM
-
2026-06-10days on market $200,000 Active 154 DOM
-
2026-06-09days on market $200,000 Active 153 DOM
-
2026-06-08days on market $200,000 Active 152 DOM
-
2026-06-07days on market $200,000 Active 151 DOM
-
2026-06-05days on market $200,000 Active 148 DOM
-
2026-06-02days on market $200,000 Active 146 DOM
-
2026-06-01days on market $200,000 Active 145 DOM
-
2026-05-31days on market $200,000 Active 144 DOM
-
2026-05-30days on market $200,000 Active 143 DOM
-
2026-01-07$200,000 Active 416-char remark
Show marketing remark (416 chars)
For sale by owner 2br 1.5ba townhouse in niceville walking distance from college and children's park. Buyer pays all closing fees . Small back yard with privacy fence. Large attack for storage inside bedroom closet upstairs and under stairs as well. .stainless steel appliances in kitchen (fridge, flat top stove, microwave, dishwasher) large living area hardwood flooring downstairs carpet on stairs and in bedrooms
ⓘ Source: listings_history table (triggers on properties + properties_extension) + one-shot
backfill from property_details.listing_events for pre-trigger history.
Climate risk First Street
- Flood 1/10 Low FEMA zone X (unshaded) · 0% chance over 30 yrs
- Wildfire 2/10 Low
- Heat 10/10 Extreme 7 d/yr ≥104°F today · 22 d/yr by 30 yrs out
- Wind 9/10 Extreme 99% chance of damaging wind over 30 yrs
- Air quality 1/10 Low 0 unhealthy d/yr today · 0 by 30 yrs out
Nearby sold comps map
Loading sold comps map…
Walkable amenities ~0.75 mi
Loading nearby amenities…
Taxation est. · year 1
- Rental income
- $20,370
- − Mortgage interest
- −$11,203
- − Property taxes
- −$3,000
- − Insurance
- −$1,000
- − Repairs & maintenance
- −$1,630
- − Management
- −$1,630
- − Depreciation
- −$5,818
- Taxable loss
- −$3,910
- Est. tax savings @ 24.0%
- +$938
- After-tax cash flow
- $445/yr
For passive investors: Depreciation is non-cash, so a rental often shows a tax loss while cash-flowing — sheltering income. Rental losses are passive: they offset passive income freely, and up to $25,000/yr can offset ordinary (W-2) income if you actively participate and your MAGI is under $100k (phasing out to $0 by $150k); unused losses carry forward. On sale, claimed depreciation is recaptured at up to 25%, and gains may owe capital-gains tax (a 1031 exchange can defer both). Figures are a year-1 estimate at your 24.0% rate — not tax advice; consult a CPA.
Condition & rehab AI · 12 photos
This townhouse requires moderate renovations, focusing on painting and siding repairs, to improve its curb appeal and value.
Repairs flagged
- Major Paint — Paint appears faded and needs touch-up
- Moderate Siding — Some wear visible on exterior siding
Value-add opportunities
- Both Paint job — Fresh paint enhances curb appeal and interior aesthetics
- Both Siding repair — Repairing siding improves curb appeal and structural integrity
Renovation cost estimate screening
| Repair item | Severity | Est. cost |
|---|---|---|
| Paint · Paint appears faded and needs touch-up | Major | $15,000–50,000 |
| Siding · Some wear visible on exterior siding | Moderate | $3,000–15,000 |
| Total estimated repair cost · 2 items | $18,000–65,000 |
Value-add ROI direction
- Both Paint job — Fresh paint enhances curb appeal and interior aesthetics ↑
- Both Siding repair — Repairing siding improves curb appeal and structural integrity ↑
ⓘ Cost ranges are severity-bucket heuristics (US national rule-of-thumb). Get contractor quotes + a written scope before underwriting a rehab budget.
Schools (NCES district)
- District
- Okaloosa
- NCES district ID
- 1201380
- Math proficiency
- 60% ▼ -12.00%
- Reading proficiency
- 60% ▼ -4.00%
- Median HH income
- $55,601
- Composite
- 51.62/100
- National rank
- #1705
- State rank
- #12 of 73 in FL
Livability — Niceville
- Score
- 79/100
- State rank
- #147
- US rank
- #2207
Category grades
Schools grade is shown separately in the Schools card above.
Census & demographics
- Census place
- Niceville, FL
- County
- Okaloosa County · 194,352 people
- Metro
- Crestview-Fort Walton Beach-Destin, FL
- Population (ZIP)
- 34,738
- Household income
- $108,972
- Rent vs Own
- Severe rent burden
- 660.0
Population outlook (Okaloosa County) Hauer SSP2
- Today (2025)
- 235,133 people
- By 2030
- 253,483 · +7.8%
- By 2040
- 289,537 · +23.1%
- By 2050
- 322,954 · +37.3%
- By 2075
- 399,624 · +70.0%
- By 2100
- 425,311 · +80.9%
Race, ethnicity, and origin ACS 2023
- Neighborhood character
- Predominantly White (79%)
- Race & ethnicity
- White 79% Two or more races 9% Hispanic / Latino 8% Asian 4% Black 3%
- Hispanic origin (detail)
- Mexican 3% Puerto Rican 2%
- Common ancestry
- Slovak 3% Serbian 3% Lithuanian 2%
- Foreign-born
- 8% · Canada, Jamaica
- Languages at home
- 90% English-only · Spanish 5% Other Indo-European 1% Other Asian/Pacific 1%
Political lean MEDSL · Okaloosa
- 2024 margin
- Solid R (+42.4) · D 28.2% · R 70.7% · Other 1.1%
- 2008→2024 swing
- +2.5pp toward D · 2008: -44.9pp · 2024: -42.4pp
- All cycles
- 2024: R+42.4 2020: R+39.1 2016: R+47.8 2012: R+49.4 2008: R+44.9
Not yet ingested
- Civics
- —
Market trends
- HPI YoY
- ▼ -12.87%
- Current HPI
- 498.41
- Rent YoY
- ▼ -0.36%
- Metro
- Crestview-Fort Walton Beach-Destin, FL
- State GDP YoY
- ▲ 3.28%
- F500 in state
- 36
Industry mix (Fortune 500 HQ in FL)
| Industry | F500 HQs | Revenue |
|---|---|---|
| Industrial Technology | 2 | $29B |
|
||
| Insurance | 2 | $17B |
|
||
| Retail | 1 | $60B |
|
||
| Technology Distribution | 1 | $58B |
|
||
| Homebuilding | 1 | $35B |
|
||
| Technology Manufacturing | 1 | $35B |
|
||
Price history
1 event — show timeline
- 2026-01-07 Listed $200,000 ForSaleByOwner.com
Cash-flow waterfall
monthlySold comps — $/sqft
last 12 mo · ≤1 miLoading sold comps…