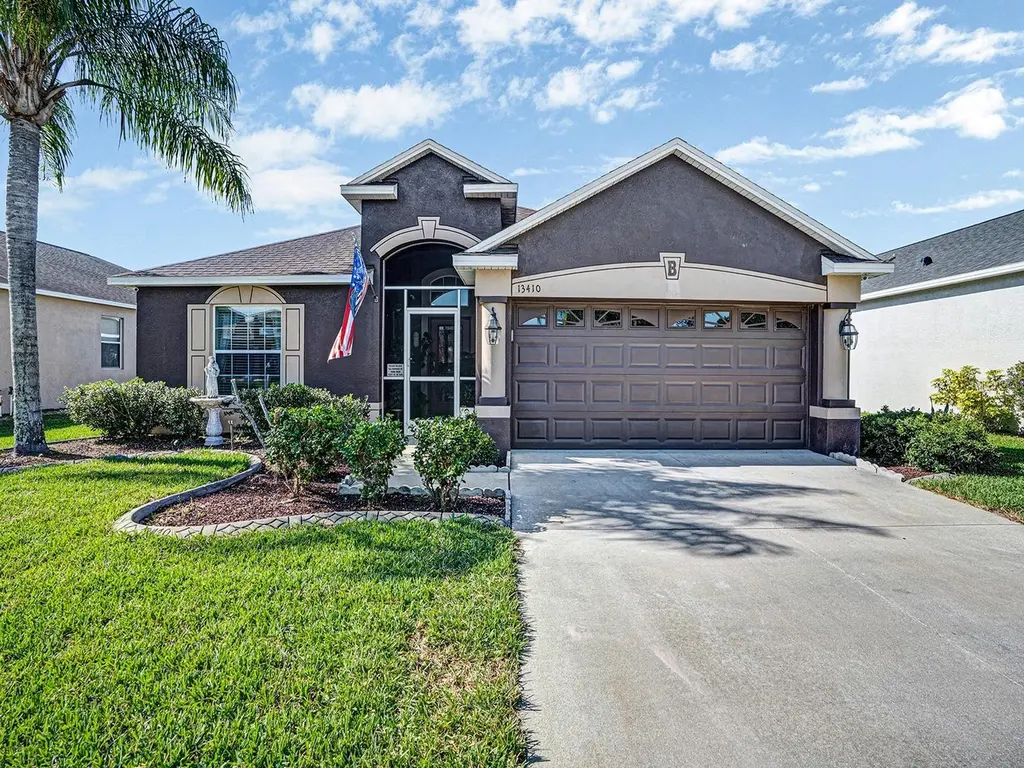
13410 Graham Yarden Dr · Riverview, FL
Flood risk No data
- FEMA flood zone
- —
- Chance of flooding over 30 yrs
- —
- Est. flood insurance / yr
- —
Fire risk No data
- Est. fire insurance / yr
- —
Heat risk No data
- Hot days now (above threshold)
- —
- Hot days in 30 yrs
- —
Wind risk No data
- Chance of severe wind over 30 yrs
- —
Air-quality risk No data
- Unhealthy air days now
- —
- Unhealthy air days in 30 yrs
- —
Risk factors via First Street. Map © Google.
Why this score? — see what drove the D grade
The composite is a weighted blend of 9 inputs, each scored 0–100. Each bar is that input's sub-score; the figure is the points it added to the 100-point composite (weight × sub-score).
- Cash flow +10.1/30.0
- ARV discount +7.5/15.0
- Appreciation +4.3/10.0
- Schools +4.2/10.0
- Livability +4.0/5.0
- DSCR +2.9/10.0
- Rent growth +2.8/5.0
- 1% rule +2.7/10.0
- Condition / age +2.5/5.0
$360,000
🖨 Deal sheet (PDF) 📄 Offer letter ✓ Due diligence
Listing remarks
Under contract-accepting backup offers. Welcome Home to a beautifully maintained 4-bedroom, 3-bathroom home with a spacious 2-car garage (Just built in 2011), offering comfort, upgrades, and serene water views. Step inside to an open and inviting layout featuring granite countertops throughout and Brand-New appliances that make the kitchen both stylish and functional. The home has been thoughtfully updated with modern conveniences, including a New Water Heater and a Water Softener system for added efficiency and peace of mind. The primary living spaces flow seamlessly to a screened-in patio overlooking a tranquil pond view—perfect for relaxing mornings or evening gatherings. The pati
Key facts
- Pond view
- Vinyl windows
- Screened-in patio
Tags
Neighborhood map
What this means for you Summary
Snapshot
- This is a 4-bed/3.0-bath single-family listed at $360k.
Deal economics
- At list price, monthly cash flow is $-212 ($-3k/yr) — negative.
- To cash-flow at today's rent, offer at most $323k (10.4% below list).
- To meet the 1% rule (rent ≥ 1% of price), the offer needs to be $276k (23.5% below list).
- Recommended offer: $276k (23.5% below list) — sets the bar for 1% rule.
Location & tenants
- Location reads 79/100 on livability (#134 in FL, #2,000 nationally) — a middle-class / working-renter tenant base. Strengths: housing A+, health & safety A+, employment B+; Watch: amenities F.
- Hillsborough (suburban): math 47% / reading 50% proficiency, ranked #41 of 73 in FL (top 56%) — families likely to look elsewhere, expect single-tenant / working-renter base with shorter leases.
- Zoned schools: Summerfield Crossings Elementary School (math 43% / reading 45%, grade F, #1,330 of 2,144 statewide, top 63%, 869 students, 53% FRL); East Bay High School (math 24% / reading 35%, grade F, #447 of 667 statewide, top 68%, 1,995 students, 51% FRL) — zoned schools at 52% FRL track the district average.
- Market conditions: Rents rising (+1.2%/yr); 463 active listings in the ZIP; 40 comparable units currently listed for rent nearby; rentals at typical pace (median 17d on market — plan ~3-4 weeks tenant-placement turnaround); high-income renter base; 9,053 units permitted in Hillsborough County in 2024 (4,555 in 5+ unit buildings).
Forward outlook
- Local home prices are declining (-1.4%/yr); year-one equity from $2k of loan paydown is wiped out by about $5k of value loss. Plan a longer hold.
- Hillsborough County population projected at +37% by 2050 — long-run rental-demand tailwind backs the buy-and-hold thesis.
Negotiation context
- Only 4 days on market — expect competitive offers; lowballing is unlikely to land.
Questions for the listing agent
- What do current leases actually rent for vs. the listed asking? Can we see a recent rent roll and the last 12 months of T-12 income?
- What does the HOA fee cover, when was the last increase, and are there any pending special assessments or reserve-fund shortfalls?
- Is there a deadline driving the sale (1031 exchange, divorce, estate, relocation)? That informs how much negotiation room exists.
- Schools are B-rated — typically a magnet for longer-tenancy family renters. What's the average tenant stay here, and is there a school-zone premium baked into asking?
- The area grade is low — what's the realistic commute time and amenity access for the typical tenant pool here? Any planned neighborhood developments (good or bad) we should know about?
- What's the average days-on-market for RENTAL listings here right now (not sales)? A rising rental-DOM trend means longer vacancies and softer asking-rent achievability than the comps imply.
- What's the recent tenant-quality profile in this submarket — average credit score on applications, eviction rate, late-payment / NSF rate, and stable-employment percentage? A property-management company in the area should have these aggregated.
- How much new for-sale + rental construction is in the pipeline within 1–3 miles? Heavy new supply typically softens prices + rents 12–24 months out; constrained supply supports both.
Investment metrics
- 1% rule
- 0.77% ✗
- Cap rate
- 5.59%
- Cash-on-cash
- -2.52%
- DSCR
- 0.89
- GRM
- 10.9
CMA / ARV
No comps found within radius.
Projected returns pro-forma
-1.42% appreciation · 1.18% rent growth · sell at horizon
- IRR
- -12.7%
- Equity multiple
- 0.48×
- Total profit
- $-52,352
- Equity at exit
- $79,680
- IRR
- -7.5%
- Equity multiple
- 0.40×
- Total profit
- $-60,175
- Equity at exit
- $77,664
Cash invested: $100,800 (down + closing). Projections, not guarantees.
Landlord ↔ Tenant lean methodology
- Overall (STATE)
- 87 Strongly Landlord-Friendly
- State Florida
- 87 Strongly Landlord-Friendly · R+3
- County
- — inherits STATE
- City
- — inherits STATE
ZIP-level market 33579
- Home prices YoY
- -0.6%
- Rents YoY
- 1.2%
- Active inventory
- 463
- Price-to-rent
- 10.9×
Monthly cashflow live
- Estimated rent
- $2,755 high interval (Pro) →
- Mortgage (P&I)
- −$1,888
- Tax from tax record
- −$338 /mo · $4,060/yr
- Insurance
- −$150
- HOA
- −$12
- Vacancy / Maint / Mgmt
- −$579
- Net cashflow
- $-212
Break-even live
Sensitivity live
| Price | -10% $-8 | -5% $-110 | +0% $-212 | +5% $-314 | +10% $-416 |
|---|---|---|---|---|---|
| Rent | -10% $-429 | -5% $-321 | +0% $-212 | +5% $-103 | +10% $6 |
| Rate | -1.0pp $-30 | -0.5pp $-120 | base $-212 | +0.5pp $-305 | +1.0pp $-400 |
UW: 25.0% down · 7.5% · 30yr · 1.5% tax · 5.0% vac · 8.0% maint · 8.0% mgmt
Financing live
Cash to close
- Down payment
- $90,000
- Closing costs
- $10,800
- Reserves months
- —
- Total cash needed
- —
Loan-product check · same deal, 3 products live
Conventional
25% down · 7.5% · 30yr
- Down + closing
- —
- Monthly P&I
- —
- Monthly cashflow
- —
- DSCR
- —
- Eligible?
- —
Personal DTI + credit; lowest rate.
DSCR
20% down · 8.5% · 30yr
- Down + closing
- —
- Monthly P&I
- —
- Monthly cashflow
- —
- DSCR
- —
- Eligible?
- —
No personal income docs; deal must DSCR.
Hard money
10% down · 12.0% · 12mo
- Down + closing
- —
- Monthly P&I
- —
- Monthly cashflow
- —
- DSCR
- —
- Eligible?
- —
Short-term bridge; refi at stabilization.
Rent comps 40 comps
| Address | Beds | Baths | Sqft | Rent | $/sqft | DOM | Units | Dist |
|---|---|---|---|---|---|---|---|---|
| 11519 Misty Isle Ln Riverview, FL | 4.0 | 2.0 | 1936 | $2,600 | $1.34 | 26d | 1 | 0.05mi |
| 11618 Ashton Field Ave Riverview, FL | 4.0 | 3.0 | 2114 | $2,400 | $1.14 | 1d | 1 | 0.22mi |
| 11328 Misty Isle Ln Riverview, FL | 4.0 | 3.5 | 2532 | $2,600 | $1.03 | 12d | 1 | 0.23mi |
| 11412 Misty Isle Ln Riverview, FL | 5.0 | 4.0 | 2523 | $3,200 | $1.27 | 26d | 1 | 0.24mi |
| 11424 Misty Isle Ln Riverview, FL | 3.0 | 2.0 | 1839 | $2,165 | $1.18 | 14d | 1 | 0.28mi |
| 11427 Misty Isle Ln Riverview, FL | 4.0 | 2.0 | 1916 | $2,310 | $1.21 | 6d | 1 | 0.30mi |
| 13465 Fladgate Mark Dr Riverview, FL | 4.0 | 2.0 | 1544 | $2,045 | $1.32 | 1d | 1 | 0.32mi |
| 13465 Fladgate Mark Dr Riverview, FL | 4.0 | 2.0 | 1544 | $2,045 | $1.32 | 6d | 1 | 0.32mi |
| 13423 Beechberry Dr Riverview, FL | 4.0 | 2.5 | 2322 | $2,800 | $1.21 | 4d | 1 | 0.33mi |
| 13263 Evening Sunset Ln Riverview, FL | 4.0 | 2.0 | 1959 | $2,200 | $1.12 | 6d | 1 | 0.37mi |
| 11716 Navajo Sandstone St Riverview, FL | 4.0 | 2.5 | 2450 | $2,900 | $1.18 | 6d | 1 | 0.39mi |
| 11211 Flora Springs Dr Riverview, FL | 5.0 | 3.0 | 2320 | $2,723 | $1.17 | 25d | 1 | 0.45mi |
| 13305 Silvercreek Dr Riverview, FL | 3.0 | 2.0 | 1743 | $2,099 | $1.20 | 6d | 1 | 0.48mi |
| 13655 Artesa Bell Dr Riverview, FL | 4.0 | 3.0 | 2351 | $3,000 | $1.28 | 0d | 1 | 0.62mi |
| 11510 Harlan Eddy Ct Riverview, FL | 4.0 | 2.0 | 2351 | $2,700 | $1.15 | 26d | 1 | 0.62mi |
| 11736 Dumaine Valley Rd Riverview, FL | 3.0 | 2.5 | 1670 | $2,000 | $1.20 | 16d | 1 | 0.72mi |
| 13204 Waterleaf Garden Cir Riverview, FL | 4.0 | 2.0 | 2046 | $3,600 | $1.76 | 6d | 1 | 0.75mi |
| 13625 Silver Charm Ct Riverview, FL | 4.0 | 2.5 | 1907 | $2,350 | $1.23 | 26d | 1 | 0.83mi |
| 13016 Prestwick Dr Riverview, FL | 4.0 | 3.0 | 2506 | $3,500 | $1.40 | 26d | 1 | 0.84mi |
| 11218 Scotchwood Dr Riverview, FL | 3.0 | 2.0 | 1546 | $2,150 | $1.39 | 16d | 1 | 0.88mi |
| 13230 Prestwick Dr Riverview, FL | 3.0 | 2.0 | 1270 | $1,830 | $1.44 | 19d | 1 | 0.89mi |
| 11164 Golden Silence Dr Riverview, FL | 3.0 | 2.0 | 1930 | $2,050 | $1.06 | 26d | 1 | 0.91mi |
| 11110 Cherrywood Ln Riverview, FL | 3.0 | 2.0 | 1264 | $2,045 | $1.62 | 6d | 1 | 0.91mi |
| 12026 Bridge Point Ln Riverview, FL | 3.0 | 2.5 | 1780 | $2,180 | $1.22 | 26d | 1 | 0.91mi |
| 13515 Palmera Vista Dr Riverview, FL | 4.0 | 2.0 | 1832 | $3,800 | $2.07 | 1d | 1 | 0.92mi |
| 13515 Palmera Vista Dr Riverview, FL | 4.0 | 2.0 | 1850 | $3,800 | $2.05 | 19d | 1 | 0.92mi |
| 12115 Feldwood Creek Ln Riverview, FL | 3.0 | 2.0 | 1234 | $1,850 | $1.50 | 6d | 1 | 0.92mi |
| 11810 Tetrafin Dr Riverview, FL | 4.0 | 2.0 | 2184 | $2,750 | $1.26 | 26d | 1 | 0.94mi |
| 12116 Feldwood Creek Ln Riverview, FL | 3.0 | 2.0 | 1289 | $1,825 | $1.42 | 22d | 1 | 0.94mi |
| 11105 Cherrywood Ln Riverview, FL | 4.0 | 2.0 | 1364 | $2,110 | $1.55 | 26d | 1 | 0.94mi |
| 12201 Matchfield Way Riverview, FL | 4.0 | 2.0 | 1522 | $1,595 | $1.05 | 19d | 1 | 0.96mi |
| 11322 Torrey Pines Dr Riverview, FL | 4.0 | 2.0 | 2194 | $2,300 | $1.05 | 26d | 1 | 0.97mi |
| 11025 Golden Silence Dr Riverview, FL | 3.0 | 2.5 | 1785 | $2,210 | $1.24 | 15d | 1 | 0.99mi |
| 11838 Blackeyed Susan Dr Riverview, FL | 4.0 | 2.0 | 1816 | $2,800 | $1.54 | 22d | 1 | 1.00mi |
| 12008 Butler Woods Cir Riverview, FL | 4.0 | 2.0 | 1544 | $2,215 | $1.43 | 0d | 1 | 1.01mi |
| 13456 Palmera Vista Dr Riverview, FL | 3.0 | 2.0 | 1752 | $2,500 | $1.43 | 19d | 1 | 1.01mi |
| 12019 Butler Woods Cir Riverview, FL | 3.0 | 2.0 | 1693 | $2,230 | $1.32 | 3d | 1 | 1.01mi |
| 11030 Whittney Chase Dr Riverview, FL | 3.0 | 2.0 | 1270 | $2,295 | $1.81 | 1d | 1 | 1.04mi |
| 13314 Prestwick Dr Riverview, FL | 3.0 | 2.0 | 1465 | $1,895 | $1.29 | 16d | 1 | 1.05mi |
| 11025 Whittney Chase Dr Riverview, FL | 4.0 | 2.0 | 1544 | $2,235 | $1.45 | 3d | 1 | 1.05mi |
HOA detail
- Monthly dues
- $12 · $144/yr
- Likely covers
- water
Listing history 4 events
-
2026-04-28status Pending
-
2026-04-24$360,000 Active
-
2007-12-03soldstatus $10,411,400
-
2005-06-27soldstatus $2,155,500
ⓘ Source: listings_history table (triggers on properties + properties_extension) + one-shot
backfill from property_details.listing_events for pre-trigger history.
Tax reassessment forecast FL · Resets to sale price
- Current annual tax
- $4,060 · $338/mo
- Projected year-2 tax
- $4,060 · $338/mo
- Expected delta
- $0/yr ($0/mo · 0.0%)
ⓘ Screening estimate from a state-policy table — verify with the county assessor before closing.
Nearby sold comps map
Loading sold comps map…
Walkable amenities ~0.75 mi
Loading nearby amenities…
Taxation est. · year 1
- Rental income
- $33,061
- − Mortgage interest
- −$20,166
- − Property taxes
- −$4,060
- − Insurance
- −$1,800
- − Repairs & maintenance
- −$2,645
- − Management
- −$2,645
- − HOA
- −$144
- − Depreciation
- −$10,473
- Taxable loss
- −$8,871
- Est. tax savings @ 24.0%
- +$2,129
- After-tax cash flow
- $-412/yr
For passive investors: Depreciation is non-cash, so a rental often shows a tax loss while cash-flowing — sheltering income. Rental losses are passive: they offset passive income freely, and up to $25,000/yr can offset ordinary (W-2) income if you actively participate and your MAGI is under $100k (phasing out to $0 by $150k); unused losses carry forward. On sale, claimed depreciation is recaptured at up to 25%, and gains may owe capital-gains tax (a 1031 exchange can defer both). Figures are a year-1 estimate at your 24.0% rate — not tax advice; consult a CPA.
Schools (NCES district)
- District
- Hillsborough
- NCES district ID
- 1200870
- Math proficiency
- 47% ▼ -8.00%
- Reading proficiency
- 50% ▼ -4.00%
- Median HH income
- $50,622
- Composite
- 41.6/100
- National rank
- #3435
- State rank
- #41 of 73 in FL
Livability — Riverview
- Score
- 79/100
- State rank
- #134
- US rank
- #2000
Category grades
Schools grade is shown separately in the Schools card above.
Census & demographics
- Census place
- Riverview, FL
- County
- Hillsborough County · 1,540,968 people
- City population
- 137,988
- Metro
- Tampa-St. Petersburg-Clearwater, FL
- Population (ZIP)
- 49,470
- Household income
- $116,134
- Rent vs Own
- Severe rent burden
- 258.0
Population outlook (Hillsborough County) Hauer SSP2
- Today (2025)
- 1,607,022 people
- By 2030
- 1,733,968 · +7.9%
- By 2040
- 1,979,565 · +23.2%
- By 2050
- 2,203,427 · +37.1%
- By 2075
- 2,667,893 · +66.0%
- By 2100
- 2,891,558 · +79.9%
Race, ethnicity, and origin ACS 2023
- Neighborhood character
- Highly diverse neighborhood (Simpson 0.71)
- Race & ethnicity
- White 42% Hispanic / Latino 25% Black 24% Two or more races 19% Asian 5%
- Hispanic origin (detail)
- Mexican 3% Puerto Rican 12% Cuban 3% Dominican 1%
- Common ancestry
- Hispanic 1% British 1% Romanian 1%
- Foreign-born
- 17% · Canada, Jamaica, China
- Languages at home
- 73% English-only · Spanish 19% Other Indo-European 2% French/Haitian/Cajun 1%
Political lean MEDSL · Hillsborough
- 2024 margin
- Toss-up / Even · D 47.8% · R 50.9% · Other 1.3%
- 2008→2024 swing
- -10.2pp toward R · 2008: 7.1pp · 2024: -3.1pp
- All cycles
- 2024: R+3.1 2020: D+6.9 2016: D+6.8 2012: D+6.7 2008: D+7.1
Not yet ingested
- Civics
- —
Market trends
- HPI YoY
- ▼ -1.42%
- Current HPI
- 240.5825
- Rent YoY
- ▲ 1.18%
- Metro
- Tampa-St. Petersburg-Clearwater, FL
- State GDP YoY
- ▲ 3.28%
- F500 in state
- 36
Industry mix (Fortune 500 HQ in FL)
| Industry | F500 HQs | Revenue |
|---|---|---|
| Industrial Technology | 2 | $29B |
|
||
| Insurance | 2 | $17B |
|
||
| Retail | 1 | $60B |
|
||
| Technology Distribution | 1 | $58B |
|
||
| Homebuilding | 1 | $35B |
|
||
| Technology Manufacturing | 1 | $35B |
|
||
Price history
-83.3% since first listed4 events — show timeline
- 2026-04-28 Pending — Stellar MLS as Distributed by MLS Grid
- 2026-04-24 Listed $360,000 Stellar MLS as Distributed by MLS Grid
- 2007-12-03 Sold (Public Records) $10,411,400 Public Records
- 2005-06-27 Sold (Public Records) $2,155,500 Public Records
Property tax history
+0.4%/yrLatest (2018): $4,060 · +3.2% YoY. Source: county tax records.
Cash-flow waterfall
monthlySold comps — $/sqft
last 12 mo · ≤1 miLoading sold comps…