3926 Golden Crane Pass · Red Bank, SC
Flood risk 1/10 · Minimal
- FEMA flood zone
- X (unshaded)
- Chance of flooding over 30 yrs
- 0.0%
- Est. flood insurance / yr
- $507 – $1,088
Fire risk 5/10 · Moderate
- Est. fire insurance / yr
- $783 – $1,453
Heat risk 6/10 · Moderate
- Hot days now (above 107°F)
- 7 days/yr
- Hot days in 30 yrs
- 15 days/yr
Wind risk 6/10 · Moderate
- Chance of severe wind over 30 yrs
- 65.0%
Air-quality risk 3/10 · Minor
- Unhealthy air days now
- 2 days/yr
- Unhealthy air days in 30 yrs
- 2 days/yr
Risk factors via First Street. Map © Google.
Why this score? — see what drove the D- grade
The composite is a weighted blend of 9 inputs, each scored 0–100. Each bar is that input's sub-score; the figure is the points it added to the 100-point composite (weight × sub-score).
- Cash flow +10.9/30.0
- ARV discount +7.5/15.0
- Schools +4.2/10.0
- Condition / age +4.0/5.0
- 1% rule +3.4/10.0
- Rent growth +3.3/5.0
- Livability +3.3/5.0
- DSCR +3.2/10.0
- Appreciation +0.0/10.0
$257,579
🖨 Deal sheet 📄 Offer letter ✓ Due diligence
Listing remarks
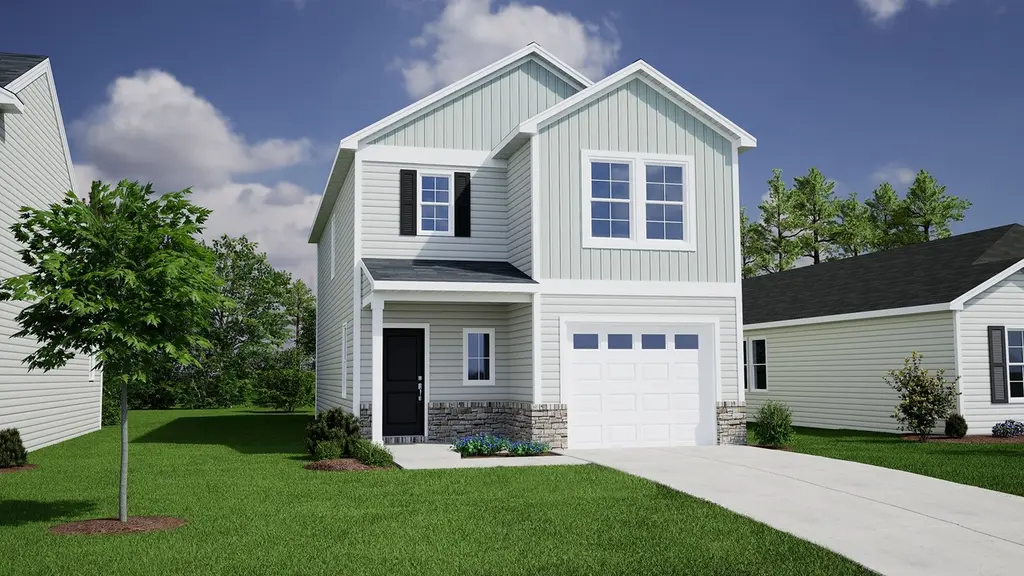
The Dawson! A roomy front porch welcomes you to this three bedroom two-and-one-half-bath plan! The main living areas have luxury vinyl plank flooring. There are stainless steel appliances in the spacious kitchen as well as upgraded cabinets! This home has an open concept from the kitchen to the great room. Upstairs is the large Primary suite and two secondary bedrooms a secondary full bath and laundry room. Outside, there is a large, covered porch for entertaining! Disclaimer: CMLS has not reviewed and, therefore, does not endorse vendors who may appear in listings.
Key facts
- Covered porch
- Open concept
- Front porch
Tags
Property features AI
Exterior
- Parking: Detached or attached 1-car garage (1 parking space total)
- Home design: Single-family home; Dawson floor plan
- Exterior features: Living area approximately 1,617
Interior
- Bedrooms: 3 bedrooms
- Bathrooms: 2 full bathrooms and 1 half bathroom
- Interior features: Spec home (Dawson plan)
Neighborhood map
What this means for you Summary
Snapshot
- This is a 3-bed/2.5-bath single-family listed at $258k. Condition is rated good.
Deal economics
- At list price, monthly cash flow is $-113 ($-1k/yr) — negative.
- To cash-flow at today's rent, offer at most $241k (6.4% below list).
- To meet the 1% rule (rent ≥ 1% of price), the offer needs to be $216k (16.1% below list).
- Recommended offer: $216k (16.1% below list) — sets the bar for 1% rule.
Location & tenants
- Location reads 66/100 on livability (#121 in SC) — a middle-class / working-renter tenant base. Strengths: cost of living A+, housing A+, health & safety B; Watch: employment C-, crime D+, schools F.
- Lexington 01 (suburban): math 42% / reading 53% proficiency, ranked #11 of 80 in SC (top 14%) — families likely to look elsewhere, expect single-tenant / working-renter base with shorter leases.
- Market conditions: Rents rising (+3.2%/yr); 564 active listings in the ZIP; 2 comparable units currently listed for rent nearby; solid renter incomes; 1,712 units permitted in Lexington County in 2024 (0 in 5+ unit buildings).
- This rent runs 34% of the median local income ($77k/yr) — at the standard rent-burdened threshold; future hikes will face affordability resistance.
Forward outlook
- Local home prices are declining (-3.0%/yr); year-one equity from $2k of loan paydown is wiped out by about $8k of value loss. Plan a longer hold.
- Lexington County population projected at +26% by 2050 — long-run rental-demand tailwind backs the buy-and-hold thesis.
Negotiation context
- Only 13 days on market — expect competitive offers; lowballing is unlikely to land.
Risks & watch-outs
- Climate carrying-cost: major wind risk, 65% chance of damaging wind over 30y; moderate wildfire risk; extreme-heat days projected 7→15/yr by 2055 (HVAC capex compounding) — expect insurance premiums to compound above CPI over the hold.
Questions for the listing agent
- What do current leases actually rent for vs. the listed asking? Can we see a recent rent roll and the last 12 months of T-12 income?
- What does the HOA fee cover, when was the last increase, and are there any pending special assessments or reserve-fund shortfalls?
- Is there a deadline driving the sale (1031 exchange, divorce, estate, relocation)? That informs how much negotiation room exists.
- Schools are F-rated, which usually means shorter tenancies and higher turnover. Who's the typical renter profile here, and what's been the actual vacancy rate?
- Crime grade is D in this area — have there been break-ins, vandalism, or insurance claims at this property in the last 3 years? What carrier currently insures it and at what premium?
- The area grade is low — what's the realistic commute time and amenity access for the typical tenant pool here? Any planned neighborhood developments (good or bad) we should know about?
- What's the average days-on-market for RENTAL listings here right now (not sales)? A rising rental-DOM trend means longer vacancies and softer asking-rent achievability than the comps imply.
- What's the recent tenant-quality profile in this submarket — average credit score on applications, eviction rate, late-payment / NSF rate, and stable-employment percentage? A property-management company in the area should have these aggregated.
- How much new for-sale + rental construction is in the pipeline within 1–3 miles? Heavy new supply typically softens prices + rents 12–24 months out; constrained supply supports both.
Investment metrics
- 1% rule
- 0.84% ✗
- Cap rate
- 5.77%
- Cash-on-cash
- -1.89%
- DSCR
- 0.92
- GRM
- 9.9
CMA / ARV
No comps found within radius.
Projected returns pro-forma
-3.0% appreciation · 3.24% rent growth · sell at horizon
- IRR
- -19.1%
- Equity multiple
- 0.33×
- Total profit
- $-48,374
- Equity at exit
- $38,406
- IRR
- -11.2%
- Equity multiple
- 0.32×
- Total profit
- $-49,022
- Equity at exit
- $22,271
Cash invested: $72,122 (down + closing). Projections, not guarantees.
Landlord ↔ Tenant lean methodology
- Overall (STATE)
- 90 Strongly Landlord-Friendly
- State South Carolina
- 90 Strongly Landlord-Friendly · R+6
- County
- — inherits STATE
- City
- — inherits STATE
ZIP-level market 29073
- Home prices YoY
- -19.1%
- Rents YoY
- 3.2%
- Active inventory
- 564
- Price-to-rent
- 9.9×
Monthly cashflow live
- Estimated rent
- $2,162 medium interval (Pro) →
- Mortgage (P&I)
- −$1,351
- Tax est. 1.5%
- −$322 /mo · $3,864/yr
- Insurance
- −$107
- HOA
- −$41
- Vacancy / Maint / Mgmt
- −$454
- Net cashflow
- $-113
Break-even live
UW: 25.0% down · 7.5% · 30yr · 1.5% tax · 5.0% vac · 8.0% maint · 8.0% mgmt
Financing live
Cash to close
- Down payment
- $64,395
- Closing costs
- $7,727
- Reserves months
- —
- Total cash needed
- —
Loan-product check · same deal, 3 products live
Conventional
25% down · 7.5% · 30yr
- Down + closing
- —
- Monthly P&I
- —
- Monthly cashflow
- —
- DSCR
- —
- Eligible?
- —
Personal DTI + credit; lowest rate.
DSCR
20% down · 8.5% · 30yr
- Down + closing
- —
- Monthly P&I
- —
- Monthly cashflow
- —
- DSCR
- —
- Eligible?
- —
No personal income docs; deal must DSCR.
Hard money
10% down · 12.0% · 12mo
- Down + closing
- —
- Monthly P&I
- —
- Monthly cashflow
- —
- DSCR
- —
- Eligible?
- —
Short-term bridge; refi at stabilization.
Rent comps 2 comps
| Address | Beds | Baths | Sqft | Rent | $/sqft | DOM | Units | Dist |
|---|---|---|---|---|---|---|---|---|
| 141 Whitton Ct Lexington, SC | 3.0 | 2.5 | 1910 | $2,045 | $1.07 | 23d | 1 | 0.71mi |
| 124 Cross Hill Rd Lexington, SC | 3.0 | 2.0 | 1126 | $1,681 | $1.49 | 23d | 1 | 1.28mi |
HOA detail
- Monthly dues
- $41 · $492/yr
Listing history 15 events
-
2026-06-18days on market $257,579 Active 13 DOM
-
2026-06-17days on market $257,579 Active 12 DOM
-
2026-06-16days on market $257,579 Active 11 DOM
-
2026-06-15days on market $257,579 Active 10 DOM
-
2026-06-14days on market $257,579 Active 8 DOM
-
2026-06-10days on market $257,579 Active 5 DOM
-
2026-06-09days on market $257,579 Active 4 DOM
-
2026-06-08days on market $257,579 Active 3 DOM
-
2026-06-07remarks 574-char remark
-
2026-06-07days on market $257,579 Active 2 DOM
-
2026-06-05days on market $257,579 Active 9 DOM
-
2026-06-03days on market $257,579 Active 8 DOM
-
2026-06-03days on market $257,579 Active 7 DOM
-
2026-06-02days on market $257,579 Active 6 DOM
-
2026-05-31days on market $257,579 Active 5 DOM
ⓘ Source: listings_history table (triggers on properties + properties_extension) + one-shot
backfill from property_details.listing_events for pre-trigger history.
Climate risk First Street
- Flood 1/10 Low FEMA zone X (unshaded) · 0% chance over 30 yrs
- Wildfire 5/10 Major
- Heat 6/10 Major 7 d/yr ≥107°F today · 15 d/yr by 30 yrs out
- Wind 6/10 Major 65% chance of damaging wind over 30 yrs
- Air quality 3/10 Moderate 2 unhealthy d/yr today · 2 by 30 yrs out
Nearby sold comps map
Loading sold comps map…
Walkable amenities ~0.75 mi
Loading nearby amenities…
Taxation est. · year 1
- Rental income
- $25,941
- − Mortgage interest
- −$14,428
- − Property taxes
- −$3,864
- − Insurance
- −$1,288
- − Repairs & maintenance
- −$2,075
- − Management
- −$2,075
- − HOA
- −$492
- − Depreciation
- −$7,493
- Taxable loss
- −$5,775
- Est. tax savings @ 24.0%
- +$1,386
- After-tax cash flow
- $26/yr
For passive investors: Depreciation is non-cash, so a rental often shows a tax loss while cash-flowing — sheltering income. Rental losses are passive: they offset passive income freely, and up to $25,000/yr can offset ordinary (W-2) income if you actively participate and your MAGI is under $100k (phasing out to $0 by $150k); unused losses carry forward. On sale, claimed depreciation is recaptured at up to 25%, and gains may owe capital-gains tax (a 1031 exchange can defer both). Figures are a year-1 estimate at your 24.0% rate — not tax advice; consult a CPA.
Condition & rehab AI · 8 photos
This home is in good condition with a good condition score of 80. It has a good kitchen, bathrooms, and exterior. The home is move-in ready with minor cosmetic updates that can increase its value.
Value-add opportunities
- Both Painting the exterior and interior walls — Fresh paint can enhance curb appeal and interior aesthetics.
- Both Updating the flooring in the bedrooms — New flooring can improve the look and feel of the bedrooms.
- Both Upgrading the kitchen appliances — Modern appliances can increase the home's appeal and value.
- Both Adding smart home features — Smart home features can increase convenience and appeal to potential buyers/renters.
- Both Landscaping improvements — Enhanced landscaping can improve curb appeal and attract more potential buyers/renters.
Renovation cost estimate screening
Value-add ROI direction
- Both Painting the exterior and interior walls — Fresh paint can enhance curb appeal and interior aesthetics. ↑
- Both Updating the flooring in the bedrooms — New flooring can improve the look and feel of the bedrooms. ↑
- Both Upgrading the kitchen appliances — Modern appliances can increase the home's appeal and value. ↑
- Both Adding smart home features — Smart home features can increase convenience and appeal to potential buyers/renters. ↑
- Both Landscaping improvements — Enhanced landscaping can improve curb appeal and attract more potential buyers/renters. ↑
ⓘ Cost ranges are severity-bucket heuristics (US national rule-of-thumb). Get contractor quotes + a written scope before underwriting a rehab budget.
Schools (NCES district)
- District
- Lexington 01
- NCES district ID
- 4502700
- Math proficiency
- 42% ▼ -12.00%
- Reading proficiency
- 53% ▼ -2.00%
- Median HH income
- $61,298
- Composite
- 41.75/100
- National rank
- #3399
- State rank
- #11 of 80 in SC
Livability — Red Bank
- Score
- 66/100
- State rank
- #121
- US rank
- #11985
Category grades
Schools grade is shown separately in the Schools card above.
Census & demographics
- County
- Lexington County · 232,571 people
- Metro
- Columbia, SC
- Population (ZIP)
- 53,156
- Household income
- $77,229
- Rent vs Own
- Severe rent burden
- 935.0
Population outlook (Lexington County) Hauer SSP2
- Today (2025)
- 322,999 people
- By 2030
- 342,356 · +6.0%
- By 2040
- 377,715 · +16.9%
- By 2050
- 406,984 · +26.0%
- By 2075
- 465,447 · +44.1%
- By 2100
- 485,674 · +50.4%
Race, ethnicity, and origin ACS 2023
- Neighborhood character
- Predominantly White (72%)
- Race & ethnicity
- White 72% Black 14% Two or more races 7% Hispanic / Latino 6% Asian 2%
- Hispanic origin (detail)
- Mexican 2% Puerto Rican 1%
- Common ancestry
- Romanian 3% Italian 2% Slovak 1%
- Foreign-born
- 4% · Canada, China
- Languages at home
- 93% English-only · Spanish 5% Other Indo-European 1%
Political lean MEDSL · Lexington
- 2024 margin
- Solid R (+33.5) · D 32.5% · R 66.0% · Other 1.4%
- 2008→2024 swing
- +4.6pp toward D · 2008: -38.0pp · 2024: -33.5pp
- All cycles
- 2024: R+33.5 2020: R+30.1 2016: R+36.7 2012: R+37.8 2008: R+38.0
Not yet ingested
- Civics
- —
Market trends
- HPI YoY
- ▼ -59.20%
- Current HPI
- 249.8957
- Rent YoY
- ▲ 3.24%
- Metro
- Columbia, SC
- State GDP YoY
- ▲ 4.51%
- F500 in state
- 2
Industry mix (Fortune 500 HQ in SC)
| Industry | F500 HQs | Revenue |
|---|---|---|
| Packaging | 1 | $7B |
|
||
Cash-flow waterfall
monthlySold comps — $/sqft
last 12 mo · ≤1 miLoading sold comps…