9480 Rigel St · Butterfield Park, NM
Flood risk 1/10 · Minimal
- FEMA flood zone
- X (unshaded)
- Chance of flooding over 30 yrs
- 0.0%
- Est. flood insurance / yr
- $507 – $1,088
Fire risk 4/10 · Minor
- Est. fire insurance / yr
- $706 – $1,312
Heat risk 5/10 · Moderate
- Hot days now (above 97°F)
- 5 days/yr
- Hot days in 30 yrs
- 15 days/yr
Wind risk 1/10 · Minimal
- Chance of severe wind over 30 yrs
- —
Air-quality risk 1/10 · Minimal
- Unhealthy air days now
- 0 days/yr
- Unhealthy air days in 30 yrs
- 0 days/yr
Risk factors via First Street. Map © Google.
Why this score? — see what drove the C+ grade
The composite is a weighted blend of 9 inputs, each scored 0–100. Each bar is that input's sub-score; the figure is the points it added to the 100-point composite (weight × sub-score).
- Cash flow +26.1/30.0
- DSCR +8.8/10.0
- ARV discount +7.5/15.0
- 1% rule +6.9/10.0
- Schools +4.6/10.0
- Rent growth +3.4/5.0
- Livability +2.5/5.0
- Condition / age +2.5/5.0
- Appreciation +0.0/10.0
$149,500
🖨 Deal sheet 📄 Offer letter ✓ Due diligence
Listing remarks MLS
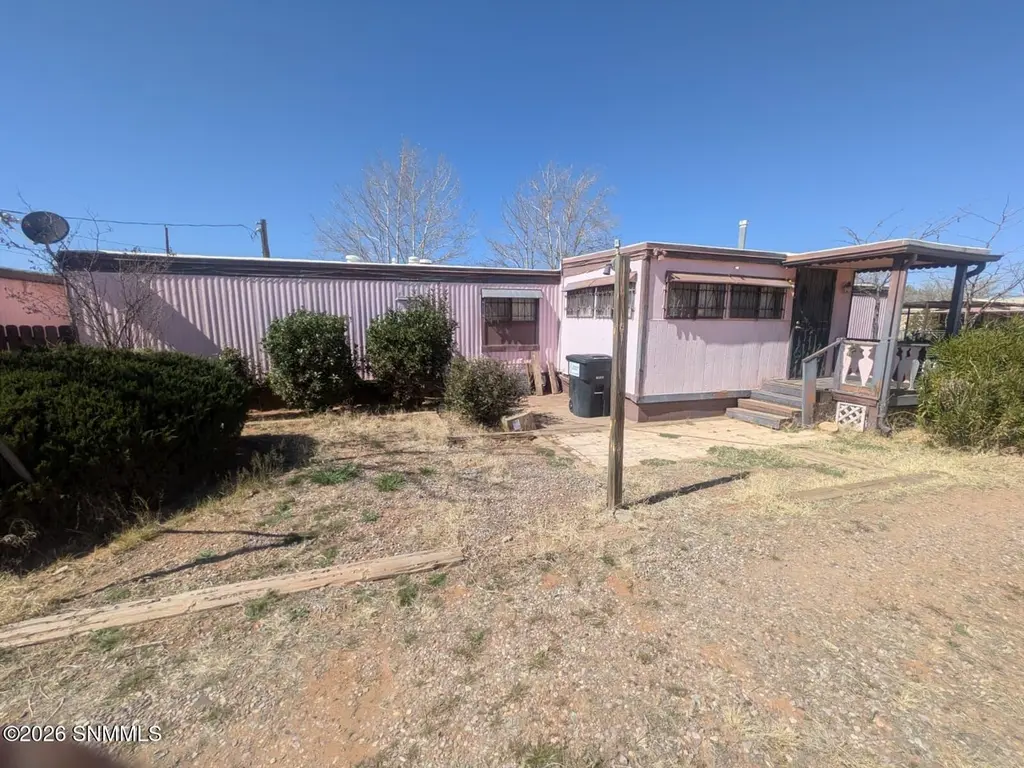
Welcome Home! This 3 bed, 1-3/4 bath, plus bonus room, manufactured home is calling your name! Great for investment or a place to call Home! Its sits on a huge half an acre of Prime New Mexico land!! All kitchen appliances and washer and dryer convey with the sale. Has a huge storage and 1 car garage on the side. Close to schools, shopping etc. Has great features like refrigerated air for those hot New Mexico summers and a large metal carport. . Priced to sell so come take a peek before its GONE!
Key facts
- Refrigerated air
- Huge storage
- Large metal carport
Tags
Neighborhood map
What this means for you Summary
Snapshot
- This is a 3-bed/2.0-bath manufactured listed at $150k.
Deal economics
- At list price, monthly cash flow is $376 ($5k/yr) — positive.
- The deal already cash-flows at list — no discount required.
- Meets the 1% rule at list price ($2k rent vs $150k).
- Recommended offer: $136k (9.0% below list) — sets the bar for market timing.
Location & tenants
- Location reads: area grade C — affects rentability + tenant quality, not the cash-flow math above.
- Las Cruces Public Schools (urban): math 42% / reading 68% proficiency, ranked #5 of 29 in NM (top 17%) — acceptable for families but not a draw, mixed tenant base, ~2y average lease; 62% free/reduced lunch — lower-income household profile, screen leases tightly.
- Market conditions: Rents rising (+3.5%/yr); 591 active listings in the ZIP; 964 units permitted in Doña Ana County in 2024 (0 in 5+ unit buildings).
- This rent runs 31% of the median local income ($69k/yr) — at the standard rent-burdened threshold; future hikes will face affordability resistance.
Forward outlook
- Local home prices are declining (-3.0%/yr); year-one equity from $1k of loan paydown is wiped out by about $4k of value loss. Plan a longer hold.
- At projected returns (-3.0% appreciation + 3.5% rent growth), your $42k cash investment doubles in ~10 years — after that, you're playing with house money.
Negotiation context
- It's been on market 108 days — a 9% lower offer ($136k) is reasonable based on typical stale-listing flexibility.
Risks & watch-outs
- Climate carrying-cost: extreme-heat days projected 5→15/yr by 2055 (HVAC capex compounding) — expect insurance premiums to compound above CPI over the hold.
Questions for the listing agent
- It's been on market 108 days. Have you received any prior offers? Is the seller open to a 9% concession, seller financing, or rate buy-down credit?
- Built in 1974 — when were the roof, HVAC, electrical panel, plumbing, and water heater last replaced?
- Why hasn't it sold? Are there any deal-killer items the seller is aware of (foundation, flood, title, zoning, code violations)?
- Is there a deadline driving the sale (1031 exchange, divorce, estate, relocation)? That informs how much negotiation room exists.
- What's the average days-on-market for RENTAL listings here right now (not sales)? A rising rental-DOM trend means longer vacancies and softer asking-rent achievability than the comps imply.
- What's the recent tenant-quality profile in this submarket — average credit score on applications, eviction rate, late-payment / NSF rate, and stable-employment percentage? A property-management company in the area should have these aggregated.
- How much new for-sale + rental construction is in the pipeline within 1–3 miles? Heavy new supply typically softens prices + rents 12–24 months out; constrained supply supports both.
Investment metrics
- 1% rule
- 1.19% ✓
- Cap rate
- 9.31%
- Cash-on-cash
- 10.79%
- DSCR
- 1.48
- GRM
- 7.0
CMA / ARV
No comps found within radius.
Projected returns pro-forma
-3.0% appreciation · 3.52% rent growth · sell at horizon
- IRR
- 0.4%
- Equity multiple
- 1.02×
- Total profit
- $713
- Equity at exit
- $22,291
- IRR
- 10.6%
- Equity multiple
- 1.85×
- Total profit
- $35,490
- Equity at exit
- $12,926
Cash invested: $41,860 (down + closing). Projections, not guarantees.
Landlord ↔ Tenant lean methodology
- Overall (STATE)
- 55 Moderately Landlord-Leaning
- State New Mexico
- 55 Moderately Landlord-Leaning · D+3
- County
- — inherits STATE
- City
- — inherits STATE
ZIP-level market 88012
- Home prices YoY
- -26.2%
- Rents YoY
- 3.5%
- Active inventory
- 591
- Price-to-rent
- 7.0×
Monthly cashflow live
- Estimated rent
- $1,784 medium interval (Pro) →
- Mortgage (P&I)
- −$784
- Tax est. 1.5%
- −$187 /mo · $2,242/yr
- Insurance
- −$62
- HOA
- −$0
- Vacancy / Maint / Mgmt
- −$375
- Net cashflow
- $376
Break-even live
UW: 25.0% down · 7.5% · 30yr · 1.5% tax · 5.0% vac · 8.0% maint · 8.0% mgmt
Financing live
Cash to close
- Down payment
- $37,375
- Closing costs
- $4,485
- Reserves months
- —
- Total cash needed
- —
Loan-product check · same deal, 3 products live
Conventional
25% down · 7.5% · 30yr
- Down + closing
- —
- Monthly P&I
- —
- Monthly cashflow
- —
- DSCR
- —
- Eligible?
- —
Personal DTI + credit; lowest rate.
DSCR
20% down · 8.5% · 30yr
- Down + closing
- —
- Monthly P&I
- —
- Monthly cashflow
- —
- DSCR
- —
- Eligible?
- —
No personal income docs; deal must DSCR.
Hard money
10% down · 12.0% · 12mo
- Down + closing
- —
- Monthly P&I
- —
- Monthly cashflow
- —
- DSCR
- —
- Eligible?
- —
Short-term bridge; refi at stabilization.
Listing history 15 events
-
2026-06-18days on market $149,500 Active 108 DOM
-
2026-06-17days on market $149,500 Active 107 DOM
-
2026-06-16days on market $149,500 Active 106 DOM
-
2026-06-15days on market $149,500 Active 105 DOM
-
2026-06-14days on market $149,500 Active 103 DOM
-
2026-06-13days on market $149,500 Active 102 DOM
-
2026-06-10days on market $149,500 Active 100 DOM
-
2026-06-09days on market $149,500 Active 99 DOM
-
2026-06-08days on market $149,500 Active 98 DOM
-
2026-06-07days on market $149,500 Active 97 DOM
-
2026-06-02days on market $149,500 Active 92 DOM
-
2026-06-01days on market $149,500 Active 91 DOM
-
2026-05-31days on market $149,500 Active 90 DOM
-
2026-05-30days on market $149,500 Active 89 DOM
-
2026-03-02$149,500 Active 501-char remark
Show marketing remark (501 chars)
Welcome Home! This 3 bed, 1-3/4 bath, plus bonus room, manufactured home is calling your name! Great for investment or a place to call Home! Its sits on a huge half an acre of Prime New Mexico land!! All kitchen appliances and washer and dryer convey with the sale. Has a huge storage and 1 car garage on the side. Close to schools, shopping etc. Has great features like refrigerated air for those hot New Mexico summers and a large metal carport. . Priced to sell so come take a peek before its GONE!
ⓘ Source: listings_history table (triggers on properties + properties_extension) + one-shot
backfill from property_details.listing_events for pre-trigger history.
Climate risk First Street
- Flood 1/10 Low FEMA zone X (unshaded) · 0% chance over 30 yrs
- Wildfire 4/10 Moderate
- Heat 5/10 Major 5 d/yr ≥97°F today · 15 d/yr by 30 yrs out
- Wind 1/10 Low
- Air quality 1/10 Low 0 unhealthy d/yr today · 0 by 30 yrs out
Nearby sold comps map
Loading sold comps map…
Walkable amenities ~0.75 mi
Loading nearby amenities…
Taxation est. · year 1
- Rental income
- $21,411
- − Mortgage interest
- −$8,374
- − Property taxes
- −$2,242
- − Insurance
- −$748
- − Repairs & maintenance
- −$1,713
- − Management
- −$1,713
- − Depreciation
- −$4,349
- Taxable income
- $2,272
- Est. tax owed @ 24.0%
- −$545
- After-tax cash flow
- $3,972/yr
For passive investors: Depreciation is non-cash, so a rental often shows a tax loss while cash-flowing — sheltering income. Rental losses are passive: they offset passive income freely, and up to $25,000/yr can offset ordinary (W-2) income if you actively participate and your MAGI is under $100k (phasing out to $0 by $150k); unused losses carry forward. On sale, claimed depreciation is recaptured at up to 25%, and gains may owe capital-gains tax (a 1031 exchange can defer both). Figures are a year-1 estimate at your 24.0% rate — not tax advice; consult a CPA.
Schools (NCES district)
- District
- Las Cruces Public Schools
- NCES district ID
- 3501500
- Math proficiency
- 42% ▲ 24.00%
- Reading proficiency
- 68% ▲ 35.00%
- Median HH income
- $41,157
- Composite
- 45.98/100
- National rank
- #2535
- State rank
- #5 of 29 in NM
Livability — Butterfield Park
No livability data for this city. (Only ~50 U.S. cities are tracked.)
Census & demographics
- County
- Dona Ana County · 144,044 people
- Metro
- Las Cruces, NM
- Population (ZIP)
- 33,158
- Household income
- $69,052
- Rent vs Own
- Severe rent burden
- 717.0
Population outlook (Doña Ana County) Hauer SSP2
- Today (2025)
- 219,177 people
- By 2030
- 220,967 · +0.8%
- By 2040
- 222,775 · +1.6%
- By 2050
- 223,576 · +2.0%
- By 2075
- 228,461 · +4.2%
- By 2100
- 214,536 · -2.1%
Race, ethnicity, and origin ACS 2023
- Neighborhood character
- Majority Hispanic (63%)
- Race & ethnicity
- Hispanic / Latino 63% White 32% Two or more races 25% Native American 2% Black 1% Asian 1%
- Hispanic origin (detail)
- Mexican 55%
- Common ancestry
- Slovak 2% Russian 1% Iranian 1%
- Foreign-born
- 10% · Canada, South Korea
- Languages at home
- 65% English-only · Spanish 33%
Political lean MEDSL · Doña Ana
- 2024 margin
- Lean D (+9.8) · D 53.8% · R 44.0% · Other 2.2%
- 2008→2024 swing
- -7.9pp toward R · 2008: 17.6pp · 2024: 9.8pp
- All cycles
- 2024: D+9.8 2020: D+18.3 2016: D+18.0 2012: D+14.9 2008: D+17.6
Not yet ingested
- Civics
- —
Market trends
- HPI YoY
- ▼ -66.04%
- Current HPI
- 185.7733
- Rent YoY
- ▲ 3.52%
- Metro
- Las Cruces, NM
- State GDP YoY
- —
- F500 in state
- 0
Price history
1 event — show timeline
- 2026-03-02 Listed $149,500 SNMMLS as distributed by MLS GRID
Property tax history
+0.4%/yrLatest (2025): $264 · +3.0% YoY. Source: county tax records.
Cash-flow waterfall
monthlySold comps — $/sqft
last 12 mo · ≤1 miLoading sold comps…