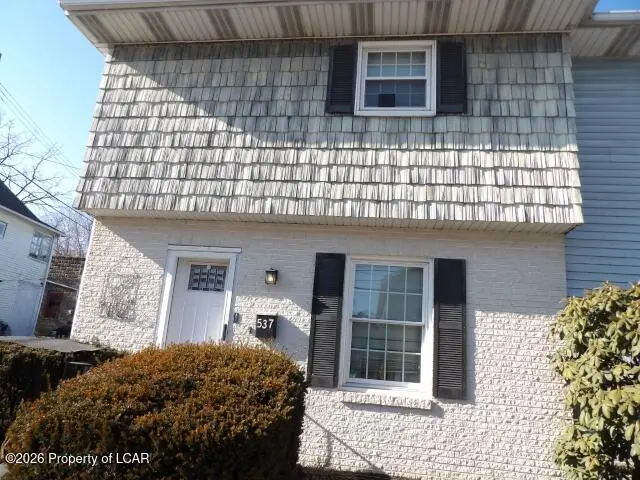
537 Main St · Plymouth, PA
Flood risk 6/10 · Moderate
- FEMA flood zone
- X
- Chance of flooding over 30 yrs
- 0.67%
- Est. flood insurance / yr
- $507 – $1,088
Fire risk 3/10 · Minor
- Est. fire insurance / yr
- $511 – $949
Heat risk 4/10 · Minor
- Hot days now (above 97°F)
- 8 days/yr
- Hot days in 30 yrs
- 18 days/yr
Wind risk 3/10 · Minor
- Chance of severe wind over 30 yrs
- 4.0%
Air-quality risk 1/10 · Minimal
- Unhealthy air days now
- 0 days/yr
- Unhealthy air days in 30 yrs
- 0 days/yr
Risk factors via First Street. Map © Google.
Why this score? — see what drove the C grade
The composite is a weighted blend of 9 inputs, each scored 0–100. Each bar is that input's sub-score; the figure is the points it added to the 100-point composite (weight × sub-score).
- Cash flow +18.5/30.0
- ARV discount +15.0/15.0
- DSCR +5.8/10.0
- 1% rule +5.3/10.0
- Livability +3.3/5.0
- Rent growth +2.5/5.0
- Schools +2.5/10.0
- Condition / age +2.5/5.0
- Appreciation +0.0/10.0
$126,900
🖨 Deal sheet (PDF) 📄 Offer letter ✓ Due diligence
Listing remarks MLS
Townhome, end-unit. Close to modern conveniences. Property is now active in online auction. All offers must be submitted through the property's listing page on www. auction.com. The sale will be subject to a 5% buyer's premium pursuant to the Auction Terms & Conditions (minimums may apply). All auction bids will be processed subject to seller approval.
Key facts
- Listed 103 days
Neighborhood map
What this means for you Summary
Snapshot
- This is a 2-bed/1.5-bath single-family listed at $127k.
Deal economics
- At list price, monthly cash flow is $120 ($1k/yr) — positive.
- The deal already cash-flows at list — no discount required.
- Meets the 1% rule at list price ($1k rent vs $127k).
- Recommended offer: $115k (9.0% below list) — sets the bar for market timing.
Location & tenants
- Location reads 66/100 on livability (#1,068 in PA) — a middle-class / working-renter tenant base. Strengths: cost of living A+, health & safety A+, housing B+; Watch: employment D, crime F, amenities F.
- Wyoming Valley West SD (suburban): math 18% / reading 42% proficiency, ranked #445 of 539 in PA (top 83%) — families likely to look elsewhere, expect single-tenant / working-renter base with shorter leases.
- Zoned schools: State El Ctr (math 8% / reading 32%, grade F, #1,248 of 1,518 statewide, top 83%, 1,353 students, 100% FRL); Wyoming Valley West Ms (math 13% / reading 41%, grade F, #404 of 512 statewide, top 80%, 1,191 students, 100% FRL); Wyoming Valley West Shs (math 57% / reading 24%, grade F, #255 of 437 statewide, top 60%, 1,357 students, 100% FRL) — zoned schools average 100% FRL vs 56% district-wide (44 pts higher); higher-poverty schools than district average — tighter screening recommended.
- Market conditions: 62 active listings in the ZIP; 14 comparable units currently listed for rent nearby; rentals at typical pace (median 24d on market — plan ~3-4 weeks tenant-placement turnaround); 349 units permitted in Luzerne County in 2024 (16 in 5+ unit buildings).
Forward outlook
- Local home prices are declining (-3.0%/yr); year-one equity from $877 of loan paydown is wiped out by about $4k of value loss. Plan a longer hold.
- Luzerne County population projected at +4% by 2050 — modest demand growth; plan on rents tracking national, not racing it.
Negotiation context
- It's been on market 104 days — a 9% lower offer ($115k) is reasonable based on typical stale-listing flexibility.
Risks & watch-outs
- Climate carrying-cost: major flood risk — expect insurance premiums to compound above CPI over the hold.
Questions for the listing agent
- It's been on market 104 days. Have you received any prior offers? Is the seller open to a 9% concession, seller financing, or rate buy-down credit?
- Why hasn't it sold? Are there any deal-killer items the seller is aware of (foundation, flood, title, zoning, code violations)?
- Is there a deadline driving the sale (1031 exchange, divorce, estate, relocation)? That informs how much negotiation room exists.
- Crime grade is F in this area — have there been break-ins, vandalism, or insurance claims at this property in the last 3 years? What carrier currently insures it and at what premium?
- What's the average days-on-market for RENTAL listings here right now (not sales)? A rising rental-DOM trend means longer vacancies and softer asking-rent achievability than the comps imply.
- What's the recent tenant-quality profile in this submarket — average credit score on applications, eviction rate, late-payment / NSF rate, and stable-employment percentage? A property-management company in the area should have these aggregated.
- How much new for-sale + rental construction is in the pipeline within 1–3 miles? Heavy new supply typically softens prices + rents 12–24 months out; constrained supply supports both.
Investment metrics
- 1% rule
- 1.03% ✓
- Cap rate
- 7.43%
- Cash-on-cash
- 4.06%
- DSCR
- 1.18
- GRM
- 8.1
CMA / ARV
- ARV (median comp)
- $181,764
- List price
- $126,900
- Delta
- -30.18%
- Verdict
- UNDERPRICED
- Comps
- 7 within 2.0 mi
Show comp detail 12 sales within ~0.75 mi
| Address | Dist | Beds/Ba | Sqft | Sold | Price | $/sf | Match |
|---|---|---|---|---|---|---|---|
| 124 Mras St | 0.30mi | 3/1.5 (+1) | 1,260 (+2%) | 0mo | $189,000 | $150 | 78 |
| 134 Reynolds St | 0.32mi | 2/1.0 | 1,302 (+5%) | 2mo | $150,000 | $115 | 73 |
| 358 Shawnee Ave | 0.31mi | 3/1.0 (+1) | 1,305 (+5%) | 7mo | $137,000 | $105 | 64 |
| 122 Flat Rd | 0.28mi | 3/1.5 (+1) | 1,325 (+7%) | 11mo | $217,150 | $164 | 61 |
| 926 Main St | 0.59mi | 3/2.0 (+1) | 1,202 (-3%) | 4mo | $170,000 | $141 | 57 |
| 89 Coal St | 0.22mi | 3/1.0 (+1) | 1,088 (-12%) | 11mo | $115,000 | $106 | 53 |
| 44 Hillside Ave | 0.74mi | 2/1.5 | 1,190 (-4%) | 7mo | $85,000 | $71 | 53 |
| 343 Mountain Rd | 0.70mi | 2/1.0 | 1,182 (-5%) | 7mo | $100,000 | $85 | 52 |
| 252 Orchard St | 0.51mi | 3/1.5 (+1) | 1,381 (+11%) | 7mo | $175,000 | $127 | 47 |
| 968 Main St | 0.69mi | 3/1.0 (+1) | 1,330 (+7%) | 8mo | $89,900 | $68 | 42 |
| 161 Center Ave | 0.65mi | 3/1.0 (+1) | 1,100 (-11%) | 3mo | $70,000 | $64 | 41 |
| 341 Mountain Rd | 0.69mi | 3/1.0 (+1) | 1,378 (+11%) | 7mo | $121,900 | $88 | 36 |
Match score weights: distance 35% · size 25% · config 20% · recency 20%. Top-matched comps best support the ARV.
Projected returns pro-forma
-3.0% appreciation · 3.0% rent growth · sell at horizon
- IRR
- -9.9%
- Equity multiple
- 0.64×
- Total profit
- $-12,862
- Equity at exit
- $18,921
- IRR
- -0.5%
- Equity multiple
- 0.97×
- Total profit
- $-1,167
- Equity at exit
- $10,972
Cash invested: $35,532 (down + closing). Projections, not guarantees.
Landlord ↔ Tenant lean methodology
- Overall (STATE)
- 62 Landlord-Friendly
- State Pennsylvania
- 62 Landlord-Friendly · EVEN
- County
- — inherits STATE
- City
- — inherits STATE
ZIP-level market 18651
- Home prices YoY
- -11.5%
- Active inventory
- 62
- Price-to-rent
- 8.1×
Monthly cashflow live
- Estimated rent
- $1,309 high interval (Pro) →
- Mortgage (P&I)
- −$665
- Tax from tax record
- −$196 /mo · $2,347/yr
- Insurance
- −$53
- HOA
- −$0
- Lot rent
- −$0
- Vacancy / Maint / Mgmt
- −$275
- Net cashflow
- $120
Break-even live
Sensitivity live
| Price | -10% $192 | -5% $156 | +0% $120 | +5% $84 | +10% $48 |
|---|---|---|---|---|---|
| Rent | -10% $17 | -5% $69 | +0% $120 | +5% $172 | +10% $224 |
| Rate | -1.0pp $184 | -0.5pp $153 | base $120 | +0.5pp $87 | +1.0pp $54 |
UW: 25.0% down · 7.5% · 30yr · 1.5% tax · 5.0% vac · 8.0% maint · 8.0% mgmt
Financing live
Cash to close
- Down payment
- $31,725
- Closing costs
- $3,807
- Reserves months
- —
- Total cash needed
- —
Loan-product check · same deal, 3 products live
Conventional
25% down · 7.5% · 30yr
- Down + closing
- —
- Monthly P&I
- —
- Monthly cashflow
- —
- DSCR
- —
- Eligible?
- —
Personal DTI + credit; lowest rate.
DSCR
20% down · 8.5% · 30yr
- Down + closing
- —
- Monthly P&I
- —
- Monthly cashflow
- —
- DSCR
- —
- Eligible?
- —
No personal income docs; deal must DSCR.
Hard money
10% down · 12.0% · 12mo
- Down + closing
- —
- Monthly P&I
- —
- Monthly cashflow
- —
- DSCR
- —
- Eligible?
- —
Short-term bridge; refi at stabilization.
Rent comps 14 comps
| Address | Beds | Baths | Sqft | Rent | $/sqft | DOM | Units | Dist |
|---|---|---|---|---|---|---|---|---|
| 546 W Main St Plymouth, PA | 1.0 | 1.0 | 720 | $875 | $1.22 | 16d | 1 | 0.03mi |
| 546 W Main St Plymouth, PA | 2.0 | 1.0 | 750 | $1,150 | $1.53 | 23d | 1 | 0.03mi |
| 29 Franklin St Plymouth, PA | 3.0 | 1.0 | 1426 | $1,800 | $1.26 | 16d | 1 | 0.11mi |
| 72 Franklin St Plymouth, PA | 2.0 | 1.0 | 750 | $1,175 | $1.57 | 16d | 1 | 0.15mi |
| 134 Blair St Plymouth, PA | 3.0 | 1.0 | 1300 | $1,300 | $1.00 | 23d | 1 | 0.19mi |
| 338 W Shawnee Ave Plymouth, PA | 2.0 | 1.5 | 945 | $1,550 | $1.64 | 16d | 1 | 0.33mi |
| 18 North St Plymouth, PA | 2.0 | 1.0 | 1200 | $1,300 | $1.08 | 16d | 1 | 0.39mi |
| 463 2nd St Plymouth, PA | 3.0 | 1.0 | 1250 | $1,500 | $1.20 | 46d | 1 | 0.40mi |
| 210-212 Center Ave Plymouth, PA | 3.0 | 1.0 | 1300 | $1,200 | $0.92 | 46d | 1 | 0.67mi |
| 48 E Shawnee Ave Plymouth, PA | 3.0 | 1.0 | 1500 | $1,250 | $0.83 | 16d | 1 | 0.72mi |
| 241 Gould St Plymouth, PA | 2.0 | 1.0 | 985 | $1,150 | $1.17 | 23d | 1 | 1.22mi |
| 600 Main Rd Hanover Township, PA | 1.0 | 1.0 | 960 | $940 | $0.98 | 46d | 1 | 1.36mi |
| 52 Diamond Ave Hanover Township, PA | 2.0 | 1.0 | 820 | $925 | $1.13 | 23d | 1 | 1.44mi |
| 92 Diamond Ave Hanover Township, PA | 3.0 | 1.0 | 1150 | $1,400 | $1.22 | 47d | 1 | 1.50mi |
Listing history 19 events
-
2026-06-23days on market $126,900 Active 104 DOM
-
2026-06-22days on market $126,900 Active 103 DOM
-
2026-06-18days on market $126,900 Active 100 DOM
-
2026-06-17days on market $126,900 Active 99 DOM
-
2026-06-16days on market $126,900 Active 98 DOM
-
2026-06-15days on market $126,900 Active 97 DOM
-
2026-06-14days on market $126,900 Active 95 DOM
-
2026-06-13days on market $126,900 Active 94 DOM
-
2026-06-10days on market $126,900 Active 92 DOM
-
2026-06-09days on market $126,900 Active 91 DOM
-
2026-06-08days on market $126,900 Active 90 DOM
-
2026-06-07days on market $126,900 Active 89 DOM
-
2026-06-05days on market $126,900 Active 86 DOM
-
2026-06-02days on market $126,900 Active 84 DOM
-
2026-06-01days on market $126,900 Active 83 DOM
-
2026-05-31days on market $126,900 Active 82 DOM
-
2026-05-30days on market $126,900 Active 81 DOM
-
2026-03-10$126,900 Active 360-char remark
Show marketing remark (360 chars)
Townhome, end-unit. Close to modern conveniences. Property is now active in online auction. All offers must be submitted through the property's listing page on www. auction.com. The sale will be subject to a 5% buyer's premium pursuant to the Auction Terms & Conditions (minimums may apply). All auction bids will be processed subject to seller approval.
-
2024-10-13price $140,000
ⓘ Source: listings_history table (triggers on properties + properties_extension) + one-shot
backfill from property_details.listing_events for pre-trigger history.
Tax reassessment forecast PA · Partial reset (capped growth)
- Current annual tax
- $2,347 · $196/mo
- Projected year-2 tax
- $2,347 · $196/mo
- Expected delta
- $0/yr ($0/mo · 0.0%)
ⓘ Screening estimate from a state-policy table — verify with the county assessor before closing.
Climate risk First Street
- Flood 6/10 Major FEMA zone X · 67% chance over 30 yrs
- Wildfire 3/10 Moderate
- Heat 4/10 Moderate 8 d/yr ≥97°F today · 18 d/yr by 30 yrs out
- Wind 3/10 Moderate 4% chance of damaging wind over 30 yrs
- Air quality 1/10 Low 0 unhealthy d/yr today · 0 by 30 yrs out
Nearby sold comps map
Loading sold comps map…
Walkable amenities ~0.75 mi
Loading nearby amenities…
Taxation est. · year 1
- Rental income
- $15,709
- − Mortgage interest
- −$7,108
- − Property taxes
- −$2,347
- − Insurance
- −$634
- − Repairs & maintenance
- −$1,257
- − Management
- −$1,257
- − Depreciation
- −$3,692
- Taxable loss
- −$586
- Est. tax savings @ 24.0%
- +$141
- After-tax cash flow
- $1,584/yr
For passive investors: Depreciation is non-cash, so a rental often shows a tax loss while cash-flowing — sheltering income. Rental losses are passive: they offset passive income freely, and up to $25,000/yr can offset ordinary (W-2) income if you actively participate and your MAGI is under $100k (phasing out to $0 by $150k); unused losses carry forward. On sale, claimed depreciation is recaptured at up to 25%, and gains may owe capital-gains tax (a 1031 exchange can defer both). Figures are a year-1 estimate at your 24.0% rate — not tax advice; consult a CPA.
Schools (NCES district)
- District
- Wyoming Valley West SD
- NCES district ID
- 4225950
- Math proficiency
- 18% ▼ -11.00%
- Reading proficiency
- 42% ▼ -12.00%
- Median HH income
- $42,437
- Composite
- 25.38/100
- National rank
- #7470
- State rank
- #445 of 539 in PA
Livability — Plymouth
- Score
- 66/100
- State rank
- #1068
- US rank
- #12056
Category grades
Schools grade is shown separately in the Schools card above.
Census & demographics
- Census place
- Plymouth, PA
- Population (ZIP)
- 8,672
Population outlook (Luzerne County) Hauer SSP2
- Today (2025)
- 319,505 people
- By 2030
- 319,943 · +0.1%
- By 2040
- 322,643 · +1.0%
- By 2050
- 330,817 · +3.5%
- By 2075
- 379,145 · +18.7%
- By 2100
- 431,908 · +35.2%
Race, ethnicity, and origin ACS 2023
- Neighborhood character
- Predominantly White (82%)
- Race & ethnicity
- White 82% Hispanic / Latino 10% Black 5% Two or more races 4%
- Hispanic origin (detail)
- Mexican 3% Dominican 5%
- Common ancestry
- Romanian 19% Scotch-Irish 2% Iranian 2%
- Foreign-born
- 5% · Canada
- Languages at home
- 91% English-only · Spanish 7% Other Indo-European 1%
Political lean MEDSL · Luzerne
- 2024 margin
- R (+19.2) · D 40.0% · R 59.2%
- 2008→2024 swing
- -27.6pp toward R · 2008: 8.4pp · 2024: -19.2pp
- All cycles
- 2024: R+19.2 2020: R+14.4 2016: R+19.6 2012: D+4.8 2008: D+8.4
Not yet ingested
- Civics
- —
Market trends
- HPI YoY
- ▼ -29.78%
- Current HPI
- 229.6791
- Rent YoY
- —
- Metro
- —
- State GDP YoY
- ▲ 1.68%
- F500 in state
- 34
Industry mix (Fortune 500 HQ in PA)
| Industry | F500 HQs | Revenue |
|---|---|---|
| Healthcare | 2 | $309B |
|
||
| Insurance | 2 | $27B |
|
||
| Telecommunications / Media | 1 | $124B |
|
||
| Industrial Distribution | 1 | $22B |
|
||
| Financial Services | 1 | $20B |
|
||
| Chemicals / Materials | 1 | $18B |
|
||
Price history
-9.4% since first listed2 events — show timeline
- 2026-03-10 Listed $126,900 LCAR
- 2024-10-13 Price Changed $140,000 LCAR
Property tax history
+2.2%/yrLatest (2026): $2,347 · +1.8% YoY. Source: county tax records.
Cash-flow waterfall
monthlySold comps — $/sqft
last 12 mo · ≤1 miLoading sold comps…