 🌊 Lakefront
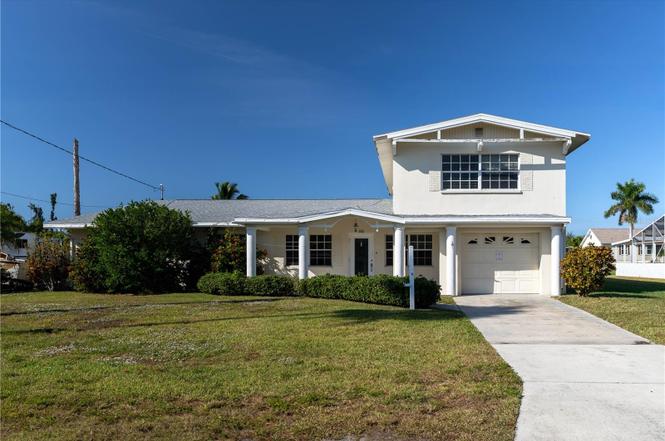
3333 Wisteria Pl · Charlotte Park, FL
Flood risk 10/10 · Severe
- FEMA flood zone
- AE
- Chance of flooding over 30 yrs
- 0.99%
- Est. flood insurance / yr
- $1,737 – $8,500
Fire risk 2/10 · Minimal
- Est. fire insurance / yr
- $947 – $1,759
Heat risk 10/10 · Severe
- Hot days now (above 107°F)
- 7 days/yr
- Hot days in 30 yrs
- 28 days/yr
Wind risk 10/10 · Severe
- Chance of severe wind over 30 yrs
- 99.0%
Air-quality risk 3/10 · Minor
- Unhealthy air days now
- 2 days/yr
- Unhealthy air days in 30 yrs
- 2 days/yr
Risk factors via First Street. Map © Google.
Why this score? — see what drove the C+ grade
The composite is a weighted blend of 9 inputs, each scored 0–100. Each bar is that input's sub-score; the figure is the points it added to the 100-point composite (weight × sub-score).
- Cash flow +26.1/30.0
- DSCR +8.8/10.0
- ARV discount +7.5/15.0
- 1% rule +7.0/10.0
- Schools +4.6/10.0
- Livability +3.3/5.0
- Rent growth +2.5/5.0
- Condition / age +2.5/5.0
- Appreciation +0.0/10.0
$295,000
🖨 Deal sheet 📄 Offer letter ✓ Due diligence
Listing remarks
Under contract-accepting backup offers. RARE WATERFRONT VALUE IN PUNTA GORDA — 85FT SEAWALL, DOCK & SUNSET VIEWS - This 4 bed/3.5 bath home offers the perfect blend of opportunity and lifestyle: boating access to Charlotte Harbor paired with the chance to transform a larger canal-front property into a personalized waterfront retreat. With 85 ft of seawall and a private dock just steps from the back door, it’s easy to picture mornings on the water, afternoons in the sun, and evenings spent enjoying the colorful sunsets over the canal. THIS IS YOUR OPPORTUNITY TO OWN ON THE WATER!! Inside, the home offers an impressive amount of living space beginning with a front living roo
Key facts
- 85ft seawall
- Canal view
- Private dock
Tags
Property features AI
Finance
- Other: Property type: Residential, single family; Zoning: RSF3.5; Living area and building area per public records; Universal property ID available
- Financial info: No lease restrictions indicated
- HOA & community: Pets allowed; No association approval required; No HOA/association indicated
Exterior
- Parking: Attached garage (1 car); Garage door opener; Garage approximately 12 x 33
- Security: Smoke detectors
- Utilities: Public water; Septic tank; Broadband/High-speed internet available; Cable available; Electricity connected; Water connected
- Home design: Single family residence; Two levels; East-facing; On waterfront (canal) with water view; Water access: bay/harbor, saltwater canal, gulf/ocean, river; Seawall (concrete)
- Construction: Block, stucco, and frame construction; Shingle roof; Slab foundation; Built on lot approximately 0.23 acre (lot dimensions 75 x 101 x 85 x 125)
- Exterior features: Patio; Screened porch; French doors; Trees and landscaped grounds; Flood zone; Paved lot/drive
Interior
- Kitchen: Built-in oven; Dishwasher; Refrigerator
- Bedrooms: 4 bedrooms
- Flooring: Carpet; Laminate; Terrazzo; Tile
- Bathrooms: 3 full bathrooms; 1 half bathroom
- Heating & cooling: Central heating (electric); Central air conditioning
- Interior features: Ceiling fans; Walk-in closets; Blinds on windows; Fireplace; Family room
- Laundry & utility: Laundry room; Laundry area in garage
Neighborhood map
What this means for you Summary
Snapshot
- This is a 4-bed/4.0-bath single-family listed at $295k.
Deal economics
- At list price, monthly cash flow is $319 ($4k/yr) — positive.
- The deal already cash-flows at list — no discount required.
- Meets the 1% rule at list price ($4k rent vs $295k).
- Recommended offer: $260k (12.0% below list) — sets the bar for market timing.
- Cap rate 9.3% vs local median 4.3% in Charlotte Park — top-decile yield for the area; either an underpriced asset or a hidden risk that comps aren't pricing in. Stress-test before assuming the spread holds.
Location & tenants
- Location reads 66/100 on livability (#624 in FL) — a middle-class / working-renter tenant base. Strengths: crime A+, cost of living A+, housing A+; Watch: amenities F, commute F, health & safety D-.
- Charlotte (suburban): math 54% / reading 54% proficiency, ranked #22 of 73 in FL (top 30%) — acceptable for families but not a draw, mixed tenant base, ~2y average lease.
- Zoned schools: Sallie Jones Elementary School (math 75% / reading 74%, grade A, #230 of 2,144 statewide, top 12%, 694 students, 47% FRL); Charlotte High School (math 44% / reading 46%, grade D-, #228 of 667 statewide, top 35%, 1,994 students, 41% FRL).
- Market conditions: Rents soft (-0.1%/yr); 999 active listings in the ZIP; 6 comparable units currently listed for rent nearby; rentals at typical pace (median 21d on market — plan ~3-4 weeks tenant-placement turnaround); solid renter incomes; 4,585 units permitted in Charlotte County in 2024 (703 in 5+ unit buildings).
- At $3,545/mo this rent would consume 56% of the median local household income ($76k/yr) (locally 608% of renters already pay >50% of income on rent) — very limited rent-growth headroom before tenants either downsize or default.
Forward outlook
- Local home prices are declining (-3.0%/yr); year-one equity from $2k of loan paydown is wiped out by about $9k of value loss. Plan a longer hold.
- Charlotte County population projected at +24% by 2050 — long-run rental-demand tailwind backs the buy-and-hold thesis.
Negotiation context
- It's been on market 187 days — a 12% lower offer ($260k) is reasonable based on typical stale-listing flexibility.
- 3 sale attempts since 19y ago; this cycle's ask has dropped $104k (26%) from the opening price — seller is motivated, your offer sets the floor, not the list.
- Current owner paid $175k; list at $295k implies a 69% gain — meaningful room to come down on a strong offer.
Risks & watch-outs
- Watch-outs: flood insurance adds $427/mo; built in 1959 — expect roof / HVAC / electrical / plumbing capex.
- Climate carrying-cost: in FEMA flood zone AE (mandatory federal flood insurance); severe wind risk, 99% chance of damaging wind over 30y; extreme-heat days projected 7→28/yr by 2055 (HVAC capex compounding) — expect insurance premiums to compound above CPI over the hold.
Questions for the listing agent
- It's been on market 187 days. Have you received any prior offers? Is the seller open to a 12% concession, seller financing, or rate buy-down credit?
- Built in 1959 — when were the roof, HVAC, electrical panel, plumbing, and water heater last replaced?
- What's the actual annual flood-insurance premium (NFIP or private), and is the property in a SFHA with mandatory coverage?
- Why hasn't it sold? Are there any deal-killer items the seller is aware of (foundation, flood, title, zoning, code violations)?
- Is there a deadline driving the sale (1031 exchange, divorce, estate, relocation)? That informs how much negotiation room exists.
- Schools are F-rated, which usually means shorter tenancies and higher turnover. Who's the typical renter profile here, and what's been the actual vacancy rate?
- This sits on a lake — are riparian / water-frontage rights deeded with the parcel? Any dock permits, shoreline easements, or HOA water-use restrictions?
- What's the documented flood / surge / shoreline-erosion history here (FEMA AND non-FEMA — e.g., storm surge, creek backup, septic-field saturation)?
- Any water-quality or seasonal algae-bloom issues that affect tenant satisfaction or short-term-rental demand?
- What's the average days-on-market for RENTAL listings here right now (not sales)? A rising rental-DOM trend means longer vacancies and softer asking-rent achievability than the comps imply.
- What's the recent tenant-quality profile in this submarket — average credit score on applications, eviction rate, late-payment / NSF rate, and stable-employment percentage? A property-management company in the area should have these aggregated.
- How much new for-sale + rental construction is in the pipeline within 1–3 miles? Heavy new supply typically softens prices + rents 12–24 months out; constrained supply supports both.
Investment metrics
- 1% rule
- 1.20% ✓
- Cap rate
- 9.32%
- Cash-on-cash
- 10.82%
- DSCR
- 1.48
- GRM
- 6.9
CMA / ARV
- ARV (on-the-fly)
- $1,027,464
- Comps found
- 3
Show comp detail 3 sales within ~0.75 mi
| Address | Dist | Beds/Ba | Sqft | Sold | Price | $/sf | Match |
|---|---|---|---|---|---|---|---|
| 3201 Colony Ct | 0.16mi | 4/3.0 | 2,412 (-13%) | 10mo | $660,000 | $274 | 59 |
| 1205 Royal Tern Dr | 0.73mi | 3/3.0 (-1) | 2,731 (-1%) | 2mo | $1,515,000 | $555 | 53 |
| 1217 Pine Siskin Dr | 0.65mi | 3/2.5 (-1) | 2,473 (-10%) | 6mo | $920,000 | $372 | 36 |
Match score weights: distance 35% · size 25% · config 20% · recency 20%. Top-matched comps best support the ARV.
Projected returns pro-forma
-3.0% appreciation · 0.0% rent growth · sell at horizon
- IRR
- -13.1%
- Equity multiple
- 0.55×
- Total profit
- $-37,578
- Equity at exit
- $43,985
- IRR
- -10.8%
- Equity multiple
- 0.45×
- Total profit
- $-45,426
- Equity at exit
- $25,506
Cash invested: $82,600 (down + closing). Projections, not guarantees.
Landlord ↔ Tenant lean methodology
- Overall (STATE)
- 87 Strongly Landlord-Friendly
- State Florida
- 87 Strongly Landlord-Friendly · R+3
- County
- — inherits STATE
- City
- — inherits STATE
ZIP-level market 33950
- Home prices YoY
- -29.9%
- Rents YoY
- -0.1%
- Active inventory
- 999
- Price-to-rent
- 6.9×
Monthly cashflow live
- Estimated rent
- $3,545 high interval (Pro) →
- Mortgage (P&I)
- −$1,547
- Tax from tax record
- −$386 /mo · $4,630/yr
- Insurance
- −$123
- Flood insurance flood zone
- −$427 /mo · $5,118/yr
- HOA
- −$0
- Vacancy / Maint / Mgmt
- −$745
- Net cashflow
- $319
Break-even live
UW: 25.0% down · 7.5% · 30yr · 1.5% tax · 5.0% vac · 8.0% maint · 8.0% mgmt
Financing live
Cash to close
- Down payment
- $73,750
- Closing costs
- $8,850
- Reserves months
- —
- Total cash needed
- —
Loan-product check · same deal, 3 products live
Conventional
25% down · 7.5% · 30yr
- Down + closing
- —
- Monthly P&I
- —
- Monthly cashflow
- —
- DSCR
- —
- Eligible?
- —
Personal DTI + credit; lowest rate.
DSCR
20% down · 8.5% · 30yr
- Down + closing
- —
- Monthly P&I
- —
- Monthly cashflow
- —
- DSCR
- —
- Eligible?
- —
No personal income docs; deal must DSCR.
Hard money
10% down · 12.0% · 12mo
- Down + closing
- —
- Monthly P&I
- —
- Monthly cashflow
- —
- DSCR
- —
- Eligible?
- —
Short-term bridge; refi at stabilization.
Rent comps 6 comps
| Address | Beds | Baths | Sqft | Rent | $/sqft | DOM | Units | Dist |
|---|---|---|---|---|---|---|---|---|
| 2811 Poinciana Ct Punta Gorda, FL | 3.0 | 2.0 | 2154 | $2,300 | $1.07 | 13d | 1 | 0.41mi |
| 2736 Magdalina Dr Punta Gorda, FL | 3.0 | 2.0 | 2004 | $5,000 | $2.50 | 21d | 1 | 0.60mi |
| 732 Santa Margerita Ln Punta Gorda, FL | 3.0 | 2.0 | 2017 | $3,000 | $1.49 | 21d | 1 | 1.05mi |
| 3804 Turtle Dove Blvd Punta Gorda, FL | 5.0 | 3.0 | 2615 | $4,000 | $1.53 | 21d | 1 | 1.15mi |
| 3836 Paola Dr Punta Gorda, FL | 3.0 | 2.5 | 2558 | $5,000 | $1.95 | 21d | 1 | 1.25mi |
| 945 Bal Harbor Blvd Punta Gorda, FL | 3.0 | 2.0 | 2085 | $5,500 | $2.64 | 21d | 1 | 1.34mi |
Listing history 24 events
-
2026-06-16status $295,000 Pending 187 DOM
-
2026-06-15days on market $295,000 Active 187 DOM
-
2026-06-14days on market $295,000 Active 185 DOM
-
2026-06-13days on market $295,000 Active 184 DOM
-
2026-06-10days on market $295,000 Active 182 DOM
-
2026-06-09days on market $295,000 Active 181 DOM
-
2026-06-08days on market $295,000 Active 180 DOM
-
2026-06-05days on market $295,000 Active 176 DOM
-
2026-06-03days on market $295,000 Active 175 DOM
-
2026-06-03price $295,000 Active 174 DOM
-
2026-06-02days on market $309,000 Active 174 DOM
-
2026-06-01days on market $309,000 Active 173 DOM
-
2026-05-31days on market $309,000 Active 172 DOM
-
2026-05-30days on market $309,000 Active 171 DOM
-
2026-04-21price $309,000
-
2026-03-19price $319,000
-
2026-02-18price $335,000
-
2026-01-21price $369,000
-
2025-12-10$399,000 Active
-
2010-10-06historical
-
2010-05-23$239,900
-
2007-11-05$399,000
-
2003-04-02soldstatus $175,000
-
1989-03-01soldstatus $90,000
ⓘ Source: listings_history table (triggers on properties + properties_extension) + one-shot
backfill from property_details.listing_events for pre-trigger history.
Tax reassessment forecast FL · Resets to sale price
- Current annual tax
- $4,630 · $386/mo
- Projected year-2 tax
- $4,630 · $386/mo
- Expected delta
- $0/yr ($0/mo · 0.0%)
ⓘ Screening estimate from a state-policy table — verify with the county assessor before closing.
Climate risk First Street
- Flood 10/10 Extreme FEMA zone AE · 99% chance over 30 yrs
- Wildfire 2/10 Low
- Heat 10/10 Extreme 7 d/yr ≥107°F today · 28 d/yr by 30 yrs out
- Wind 10/10 Extreme 99% chance of damaging wind over 30 yrs
- Air quality 3/10 Moderate 2 unhealthy d/yr today · 2 by 30 yrs out
Nearby sold comps map
Loading sold comps map…
Walkable amenities ~0.75 mi
Loading nearby amenities…
Taxation est. · year 1
- Rental income
- $42,545
- − Mortgage interest
- −$16,525
- − Property taxes
- −$4,630
- − Insurance
- −$6,594
- − Repairs & maintenance
- −$3,404
- − Management
- −$3,404
- − Depreciation
- −$8,582
- Taxable loss
- −$592
- Est. tax savings @ 24.0%
- +$142
- After-tax cash flow
- $3,965/yr
For passive investors: Depreciation is non-cash, so a rental often shows a tax loss while cash-flowing — sheltering income. Rental losses are passive: they offset passive income freely, and up to $25,000/yr can offset ordinary (W-2) income if you actively participate and your MAGI is under $100k (phasing out to $0 by $150k); unused losses carry forward. On sale, claimed depreciation is recaptured at up to 25%, and gains may owe capital-gains tax (a 1031 exchange can defer both). Figures are a year-1 estimate at your 24.0% rate — not tax advice; consult a CPA.
Schools (NCES district)
- District
- Charlotte
- NCES district ID
- 1200240
- Math proficiency
- 54% ▼ -6.00%
- Reading proficiency
- 54% ▼ -1.00%
- Median HH income
- $44,864
- Composite
- 45.62/100
- National rank
- #2586
- State rank
- #22 of 73 in FL
Livability — Charlotte Park
- Score
- 66/100
- State rank
- #624
- US rank
- #12150
Category grades
Schools grade is shown separately in the Schools card above.
Census & demographics
- Census place
- Charlotte Park, FL
- County
- Charlotte County · 196,994 people
- Metro
- Punta Gorda, FL
- Population (ZIP)
- 24,955
- Household income
- $76,369
- Rent vs Own
- Severe rent burden
- 608.0
Population outlook (Charlotte County) Hauer SSP2
- Today (2025)
- 198,646 people
- By 2030
- 210,507 · +6.0%
- By 2040
- 230,857 · +16.2%
- By 2050
- 247,148 · +24.4%
- By 2075
- 281,777 · +41.8%
- By 2100
- 293,609 · +47.8%
Race, ethnicity, and origin ACS 2023
- Neighborhood character
- Predominantly White (86%)
- Race & ethnicity
- White 86% Two or more races 5% Black 5% Hispanic / Latino 4% Asian 1%
- Common ancestry
- Lithuanian 5% Romanian 4% Italian 2%
- Foreign-born
- 7% · Canada
- Languages at home
- 95% English-only · Spanish 3% Other Indo-European 1% German/W. Germanic 1%
Political lean MEDSL · Charlotte
- 2024 margin
- Solid R (+34.0) · D 32.7% · R 66.7%
- 2008→2024 swing
- -26.7pp toward R · 2008: -7.2pp · 2024: -34.0pp
- All cycles
- 2024: R+34.0 2020: R+26.6 2016: R+27.8 2012: R+14.3 2008: R+7.2
Not yet ingested
- Civics
- —
Market trends
- HPI YoY
- ▼ -111.73%
- Current HPI
- 261.6573
- Rent YoY
- ▼ -0.06%
- Metro
- Punta Gorda, FL
- State GDP YoY
- ▲ 3.28%
- F500 in state
- 36
Industry mix (Fortune 500 HQ in FL)
| Industry | F500 HQs | Revenue |
|---|---|---|
| Industrial Technology | 2 | $29B |
|
||
| Insurance | 2 | $17B |
|
||
| Retail | 1 | $60B |
|
||
| Technology Distribution | 1 | $58B |
|
||
| Homebuilding | 1 | $35B |
|
||
| Technology Manufacturing | 1 | $35B |
|
||
Price history
+243.3% since first listed10 events — show timeline
- 2026-04-21 Price Changed $309,000 Stellar MLS as Distributed by MLS Grid
- 2026-03-19 Price Changed $319,000 Stellar MLS as Distributed by MLS Grid
- 2026-02-18 Price Changed $335,000 Stellar MLS as Distributed by MLS Grid
- 2026-01-21 Price Changed $369,000 Stellar MLS as Distributed by MLS Grid
- 2025-12-10 Listed $399,000 Stellar MLS as Distributed by MLS Grid
- 2010-10-06 Listing Removed — Stellar MLS as Distributed by MLS Grid
- 2010-05-23 Listed $239,900 Stellar MLS as Distributed by MLS Grid
- 2007-11-05 Listed $399,000 Stellar MLS as Distributed by MLS Grid
- 2003-04-02 Sold (Public Records) $175,000 Public Records
- 1989-03-01 Sold (Public Records) $90,000 Public Records
Property tax history
+6.6%/yrLatest (2025): $4,630 · -5.2% YoY. Source: county tax records.
Cash-flow waterfall
monthlySold comps — $/sqft
last 12 mo · ≤1 miLoading sold comps…