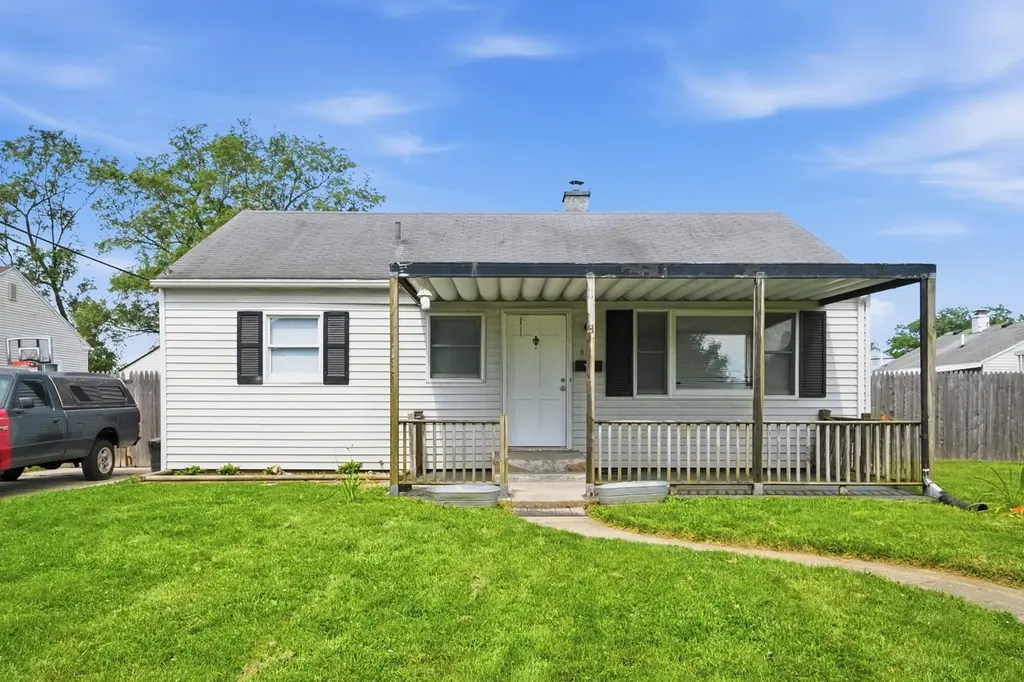
643 Feese Pl · Springfield, OH
Flood risk 1/10 · Minimal
- FEMA flood zone
- X (unshaded)
- Chance of flooding over 30 yrs
- 0.0%
- Est. flood insurance / yr
- $507 – $1,088
Fire risk 1/10 · Minimal
- Est. fire insurance / yr
- $713 – $1,323
Heat risk 3/10 · Minor
- Hot days now (above 100°F)
- 7 days/yr
- Hot days in 30 yrs
- 18 days/yr
Wind risk 2/10 · Minimal
- Chance of severe wind over 30 yrs
- 0.0%
Air-quality risk 3/10 · Minor
- Unhealthy air days now
- 2 days/yr
- Unhealthy air days in 30 yrs
- 3 days/yr
Risk factors via First Street. Map © Google.
Why this score? — see what drove the D grade
The composite is a weighted blend of 9 inputs, each scored 0–100. Each bar is that input's sub-score; the figure is the points it added to the 100-point composite (weight × sub-score).
- ARV discount +13.1/15.0
- Cash flow +11.1/30.0
- 1% rule +4.4/10.0
- DSCR +3.2/10.0
- Livability +2.8/5.0
- Rent growth +2.5/5.0
- Condition / age +2.5/5.0
- Schools +1.9/10.0
- Appreciation +0.0/10.0
$119,900
🖨 Deal sheet (PDF) 📄 Offer letter ✓ Due diligence
Listing remarks MLS
POSSIBLE THREE BEDROOMS. WOOD FLOORS, PARTIAL REPLACEMENT WINDOWS. OVERSIZED TWO CAR DETACHED GARAGE. BEAUTIFUL UPDATED MAPLE KTICHEN CABINETS. NEW CARPET LIVING ROOM & BEDROOMS. NEW CHAIN LINK FENCE IN BACK YARD BEING INSTALLED.
Key facts
- Quiet cul-de-sac
- Detached car garage
- 6,534 sq ft lot
Tags
Property features AI
Exterior
- Parking: 2.5 garage spaces; Has garage
- Utilities: Supplied water; Public sewer
- Home design: Single family residence; House; Built in 1950
- Construction: Vinyl siding; Block foundation
- Exterior features: Porch; Patio; Fenced yard; Cul-de-sac lot; Residential lot
Interior
- Kitchen: Dishwasher; Range; Refrigerator
- Bedrooms: Bedroom 1 (12 x 11); Bedroom 2 (11 x 10); Bedroom 3 (8 x 11)
- Bathrooms: 1 full bathroom
- Heating & cooling: Natural gas heating; Central air conditioning
- Interior features: Attic; Ceiling fan(s); Security system; Smoke detector(s)
- Laundry & utility: Crawl space basement
Neighborhood map
What this means for you Summary
Snapshot
- This is a 3-bed/1.0-bath single-family listed at $120k.
Deal economics
- At list price, monthly cash flow is $-49 ($-586/yr) — negative.
- To cash-flow at today's rent, offer at most $111k (7.2% below list).
- To meet the 1% rule (rent ≥ 1% of price), the offer needs to be $113k (5.9% below list).
- Recommended offer: $111k (7.2% below list) — sets the bar for cash-flow.
- Cap rate 5.8% vs local median 4.7% in Springfield — meaningfully above typical; check what's discounted (condition, days-on-market, listing class) to confirm the premium yield is real.
Location & tenants
- Location reads 56/100 on livability (#1,108 in OH) — a working-class tenant base; expect higher turnover. Strengths: cost of living A+, housing A+; Watch: crime F, amenities F, commute F.
- Springfield City School District (urban): math 20% / reading 27% proficiency, ranked #616 of 656 in OH (top 94%) — low school quality limits family demand, transient renter base, plan for 1-2y turnover; 75% free/reduced lunch — lower-income household profile, screen leases tightly.
- Zoned schools: Mann Elementary School (math 29% / reading 32%, grade F, #1,151 of 1,584 statewide, top 73%, 383 students, 0% FRL); Schaefer Middle School (math 20% / reading 27%, grade F, #597 of 654 statewide, top 92%, 268 students, 0% FRL); Springfield High School (math 17% / reading 31%, grade F, #665 of 781 statewide, top 85%, 1,516 students, 0% FRL) — zoned schools average 0% FRL vs 75% district-wide (75 pts lower); this property's tenant base skews higher-income than the district average.
- Market conditions: 158 active listings in the ZIP; 2 comparable units currently listed for rent nearby; lower-income renter base — watch delinquency; 232 units permitted in Clark County in 2024 (116 in 5+ unit buildings).
- This rent runs 31% of the median local income ($44k/yr) — at the standard rent-burdened threshold; future hikes will face affordability resistance.
Forward outlook
- Local home prices are declining (-3.0%/yr); year-one equity from $829 of loan paydown is wiped out by about $4k of value loss. Plan a longer hold.
- Clark County population projected at -16% by 2050 — secular population decline; favor cash flow + early exit over multi-decade hold.
Negotiation context
- Only 2 days on market — expect competitive offers; lowballing is unlikely to land.
- 2 sale attempts since 17y ago with the ask held roughly flat each time — persistent listings suggest the price (not the market) is what's stuck; bring a comps-based counter.
- Current owner paid $67k; list at $120k implies a 79% gain — meaningful room to come down on a strong offer.
Risks & watch-outs
- Watch-outs: property tax is 2.6% of price; built in 1950 — expect roof / HVAC / electrical / plumbing capex.
Questions for the listing agent
- What do current leases actually rent for vs. the listed asking? Can we see a recent rent roll and the last 12 months of T-12 income?
- Built in 1950 — when were the roof, HVAC, electrical panel, plumbing, and water heater last replaced?
- Property tax is high relative to price — has the assessment been appealed recently, and will the sale trigger a re-assessment?
- Is there a deadline driving the sale (1031 exchange, divorce, estate, relocation)? That informs how much negotiation room exists.
- Crime grade is F in this area — have there been break-ins, vandalism, or insurance claims at this property in the last 3 years? What carrier currently insures it and at what premium?
- The area grade is low — what's the realistic commute time and amenity access for the typical tenant pool here? Any planned neighborhood developments (good or bad) we should know about?
- What's the average days-on-market for RENTAL listings here right now (not sales)? A rising rental-DOM trend means longer vacancies and softer asking-rent achievability than the comps imply.
- What's the recent tenant-quality profile in this submarket — average credit score on applications, eviction rate, late-payment / NSF rate, and stable-employment percentage? A property-management company in the area should have these aggregated.
- How much new for-sale + rental construction is in the pipeline within 1–3 miles? Heavy new supply typically softens prices + rents 12–24 months out; constrained supply supports both.
Investment metrics
- 1% rule
- 0.94% ✗
- Cap rate
- 5.80%
- Cash-on-cash
- -1.74%
- DSCR
- 0.92
- GRM
- 8.9
CMA / ARV
- ARV (on-the-fly)
- $137,088
- Comps found
- 12
Show comp detail 12 sales within ~0.75 mi
| Address | Dist | Beds/Ba | Sqft | Sold | Price | $/sf | Match |
|---|---|---|---|---|---|---|---|
| 2670 Duncan St | 0.27mi | 3/1.0 | 816 (0%) | 4mo | $137,000 | $168 | 84 |
| 2733 Elmore Dr | 0.33mi | 3/1.0 | 816 (0%) | 7mo | $139,900 | $171 | 79 |
| 2745 Share St | 0.35mi | 2/1.0 (-1) | 816 (0%) | 1mo | $130,000 | $159 | 78 |
| 325 Gruen Dr | 0.42mi | 3/1.0 | 816 (0%) | 8mo | $104,000 | $127 | 73 |
| 637 S Arlington Ave | 0.28mi | 2/1.0 (-1) | 798 (-2%) | 8mo | $95,000 | $119 | 72 |
| 327 Buxton Ave | 0.32mi | 3/1.0 | 864 (+6%) | 6mo | $150,000 | $174 | 70 |
| 1915 Kenwood Ave | 0.62mi | 3/1.0 | 812 (-0%) | 4mo | $159,000 | $196 | 67 |
| 1979 Kenton St | 0.51mi | 2/1.0 (-1) | 752 (-8%) | 1mo | $77,000 | $102 | 58 |
| 1014 Beacon St | 0.63mi | 3/1.0 | 768 (-6%) | 4mo | $154,500 | $201 | 57 |
| 528 Geron Dr | 0.64mi | 2/1.0 (-1) | 864 (+6%) | 7mo | $165,000 | $191 | 50 |
| 1823 Rutland Ave | 0.70mi | 2/1.0 (-1) | 768 (-6%) | 4mo | $65,000 | $85 | 49 |
| 523 Linwood Ave | 0.58mi | 2/1.0 (-1) | 910 (+12%) | 7mo | $45,000 | $49 | 43 |
Match score weights: distance 35% · size 25% · config 20% · recency 20%. Top-matched comps best support the ARV.
Projected returns pro-forma
-3.0% appreciation · 3.0% rent growth · sell at horizon
- IRR
- -19.1%
- Equity multiple
- 0.33×
- Total profit
- $-22,451
- Equity at exit
- $17,877
- IRR
- -11.5%
- Equity multiple
- 0.31×
- Total profit
- $-23,204
- Equity at exit
- $10,367
Cash invested: $33,572 (down + closing). Projections, not guarantees.
Landlord ↔ Tenant lean methodology
- Overall (STATE)
- 73 Landlord-Friendly
- State Ohio
- 73 Landlord-Friendly · R+6
- County
- — inherits STATE
- City
- — inherits STATE
ZIP-level market 45505
- Home prices YoY
- -34.3%
- Active inventory
- 158
- Price-to-rent
- 8.9×
Monthly cashflow live
- Estimated rent
- $1,129 medium interval (Pro) →
- Mortgage (P&I)
- −$629
- Tax from tax record
- −$262 /mo · $3,140/yr
- Insurance
- −$50
- HOA
- −$0
- Vacancy / Maint / Mgmt
- −$237
- Net cashflow
- $-49
Break-even live
Sensitivity live
| Price | -10% $19 | -5% $-15 | +0% $-49 | +5% $-83 | +10% $-117 |
|---|---|---|---|---|---|
| Rent | -10% $-138 | -5% $-93 | +0% $-49 | +5% $-4 | +10% $40 |
| Rate | -1.0pp $12 | -0.5pp $-18 | base $-49 | +0.5pp $-80 | +1.0pp $-111 |
UW: 25.0% down · 7.5% · 30yr · 1.5% tax · 5.0% vac · 8.0% maint · 8.0% mgmt
Financing live
Cash to close
- Down payment
- $29,975
- Closing costs
- $3,597
- Reserves months
- —
- Total cash needed
- —
Loan-product check · same deal, 3 products live
Conventional
25% down · 7.5% · 30yr
- Down + closing
- —
- Monthly P&I
- —
- Monthly cashflow
- —
- DSCR
- —
- Eligible?
- —
Personal DTI + credit; lowest rate.
DSCR
20% down · 8.5% · 30yr
- Down + closing
- —
- Monthly P&I
- —
- Monthly cashflow
- —
- DSCR
- —
- Eligible?
- —
No personal income docs; deal must DSCR.
Hard money
10% down · 12.0% · 12mo
- Down + closing
- —
- Monthly P&I
- —
- Monthly cashflow
- —
- DSCR
- —
- Eligible?
- —
Short-term bridge; refi at stabilization.
Rent comps 2 comps
| Address | Beds | Baths | Sqft | Rent | $/sqft | DOM | Units | Dist |
|---|---|---|---|---|---|---|---|---|
| 515 Ludlow Ave Springfield, OH | 3.0 | 1.0 | 1000 | $950 | $0.95 | 45d | 1 | 0.66mi |
| 127 N Belmont Ave Unit 1 Springfield, OH | 2.0 | 1.0 | 1052 | $1,050 | $1.00 | 3d | 1 | 0.89mi |
Listing history 3 events
-
2026-06-22statusdays on market $119,900 Pending 2 DOM
-
2026-06-18remarks 587-char remark
-
2026-06-18$119,900 Active 1 DOM
ⓘ Source: listings_history table (triggers on properties + properties_extension) + one-shot
backfill from property_details.listing_events for pre-trigger history.
Tax reassessment forecast OH · Partial reset (capped growth)
- Current annual tax
- $3,140 · $262/mo
- Projected year-2 tax
- $3,140 · $262/mo
- Expected delta
- $0/yr ($0/mo · 0.0%)
ⓘ Screening estimate from a state-policy table — verify with the county assessor before closing.
Climate risk First Street
- Flood 1/10 Low FEMA zone X (unshaded) · 0% chance over 30 yrs
- Wildfire 1/10 Low
- Heat 3/10 Moderate 7 d/yr ≥100°F today · 18 d/yr by 30 yrs out
- Wind 2/10 Low 0% chance of damaging wind over 30 yrs
- Air quality 3/10 Moderate 2 unhealthy d/yr today · 3 by 30 yrs out
Nearby sold comps map
Loading sold comps map…
Walkable amenities ~0.75 mi
Loading nearby amenities…
Taxation est. · year 1
- Rental income
- $13,544
- − Mortgage interest
- −$6,716
- − Property taxes
- −$3,140
- − Insurance
- −$600
- − Repairs & maintenance
- −$1,084
- − Management
- −$1,084
- − Depreciation
- −$3,488
- Taxable loss
- −$2,567
- Est. tax savings @ 24.0%
- +$616
- After-tax cash flow
- $31/yr
For passive investors: Depreciation is non-cash, so a rental often shows a tax loss while cash-flowing — sheltering income. Rental losses are passive: they offset passive income freely, and up to $25,000/yr can offset ordinary (W-2) income if you actively participate and your MAGI is under $100k (phasing out to $0 by $150k); unused losses carry forward. On sale, claimed depreciation is recaptured at up to 25%, and gains may owe capital-gains tax (a 1031 exchange can defer both). Figures are a year-1 estimate at your 24.0% rate — not tax advice; consult a CPA.
Schools (NCES district)
- District
- Springfield City School District
- NCES district ID
- 3904481
- Math proficiency
- 20% ▼ -16.00%
- Reading proficiency
- 27% ▼ -12.00%
- Median HH income
- $32,541
- Composite
- 19.12/100
- National rank
- #8834
- State rank
- #616 of 656 in OH
Livability — Springfield
- Score
- 56/100
- State rank
- #1108
- US rank
- #22551
Category grades
Schools grade is shown separately in the Schools card above.
Census & demographics
- Census place
- Springfield, OH
- County
- Clark County · 33,261 people
- City population
- 33,261
- Metro
- Springfield, OH
- Population (ZIP)
- 19,826
- Household income
- $43,819
- Rent vs Own
- Severe rent burden
- 950.0
Population outlook (Clark County) Hauer SSP2
- Today (2025)
- 130,703 people
- By 2030
- 126,952 · -2.9%
- By 2040
- 118,344 · -9.5%
- By 2050
- 109,590 · -16.2%
- By 2075
- 89,464 · -31.6%
- By 2100
- 68,810 · -47.4%
Race, ethnicity, and origin ACS 2023
- Neighborhood character
- Predominantly White (75%)
- Race & ethnicity
- White 75% Black 14% Two or more races 7% Hispanic / Latino 4%
- Common ancestry
- Slovak 1% German 1% Iranian 1%
- Foreign-born
- 2% · Canada
- Languages at home
- 96% English-only · Spanish 2% French/Haitian/Cajun 1% German/W. Germanic 1%
Political lean MEDSL · Clark
- 2024 margin
- Strong R (+29.5) · D 34.8% · R 64.3%
- 2008→2024 swing
- -27.0pp toward R · 2008: -2.5pp · 2024: -29.5pp
- All cycles
- 2024: R+29.5 2020: R+23.3 2016: R+19.5 2012: R+1.8 2008: R+2.5
Not yet ingested
- Civics
- —
Market trends
- HPI YoY
- ▼ -135.16%
- Current HPI
- 258.9037
- Rent YoY
- —
- Metro
- Springfield, OH
- State GDP YoY
- ▲ 1.98%
- F500 in state
- 48
Industry mix (Fortune 500 HQ in OH)
| Industry | F500 HQs | Revenue |
|---|---|---|
| Insurance | 3 | $145B |
|
||
| Industrial Machinery | 3 | $49B |
|
||
| Financial Services | 3 | $24B |
|
||
| Consumer Goods | 2 | $93B |
|
||
| Aerospace / Defense | 2 | $47B |
|
||
| Utilities | 2 | $33B |
|
||
Price history
+234.0% since first listed5 events — show timeline
- 2026-06-18 Listed $119,900 WRIST
- 2010-03-01 Sold (MLS) $67,000 WRIST
- 2009-09-15 Listed $71,900 WRIST
- 1990-09-19 Sold (Public Records) $43,900 Public Records
- 1986-07-17 Sold (Public Records) $35,900 Public Records
Property tax history
+10.5%/yrLatest (2025): $3,140 · +54.6% YoY. Source: county tax records.
Cash-flow waterfall
monthlySold comps — $/sqft
last 12 mo · ≤1 miLoading sold comps…