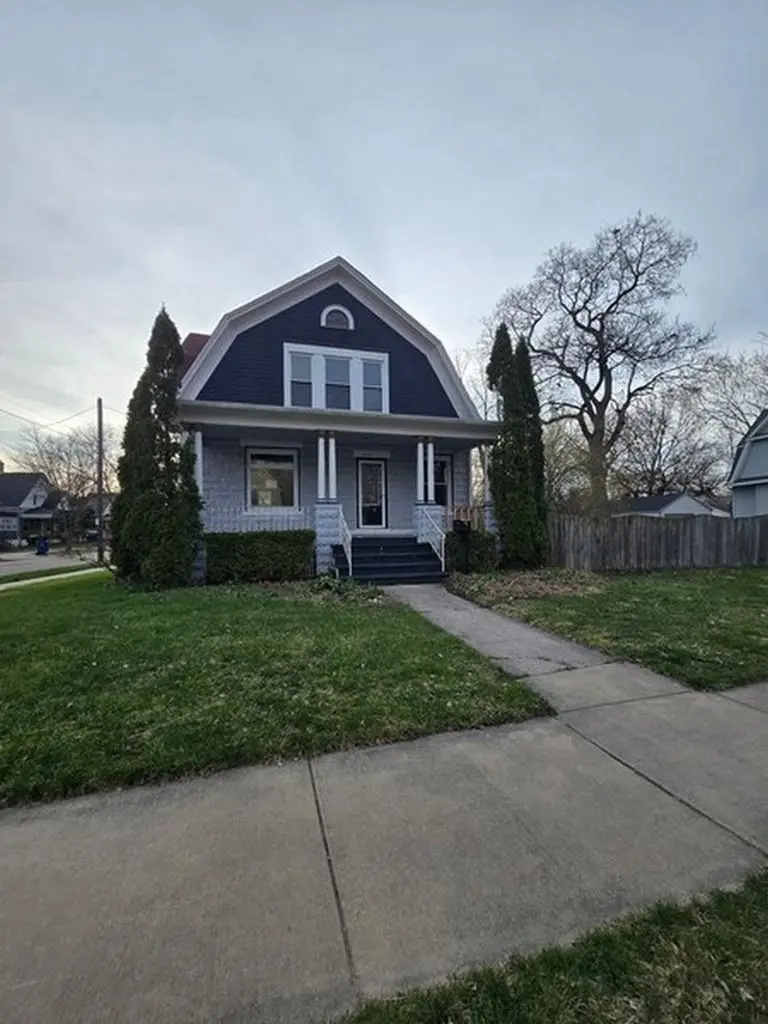
401 N Johnson St · Bay City, MI
Flood risk 1/10 · Minimal
- FEMA flood zone
- X (unshaded)
- Chance of flooding over 30 yrs
- 0.0%
- Est. flood insurance / yr
- $473 – $860
Fire risk 1/10 · Minimal
- Est. fire insurance / yr
- $784 – $1,456
Heat risk 2/10 · Minimal
- Hot days now (above 97°F)
- 7 days/yr
- Hot days in 30 yrs
- 14 days/yr
Wind risk 1/10 · Minimal
- Chance of severe wind over 30 yrs
- —
Air-quality risk 2/10 · Minimal
- Unhealthy air days now
- 1 days/yr
- Unhealthy air days in 30 yrs
- 2 days/yr
Risk factors via First Street. Map © Google.
Why this score? — see what drove the B+ grade
The composite is a weighted blend of 9 inputs, each scored 0–100. Each bar is that input's sub-score; the figure is the points it added to the 100-point composite (weight × sub-score).
- Cash flow +30.0/30.0
- ARV discount +15.0/15.0
- 1% rule +10.0/10.0
- DSCR +10.0/10.0
- Livability +3.4/5.0
- Schools +2.8/10.0
- Rent growth +2.5/5.0
- Condition / age +2.5/5.0
- Appreciation +0.0/10.0
$89,000
🖨 Deal sheet 📄 Offer letter ✓ Due diligence
Listing remarks
3 bed 2 bath on double lot! Fenced backyard w/ full basement. Victorian era home features dining room, some hardwood flooring and fireplace! 2 car detached garage for storage. Boiler maybe damaged. Hot Water heat. HUDhomestore.com
Key facts
- Hardwood flooring
- Full basement
- Dining room
Tags
Property features AI
Finance
- HOA & community: Sidewalks; Street lights
Exterior
- Parking: Detached 2-car garage
- Utilities: Public water; Public sanitary sewer; Cable available
- Home design: Residential 2-story home; Built in 1920; Basement present; Below-grade finished area noted
- Construction: Wood and cinder block exterior construction; Block basement foundation
- Exterior features: Paved street frontage; Road frontage (100')
Interior
- Kitchen: Kitchen on first floor — approximately 12 x 11, vinyl flooring; Dining room on first floor — approximately 15 x 14, wood flooring
- Bedrooms: Bedroom 1 (Second floor) — 15 x 12, carpet; Bedroom 2 (Second floor) — 12 x 15, carpet; Bedroom 3 (Second floor) — approximately 10' wide
- Flooring: Wood flooring in living and dining rooms; Carpet in main bedrooms; Vinyl in kitchen and first-floor lavatory
- Bathrooms: One full bathroom; One lavatory (total 2 baths/lavatories); First-floor lavatory with vinyl flooring; Second-floor bathroom
- Heating & cooling: Hot water heating via boiler; Natural gas fuel
- Interior features: Gas fireplace; Total of 9 rooms; Basement (block)
- Laundry & utility: Basement present (block foundation)
Neighborhood map
What this means for you Summary
Snapshot
- This is a 3-bed/1.5-bath single-family listed at $89k.
Deal economics
- At list price, monthly cash flow is $483 ($6k/yr) — positive.
- The deal already cash-flows at list — no discount required.
- Meets the 1% rule at list price ($1k rent vs $89k).
- Recommended offer: $86k (3.0% below list) — sets the bar for market timing.
- Cap rate 12.8% vs local median 5.5% in Bay City — top-decile yield for the area; either an underpriced asset or a hidden risk that comps aren't pricing in. Stress-test before assuming the spread holds.
Location & tenants
- Location reads 68/100 on livability (#360 in MI) — a middle-class / working-renter tenant base. Strengths: cost of living A+, housing A+, health & safety A+; Watch: schools D+, amenities D, crime F.
- Bay City School District (urban): math 27% / reading 40% proficiency, ranked #317 of 540 in MI (top 59%) — families likely to look elsewhere, expect single-tenant / working-renter base with shorter leases.
- Market conditions: 148 active listings in the ZIP; 1 comparable units currently listed for rent nearby; 39 units permitted in Bay County in 2024 (0 in 5+ unit buildings).
- This rent runs 33% of the median local income ($51k/yr) — at the standard rent-burdened threshold; future hikes will face affordability resistance.
Forward outlook
- Local home prices are declining (-3.0%/yr); year-one equity from $615 of loan paydown is wiped out by about $3k of value loss. Plan a longer hold.
- Bay County population projected at -21% by 2050 — secular population decline; favor cash flow + early exit over multi-decade hold.
- At projected returns (-3.0% appreciation + 3.0% rent growth), your $25k cash investment doubles in ~6 years — after that, you're playing with house money.
Negotiation context
- It's been on market 46 days — a 3% lower offer ($86k) is reasonable based on typical stale-listing flexibility.
- 5 sale attempts since 8y ago; this cycle's ask has dropped $41k (32%) from the opening price — seller is motivated, your offer sets the floor, not the list.
Risks & watch-outs
- Watch-outs: built in 1920 — expect roof / HVAC / electrical / plumbing capex.
Questions for the listing agent
- It's been on market 46 days. Have you received any prior offers? Is the seller open to a 3% concession, seller financing, or rate buy-down credit?
- Built in 1920 — when were the roof, HVAC, electrical panel, plumbing, and water heater last replaced?
- Is there a deadline driving the sale (1031 exchange, divorce, estate, relocation)? That informs how much negotiation room exists.
- Schools are D-rated, which usually means shorter tenancies and higher turnover. Who's the typical renter profile here, and what's been the actual vacancy rate?
- Crime grade is F in this area — have there been break-ins, vandalism, or insurance claims at this property in the last 3 years? What carrier currently insures it and at what premium?
- What's the average days-on-market for RENTAL listings here right now (not sales)? A rising rental-DOM trend means longer vacancies and softer asking-rent achievability than the comps imply.
- What's the recent tenant-quality profile in this submarket — average credit score on applications, eviction rate, late-payment / NSF rate, and stable-employment percentage? A property-management company in the area should have these aggregated.
- How much new for-sale + rental construction is in the pipeline within 1–3 miles? Heavy new supply typically softens prices + rents 12–24 months out; constrained supply supports both.
Investment metrics
- 1% rule
- 1.56% ✓
- Cap rate
- 12.81%
- Cash-on-cash
- 23.27%
- DSCR
- 2.04
- GRM
- 5.3
CMA / ARV
- ARV (median comp)
- $154,936
- List price
- $89,000
- Delta
- -42.56%
- Verdict
- UNDERPRICED
- Comps
- 20 within 1.0 mi
Show comp detail 12 sales within ~0.75 mi
| Address | Dist | Beds/Ba | Sqft | Sold | Price | $/sf | Match |
|---|---|---|---|---|---|---|---|
| 1713 9th St | 0.04mi | 3/2.0 | 1,633 (-4%) | 5mo | $130,000 | $80 | 86 |
| 1708 6th St | 0.19mi | 4/1.5 (+1) | 1,704 (+0%) | 6mo | $160,000 | $94 | 81 |
| 212 N McLellan St | 0.20mi | 4/2.0 (+1) | 1,746 (+3%) | 0mo | $125,000 | $72 | 79 |
| 109 N Johnson St | 0.20mi | 4/2.0 (+1) | 1,842 (+8%) | 1mo | $197,000 | $107 | 69 |
| 421 Harold St | 0.48mi | 3/1.0 | 1,762 (+4%) | 2mo | $120,000 | $68 | 68 |
| 2147 7th St | 0.41mi | 3/1.5 | 1,874 (+10%) | 5mo | $189,000 | $101 | 59 |
| 2229 7th St | 0.43mi | 3/2.0 | 1,888 (+11%) | 1mo | $60,000 | $32 | 59 |
| 76 Cedar Dr | 0.75mi | 2/1.5 (-1) | 1,656 (-3%) | 1mo | $160,000 | $97 | 55 |
| 1912 5th Blvd | 0.33mi | 4/1.5 (+1) | 1,921 (+13%) | 5mo | $80,000 | $42 | 54 |
| 407 S Jackson St | 0.74mi | 4/1.0 (+1) | 1,650 (-3%) | 4mo | $45,000 | $27 | 50 |
| 309 Harold St | 0.40mi | 4/1.0 (+1) | 1,452 (-15%) | 2mo | $111,500 | $77 | 48 |
| 2122 2nd St | 0.59mi | 4/1.5 (+1) | 1,511 (-11%) | 2mo | $140,000 | $93 | 47 |
Match score weights: distance 35% · size 25% · config 20% · recency 20%. Top-matched comps best support the ARV.
Projected returns pro-forma
-3.0% appreciation · 3.0% rent growth · sell at horizon
- IRR
- 16.3%
- Equity multiple
- 1.66×
- Total profit
- $16,380
- Equity at exit
- $13,270
- IRR
- 24.9%
- Equity multiple
- 3.17×
- Total profit
- $53,984
- Equity at exit
- $7,695
Cash invested: $24,920 (down + closing). Projections, not guarantees.
Landlord ↔ Tenant lean methodology
- Overall (STATE)
- 62 Landlord-Friendly
- State Michigan
- 62 Landlord-Friendly · EVEN
- County
- — inherits STATE
- City
- — inherits STATE
ZIP-level market 48708
- Home prices YoY
- -30.9%
- Active inventory
- 148
- Price-to-rent
- 5.3×
Monthly cashflow live
- Estimated rent
- $1,390 medium interval (Pro) →
- Mortgage (P&I)
- −$467
- Tax est. 1.5%
- −$111 /mo · $1,335/yr
- Insurance
- −$37
- HOA
- −$0
- Vacancy / Maint / Mgmt
- −$292
- Net cashflow
- $483
Break-even live
UW: 25.0% down · 7.5% · 30yr · 1.5% tax · 5.0% vac · 8.0% maint · 8.0% mgmt
Financing live
Cash to close
- Down payment
- $22,250
- Closing costs
- $2,670
- Reserves months
- —
- Total cash needed
- —
Loan-product check · same deal, 3 products live
Conventional
25% down · 7.5% · 30yr
- Down + closing
- —
- Monthly P&I
- —
- Monthly cashflow
- —
- DSCR
- —
- Eligible?
- —
Personal DTI + credit; lowest rate.
DSCR
20% down · 8.5% · 30yr
- Down + closing
- —
- Monthly P&I
- —
- Monthly cashflow
- —
- DSCR
- —
- Eligible?
- —
No personal income docs; deal must DSCR.
Hard money
10% down · 12.0% · 12mo
- Down + closing
- —
- Monthly P&I
- —
- Monthly cashflow
- —
- DSCR
- —
- Eligible?
- —
Short-term bridge; refi at stabilization.
Rent comps 1 comps
| Address | Beds | Baths | Sqft | Rent | $/sqft | DOM | Units | Dist |
|---|---|---|---|---|---|---|---|---|
| 1305 Washington Ave Bay City, MI | 2.0 | 1.0 | 635 | $1,675 | $2.64 | 43d | 1 | 1.07mi |
Listing history 36 events
-
2026-06-09status $89,000 Pending 46 DOM
-
2026-06-08days on market $89,000 Active 46 DOM
-
2026-06-07days on market $89,000 Active 45 DOM
-
2026-06-05pricedays on market $89,000 Active 42 DOM
-
2026-06-03days on market $130,000 Active 41 DOM
-
2026-06-02days on market $130,000 Active 40 DOM
-
2026-06-01days on market $130,000 Active 39 DOM
-
2026-05-31days on market $130,000 Active 38 DOM
-
2026-05-30days on market $130,000 Active 37 DOM
-
2026-04-23$130,000 Active 230-char remark
-
2025-02-01status Pending
-
2025-02-01status Pending
-
2025-01-31historical
-
2025-01-31historical
-
2025-01-24price $153,500
-
2025-01-24price $153,500
-
2025-01-09price $155,000
-
2025-01-08price $155,000
-
2024-12-28price $160,000
-
2024-12-28price $160,000
-
2024-11-07price $179,000
-
2024-11-07price $179,000
-
2024-10-30price $189,000
-
2024-10-30price $189,000
-
2024-10-17price $199,000
-
2024-10-17price $199,000
-
2024-09-01$205,000 Active
-
2024-09-01$205,000 Active
-
2021-10-29soldstatus $155,000
-
2021-09-17status Pending
-
2021-08-26price $155,000
-
2021-08-05historical Keep Showing-Contgcy Appl
-
2021-08-03$146,490 Active
-
2018-08-28historical
-
2018-06-24$119,900
-
2002-11-13soldstatus $124,900
ⓘ Source: listings_history table (triggers on properties + properties_extension) + one-shot
backfill from property_details.listing_events for pre-trigger history.
Climate risk First Street
- Flood 1/10 Low FEMA zone X (unshaded) · 0% chance over 30 yrs
- Wildfire 1/10 Low
- Heat 2/10 Low 7 d/yr ≥97°F today · 14 d/yr by 30 yrs out
- Wind 1/10 Low
- Air quality 2/10 Low 1 unhealthy d/yr today · 2 by 30 yrs out
Nearby sold comps map
Loading sold comps map…
Walkable amenities ~0.75 mi
Loading nearby amenities…
Taxation est. · year 1
- Rental income
- $16,684
- − Mortgage interest
- −$4,985
- − Property taxes
- −$1,335
- − Insurance
- −$445
- − Repairs & maintenance
- −$1,335
- − Management
- −$1,335
- − Depreciation
- −$2,589
- Taxable income
- $4,660
- Est. tax owed @ 24.0%
- −$1,118
- After-tax cash flow
- $4,681/yr
For passive investors: Depreciation is non-cash, so a rental often shows a tax loss while cash-flowing — sheltering income. Rental losses are passive: they offset passive income freely, and up to $25,000/yr can offset ordinary (W-2) income if you actively participate and your MAGI is under $100k (phasing out to $0 by $150k); unused losses carry forward. On sale, claimed depreciation is recaptured at up to 25%, and gains may owe capital-gains tax (a 1031 exchange can defer both). Figures are a year-1 estimate at your 24.0% rate — not tax advice; consult a CPA.
Schools (NCES district)
- District
- Bay City School District
- NCES district ID
- 2604260
- Math proficiency
- 27% ▼ -8.00%
- Reading proficiency
- 40% ▼ -4.00%
- Median HH income
- $43,833
- Composite
- 28.47/100
- National rank
- #6743
- State rank
- #317 of 540 in MI
Livability — Bay City
- Score
- 68/100
- State rank
- #360
- US rank
- #8912
Category grades
Schools grade is shown separately in the Schools card above.
Census & demographics
- Census place
- Bay City, MI
- County
- Bay County · 36,975 people
- City population
- 25,635
- Metro
- Bay City, MI
- Population (ZIP)
- 25,635
- Household income
- $50,518
- Rent vs Own
- Severe rent burden
- 528.0
Population outlook (Bay County) Hauer SSP2
- Today (2025)
- 101,476 people
- By 2030
- 98,152 · -3.3%
- By 2040
- 89,711 · -11.6%
- By 2050
- 80,614 · -20.6%
- By 2075
- 60,544 · -40.3%
- By 2100
- 41,603 · -59.0%
Race, ethnicity, and origin ACS 2023
- Neighborhood character
- Predominantly White (81%)
- Race & ethnicity
- White 81% Hispanic / Latino 11% Two or more races 10% Black 3%
- Hispanic origin (detail)
- Mexican 9%
- Common ancestry
- Romanian 17% Lithuanian 7% Slovak 2%
- Foreign-born
- 2% · Canada, South Korea
- Languages at home
- 96% English-only · Spanish 2% German/W. Germanic 1%
Political lean MEDSL · Bay
- 2024 margin
- R (+14.7) · D 42.0% · R 56.7% · Other 1.3%
- 2008→2024 swing
- -30.0pp toward R · 2008: 15.3pp · 2024: -14.7pp
- All cycles
- 2024: R+14.7 2020: R+11.6 2016: R+12.6 2012: D+6.0 2008: D+15.3
Not yet ingested
- Civics
- —
Market trends
- HPI YoY
- ▼ -82.21%
- Current HPI
- 183.5774
- Rent YoY
- —
- Metro
- Bay City, MI
- State GDP YoY
- ▲ 1.37%
- F500 in state
- 28
Industry mix (Fortune 500 HQ in MI)
| Industry | F500 HQs | Revenue |
|---|---|---|
| Automotive Parts | 3 | $48B |
|
||
| Automotive | 2 | $372B |
|
||
| Chemicals | 1 | $45B |
|
||
| Automotive Retail | 1 | $29B |
|
||
| Healthcare / Medical Devices | 1 | $23B |
|
||
| Automotive Technology | 1 | $20B |
|
||
Price history
-28.7% since first listed29 events — show timeline
- 2026-06-08 Pending — MiRealSource-MiMLS
- 2026-06-04 Price Changed $89,000 MiRealSource-MiMLS
- 2026-04-23 Listed $130,000 MiRealSource-MiMLS
- 2025-02-01 Pending — MiRealSource-MiMLS
- 2025-02-01 Pending — REALCOMP
- 2025-01-31 Listing Removed — REALCOMP
- 2025-01-31 Listing Removed — MiRealSource-MiMLS
- 2025-01-24 Price Changed $153,500 MiRealSource-MiMLS
- 2025-01-24 Price Changed $153,500 REALCOMP
- 2025-01-09 Price Changed $155,000 MiRealSource-MiMLS
- 2025-01-08 Price Changed $155,000 REALCOMP
- 2024-12-28 Price Changed $160,000 MiRealSource-MiMLS
- 2024-12-28 Price Changed $160,000 REALCOMP
- 2024-11-07 Price Changed $179,000 MiRealSource-MiMLS
- 2024-11-07 Price Changed $179,000 REALCOMP
- 2024-10-30 Price Changed $189,000 MiRealSource-MiMLS
- 2024-10-30 Price Changed $189,000 REALCOMP
- 2024-10-17 Price Changed $199,000 MiRealSource-MiMLS
- 2024-10-17 Price Changed $199,000 REALCOMP
- 2024-09-01 Listed $205,000 REALCOMP
- 2024-09-01 Listed $205,000 MiRealSource-MiMLS
- 2021-10-29 Sold (Public Records) $155,000 Public Records
- 2021-09-17 Pending — MiRealSource-MiMLS
- 2021-08-26 Price Changed $155,000 MiRealSource-MiMLS
- 2021-08-05 Contingent — MiRealSource-MiMLS
- 2021-08-03 Listed $146,490 MiRealSource-MiMLS
- 2018-08-28 Listing Removed — MiRealSource-MiMLS
- 2018-06-24 Listed $119,900 MiRealSource-MiMLS
- 2002-11-13 Sold (Public Records) $124,900 Public Records
Property tax history
+8.5%/yrLatest (2025): $4,558 · +42.7% YoY. Source: county tax records.
Cash-flow waterfall
monthlySold comps — $/sqft
last 12 mo · ≤1 miLoading sold comps…