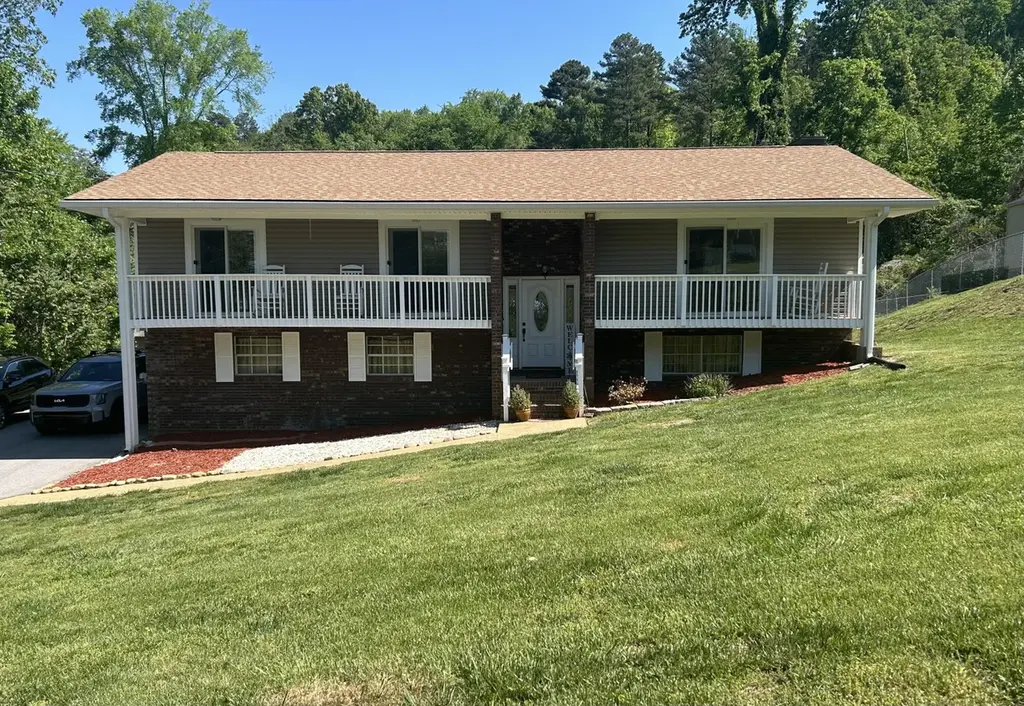
2932 Old Britain Cir · Chattanooga, TN
Flood risk 1/10 · Minimal
- FEMA flood zone
- X (unshaded)
- Chance of flooding over 30 yrs
- 0.0%
- Est. flood insurance / yr
- $507 – $1,088
Fire risk 3/10 · Minor
- Est. fire insurance / yr
- $949 – $1,763
Heat risk 5/10 · Moderate
- Hot days now (above 104°F)
- 6 days/yr
- Hot days in 30 yrs
- 15 days/yr
Wind risk 3/10 · Minor
- Chance of severe wind over 30 yrs
- 8.0%
Air-quality risk 3/10 · Minor
- Unhealthy air days now
- 2 days/yr
- Unhealthy air days in 30 yrs
- 3 days/yr
Risk factors via First Street. Map © Google.
Why this score? — see what drove the D+ grade
The composite is a weighted blend of 9 inputs, each scored 0–100. Each bar is that input's sub-score; the figure is the points it added to the 100-point composite (weight × sub-score).
- Cash flow +15.0/30.0
- ARV discount +15.0/15.0
- DSCR +4.6/10.0
- Livability +3.9/5.0
- 1% rule +2.9/10.0
- Schools +2.7/10.0
- Condition / age +2.5/5.0
- Rent growth +2.2/5.0
- Appreciation +0.0/10.0
$355,000
🖨 Deal sheet 📄 Offer letter ✓ Due diligence
Listing remarks
Welcome to this immaculate single-family home nestled in the highly desirable Cambridge Estates community, located within one of the area's most sought-after zip codes. Priced to sell quickly, this exceptional property offers the perfect combination of comfort, style, and convenience--and it won't last long. This residence has been meticulously maintained and enhanced. Featuring 4 spacious bedrooms and 3 full bathrooms, this home offers nearly 2,300 square feet of well-designed living space. Integral blinds throughout (window in window blinds). The interior showcases beautiful hardwood flooring and a tastefully updated kitchen, ideal for both everyday living and entertaining. Recent upgrade
Key facts
- 0.34 acre lot
- 2 garage spots
- Built 1974
Property features AI
Finance
- HOA & community: Curbs; Street lights; Publicly maintained asphalt county road frontage
Exterior
- Parking: Attached garage (2 spaces); Garage faces side; Garage door opener; Concrete driveway; Off-street parking
- Security: Carbon monoxide detector(s); Smoke detector(s); Closed-circuit cameras
- Utilities: Spring water source; Septic tank; Cable available and connected; Electricity available and connected; Natural gas available and connected; Phone available and connected; Water available and connected
- Home design: Single-family house; Updated / remodeled condition; Two levels; Main entry level listed as single story total; Shingle roof
- Construction: Aluminum siding, brick, concrete, stone, stucco, and wood siding; Slab foundation; Home warranty included
- Exterior features: Deck; Patio; Terrace; Back yard; Front yard; Cleared and landscaped lot; Gentle slope; Shed
Interior
- Kitchen: Stainless steel appliances; Microwave; Free-standing refrigerator; Free-standing electric range; Dishwasher; Pantry; Granite counters
- Flooring: Hardwood floors
- Bathrooms: Two full bathrooms; One half bathroom
- Heating & cooling: Central heating (electric); Central air conditioning (electric)
- Interior features: Central vacuum; Chandelier; Crown molding; Double vanity; Entrance foyer; Granite counters; High-speed internet; Pantry; Storage; Insulated windows; Wood-burning fireplace in the great room (1)
- Laundry & utility: Laundry located in the garage; Gas water heater
Neighborhood map
What this means for you Summary
Snapshot
- This is a 4-bed/3.0-bath single-family listed at $355k.
Deal economics
- At list price, monthly cash flow is $108 ($1k/yr) — positive.
- The deal already cash-flows at list — no discount required.
- To meet the 1% rule (rent ≥ 1% of price), the offer needs to be $281k (20.8% below list).
- Recommended offer: $281k (20.8% below list) — sets the bar for 1% rule.
- Cap rate 6.7% vs local median 3.4% in Chattanooga — top-decile yield for the area; either an underpriced asset or a hidden risk that comps aren't pricing in. Stress-test before assuming the spread holds.
Location & tenants
- Location reads 78/100 on livability (#3 in TN, #2,582 nationally) — a middle-class / working-renter tenant base. Strengths: amenities A+, commute A+, cost of living A+; Watch: employment D+, crime F.
- Hamilton County (urban): math 31% / reading 31% proficiency, ranked #42 of 139 in TN (top 30%) — families likely to look elsewhere, expect single-tenant / working-renter base with shorter leases.
- Zoned schools: Wolftever Creek Elementary (math 26% / reading 30%, grade F, #482 of 952 statewide, top 51%, 602 students, 0% FRL); Ooltewah Middle School (math 20% / reading 21%, grade F, #194 of 333 statewide, top 59%, 519 students, 0% FRL); Ooltewah High School (math 9% / reading 39%, grade F, #144 of 332 statewide, top 43%, 1,266 students, 0% FRL) — zoned schools average 0% FRL vs 52% district-wide (52 pts lower); this property's tenant base skews higher-income than the district average.
- Market conditions: Rents soft (-1.0%/yr); 572 active listings in the ZIP; 5 comparable units currently listed for rent nearby; rentals leasing fast (median 14d on market — plan ~1-2 weeks tenant-placement turnaround); solid renter incomes; 2,133 units permitted in Hamilton County in 2024 (405 in 5+ unit buildings).
- This rent runs 41% of the median local income ($83k/yr) — at the standard rent-burdened threshold; future hikes will face affordability resistance.
Forward outlook
- Local home prices are declining (-3.0%/yr); year-one equity from $2k of loan paydown is wiped out by about $11k of value loss. Plan a longer hold.
- Hamilton County population projected at +23% by 2050 — long-run rental-demand tailwind backs the buy-and-hold thesis.
Negotiation context
- It's been on market 55 days — a 3% lower offer ($344k) is reasonable based on typical stale-listing flexibility.
- Current owner paid $84k; list at $355k implies a 323% gain — meaningful room to come down on a strong offer.
Risks & watch-outs
- Climate carrying-cost: extreme-heat days projected 6→15/yr by 2055 (HVAC capex compounding) — expect insurance premiums to compound above CPI over the hold.
Questions for the listing agent
- It's been on market 55 days. Have you received any prior offers? Is the seller open to a 21% concession, seller financing, or rate buy-down credit?
- Built in 1974 — when were the roof, HVAC, electrical panel, plumbing, and water heater last replaced?
- Is there a deadline driving the sale (1031 exchange, divorce, estate, relocation)? That informs how much negotiation room exists.
- Schools are F-rated, which usually means shorter tenancies and higher turnover. Who's the typical renter profile here, and what's been the actual vacancy rate?
- Crime grade is F in this area — have there been break-ins, vandalism, or insurance claims at this property in the last 3 years? What carrier currently insures it and at what premium?
- The area grade is low — what's the realistic commute time and amenity access for the typical tenant pool here? Any planned neighborhood developments (good or bad) we should know about?
- What's the average days-on-market for RENTAL listings here right now (not sales)? A rising rental-DOM trend means longer vacancies and softer asking-rent achievability than the comps imply.
- What's the recent tenant-quality profile in this submarket — average credit score on applications, eviction rate, late-payment / NSF rate, and stable-employment percentage? A property-management company in the area should have these aggregated.
- How much new for-sale + rental construction is in the pipeline within 1–3 miles? Heavy new supply typically softens prices + rents 12–24 months out; constrained supply supports both.
Investment metrics
- 1% rule
- 0.79% ✗
- Cap rate
- 6.66%
- Cash-on-cash
- 1.30%
- DSCR
- 1.06
- GRM
- 10.5
CMA / ARV
- ARV (on-the-fly)
- $433,188
- Comps found
- 10
Show comp detail 10 sales within ~0.75 mi
| Address | Dist | Beds/Ba | Sqft | Sold | Price | $/sf | Match |
|---|---|---|---|---|---|---|---|
| 2942 Old Britain Cir | 0.07mi | 4/3.0 | 2,316 (+2%) | 4mo | $289,000 | $125 | 90 |
| 2896 Old Britain Cir | 0.19mi | 4/3.0 | 2,148 (-5%) | 12mo | $410,000 | $191 | 72 |
| 2892 Old Britain Cir | 0.22mi | 4/2.0 | 2,222 (-2%) | 12mo | $400,000 | $180 | 72 |
| 8125 Burgundy Cir | 0.29mi | 4/3.5 | 2,415 (+6%) | 4mo | $490,000 | $203 | 70 |
| 8188 Burgundy Cir | 0.21mi | 4/2.5 | 2,565 (+13%) | 8mo | $650,000 | $253 | 60 |
| 2643 Butlers Green Circle Cir | 0.67mi | 4/3.0 | 2,404 (+6%) | 8mo | $537,424 | $224 | 52 |
| 2506 Sharron Dr | 0.63mi | 4/3.0 | 2,204 (-3%) | 19mo | $440,000 | $200 | 50 |
| 2416 Hickory Ridge Dr | 0.73mi | 4/2.0 | 2,100 (-7%) | 6mo | $350,000 | $167 | 44 |
| 4011 Shady Oak Dr | 0.52mi | 4/2.0 | 1,951 (-14%) | 6mo | $315,000 | $161 | 44 |
| 7738 Pinewood Dr | 0.67mi | 3/2.5 (-1) | 2,000 (-12%) | 2mo | $370,000 | $185 | 41 |
Match score weights: distance 35% · size 25% · config 20% · recency 20%. Top-matched comps best support the ARV.
Projected returns pro-forma
-3.0% appreciation · 0.0% rent growth · sell at horizon
- IRR
- -17.2%
- Equity multiple
- 0.41×
- Total profit
- $-59,070
- Equity at exit
- $52,932
- IRR
- -15.1%
- Equity multiple
- 0.24×
- Total profit
- $-75,111
- Equity at exit
- $30,694
Cash invested: $99,400 (down + closing). Projections, not guarantees.
Landlord ↔ Tenant lean methodology
- Overall (STATE)
- 87 Strongly Landlord-Friendly
- State Tennessee
- 87 Strongly Landlord-Friendly · R+13
- County
- — inherits STATE
- City
- — inherits STATE
ZIP-level market 37421
- Rents YoY
- -1.0%
- Active inventory
- 572
- Price-to-rent
- 10.5×
Monthly cashflow live
- Estimated rent
- $2,810 high interval (Pro) →
- Mortgage (P&I)
- −$1,862
- Tax from tax record
- −$103 /mo · $1,232/yr
- Insurance
- −$148
- HOA
- −$0
- Vacancy / Maint / Mgmt
- −$590
- Net cashflow
- $108
Break-even live
UW: 25.0% down · 7.5% · 30yr · 1.5% tax · 5.0% vac · 8.0% maint · 8.0% mgmt
Financing live
Cash to close
- Down payment
- $88,750
- Closing costs
- $10,650
- Reserves months
- —
- Total cash needed
- —
Loan-product check · same deal, 3 products live
Conventional
25% down · 7.5% · 30yr
- Down + closing
- —
- Monthly P&I
- —
- Monthly cashflow
- —
- DSCR
- —
- Eligible?
- —
Personal DTI + credit; lowest rate.
DSCR
20% down · 8.5% · 30yr
- Down + closing
- —
- Monthly P&I
- —
- Monthly cashflow
- —
- DSCR
- —
- Eligible?
- —
No personal income docs; deal must DSCR.
Hard money
10% down · 12.0% · 12mo
- Down + closing
- —
- Monthly P&I
- —
- Monthly cashflow
- —
- DSCR
- —
- Eligible?
- —
Short-term bridge; refi at stabilization.
Rent comps 5 comps
| Address | Beds | Baths | Sqft | Rent | $/sqft | DOM | Units | Dist |
|---|---|---|---|---|---|---|---|---|
| 2945 Old Britain Cir Chattanooga, TN | 4.0 | 2.5 | 2048 | $2,450 | $1.20 | 23d | 1 | 0.06mi |
| 4046 Brock Rd Chattanooga, TN | 4.0 | 2.5 | 2777 | $4,300 | $1.55 | 23d | 1 | 0.21mi |
| 2520 Sharron Dr Chattanooga, TN | 3.0 | 2.5 | 3019 | $2,400 | $0.79 | 13d | 1 | 0.47mi |
| 2419 Jenkins Rd Chattanooga, TN | 4.0 | 3.0 | 3100 | $4,500 | $1.45 | 13d | 1 | 0.71mi |
| 2011 Miramar Cir Chattanooga, TN | 2.0–3.0 | 2.5 | 1535 | $2,647 | $1.72 | 13d | 14 | 1.34mi |
Listing history 19 events
-
2026-06-18days on market $355,000 Active 55 DOM
-
2026-06-17days on market $355,000 Active 54 DOM
-
2026-06-16days on market $355,000 Active 53 DOM
-
2026-06-15pricedays on market $355,000 Active 52 DOM
-
2026-06-14days on market $365,000 Active 50 DOM
-
2026-06-10days on market $365,000 Active 47 DOM
-
2026-06-09days on market $365,000 Active 46 DOM
-
2026-06-08days on market $365,000 Active 45 DOM
-
2026-06-07days on market $365,000 Active 44 DOM
-
2026-06-05days on market $365,000 Active 41 DOM
-
2026-06-03days on market $365,000 Active 40 DOM
-
2026-06-02days on market $365,000 Active 39 DOM
-
2026-06-01days on market $365,000 Active 38 DOM
-
2026-05-31days on market $365,000 Active 37 DOM
-
2026-05-30days on market $365,000 Active 36 DOM
-
2026-05-15price $365,000
-
2026-04-24$375,000 Active
-
2026-04-23historical $375,000
-
1989-05-03soldstatus $84,000
ⓘ Source: listings_history table (triggers on properties + properties_extension) + one-shot
backfill from property_details.listing_events for pre-trigger history.
Tax reassessment forecast TN · Resets to sale price
- Current annual tax
- $1,232 · $103/mo
- Projected year-2 tax
- $2,520 · $210/mo
- Expected delta
- +$1,288/yr (+$107/mo · 104.6%)
ⓘ Screening estimate from a state-policy table — verify with the county assessor before closing.
Climate risk First Street
- Flood 1/10 Low FEMA zone X (unshaded) · 0% chance over 30 yrs
- Wildfire 3/10 Moderate
- Heat 5/10 Major 6 d/yr ≥104°F today · 15 d/yr by 30 yrs out
- Wind 3/10 Moderate 8% chance of damaging wind over 30 yrs
- Air quality 3/10 Moderate 2 unhealthy d/yr today · 3 by 30 yrs out
Nearby sold comps map
Loading sold comps map…
Walkable amenities ~0.75 mi
Loading nearby amenities…
Taxation est. · year 1
- Rental income
- $33,720
- − Mortgage interest
- −$19,886
- − Property taxes
- −$1,232
- − Insurance
- −$1,775
- − Repairs & maintenance
- −$2,698
- − Management
- −$2,698
- − Depreciation
- −$10,327
- Taxable loss
- −$4,895
- Est. tax savings @ 24.0%
- +$1,175
- After-tax cash flow
- $2,467/yr
For passive investors: Depreciation is non-cash, so a rental often shows a tax loss while cash-flowing — sheltering income. Rental losses are passive: they offset passive income freely, and up to $25,000/yr can offset ordinary (W-2) income if you actively participate and your MAGI is under $100k (phasing out to $0 by $150k); unused losses carry forward. On sale, claimed depreciation is recaptured at up to 25%, and gains may owe capital-gains tax (a 1031 exchange can defer both). Figures are a year-1 estimate at your 24.0% rate — not tax advice; consult a CPA.
Schools (NCES district)
- District
- Hamilton County
- NCES district ID
- 4701590
- Math proficiency
- 31% ▼ -10.00%
- Reading proficiency
- 31% ▼ -3.00%
- Median HH income
- $47,456
- Composite
- 26.8/100
- National rank
- #7122
- State rank
- #42 of 139 in TN
Livability — Chattanooga
- Score
- 78/100
- State rank
- #3
- US rank
- #2582
Category grades
Schools grade is shown separately in the Schools card above.
Census & demographics
- County
- Hamilton County · 312,777 people
- City population
- 131,999
- Metro
- Chattanooga, TN-GA
- Population (ZIP)
- 52,985
- Household income
- $82,517
- Rent vs Own
- Severe rent burden
- 1975.0
Population outlook (Hamilton County) Hauer SSP2
- Today (2025)
- 393,784 people
- By 2030
- 412,983 · +4.9%
- By 2040
- 449,502 · +14.1%
- By 2050
- 484,341 · +23.0%
- By 2075
- 565,746 · +43.7%
- By 2100
- 618,394 · +57.0%
Race, ethnicity, and origin ACS 2023
- Neighborhood character
- Diverse neighborhood (Simpson 0.56)
- Race & ethnicity
- White 61% Black 23% Hispanic / Latino 8% Two or more races 6% Asian 5%
- Hispanic origin (detail)
- Mexican 5%
- Common ancestry
- Italian 2% Slovak 2% Serbian 2%
- Foreign-born
- 9% · Canada, South Korea, Vietnam
- Languages at home
- 88% English-only · Spanish 6% Other Indo-European 2% Other Asian/Pacific 1%
Political lean MEDSL · Hamilton
- 2024 margin
- R (+13.1) · D 42.7% · R 55.7% · Other 1.6%
- 2008→2024 swing
- -1.2pp toward R · 2008: -11.8pp · 2024: -13.1pp
- All cycles
- 2024: R+13.1 2020: R+9.7 2016: R+16.6 2012: R+14.8 2008: R+11.8
Not yet ingested
- Civics
- —
Market trends
- HPI YoY
- ▼ -316.60%
- Current HPI
- 237.6897
- Rent YoY
- ▼ -1.04%
- Metro
- Chattanooga, TN-GA
- State GDP YoY
- ▲ 2.78%
- F500 in state
- 22
Industry mix (Fortune 500 HQ in TN)
| Industry | F500 HQs | Revenue |
|---|---|---|
| Healthcare | 3 | $91B |
|
||
| Retail | 3 | $72B |
|
||
| Transportation / Logistics | 1 | $88B |
|
||
| Paper / Packaging | 1 | $19B |
|
||
| Insurance | 1 | $13B |
|
||
| Energy | 1 | $12B |
|
||
Price history
+334.5% since first listed4 events — show timeline
- 2026-05-15 Price Changed $365,000 GCAR
- 2026-04-24 Listed $375,000 GCAR
- 2026-04-23 Coming Soon $375,000 GCAR
- 1989-05-03 Sold (Public Records) $84,000 Public Records
Property tax history
+1.4%/yrLatest (2025): $1,232 · +9.6% YoY. Source: county tax records.
Cash-flow waterfall
monthlySold comps — $/sqft
last 12 mo · ≤1 miLoading sold comps…