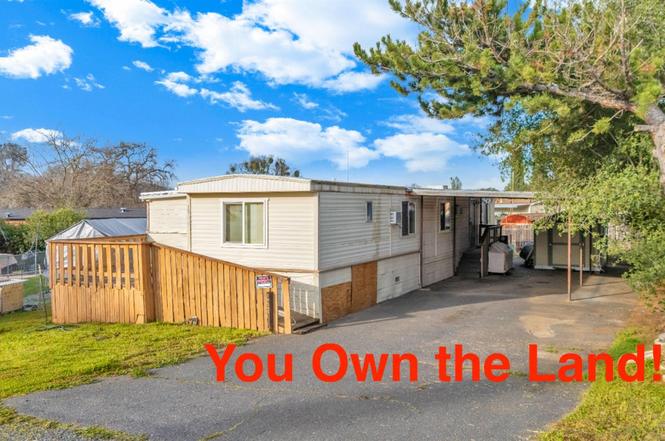
1028 Morado Cir · Copperopolis, CA
Flood risk 1/10 · Minimal
- FEMA flood zone
- X (unshaded)
- Chance of flooding over 30 yrs
- 0.0%
- Est. flood insurance / yr
- $507 – $1,088
Fire risk 9/10 · Severe
- Est. fire insurance / yr
- $659 – $1,223
Heat risk 7/10 · Major
- Hot days now (above 103°F)
- 7 days/yr
- Hot days in 30 yrs
- 16 days/yr
Wind risk 1/10 · Minimal
- Chance of severe wind over 30 yrs
- —
Air-quality risk 10/10 · Severe
- Unhealthy air days now
- 30 days/yr
- Unhealthy air days in 30 yrs
- 35 days/yr
Risk factors via First Street. Map © Google.
Why this score? — see what drove the B+ grade
The composite is a weighted blend of 9 inputs, each scored 0–100. Each bar is that input's sub-score; the figure is the points it added to the 100-point composite (weight × sub-score).
- Cash flow +30.0/30.0
- ARV discount +15.0/15.0
- 1% rule +10.0/10.0
- DSCR +10.0/10.0
- Schools +4.5/10.0
- Livability +2.9/5.0
- Rent growth +2.5/5.0
- Condition / age +2.5/5.0
- Appreciation +0.0/10.0
$85,000
🖨 Deal sheet 📄 Offer letter ✓ Due diligence
Listing remarks
Investment Opportunity, Now accepting Cash only Offers! Located in Copper Cove HOA this Mobile home is on owned land. No space rent! Home features 2 bedrooms 2 bath, Guest bath has new shower insert. Large added on bonus room not included in square footage. This is a great addition to the home for additional space for a family room, play room, home gym or an additional bedroom. The kitchen is open to the living/family room. Large recently rebuilt covered carport for dry parking. Level mostly fenced yard. Small shed included. Some repairs are needed inquire for further details. With Copper Cove HOA enjoy member only community pool, access to Lake Tulloch via Kiva Boat launch and day use swim
Key facts
- Added on bonus room
- Community pool
- Covered carport
Tags
Property features AI
Finance
- HOA & community: Mandatory association; Monthly association fee ($51); Community amenities: playground, pool, recreation facilities, game court, gym (see remarks)
Exterior
- Parking: Covered parking
- Utilities: Public sewer; Public water (Water District); 220V in kitchen
- Home design: Manufactured home, detached; Fixer condition; Built in 1981; Flat roof
- Construction: Flat roof
- Exterior features: Partial fencing; Low-maintenance lot; Shed(s)
Interior
- Kitchen: Kitchen/family room combo; Tile countertops; Dishwasher; Free-standing electric range
- Bedrooms: 2 bedrooms; Master bedroom with closet
- Flooring: Carpet; Simulated wood
- Bathrooms: 2 full bathrooms; Shower stall(s) in master bath and other bath(s)
- Heating & cooling: Central heating; Electric heating; Wall unit(s) cooling; Evaporative cooler
- Interior features: Storage areas; Front porch; One-level layout (1 story)
- Laundry & utility: Inside laundry room; Dryer included; Electric water heater; 220V in laundry
Neighborhood map
What this means for you Summary
Snapshot
- This is a 2-bed/1.0-bath manufactured listed at $85k.
Deal economics
- At list price, monthly cash flow is $944 ($11k/yr) — positive.
- The deal already cash-flows at list — no discount required.
- Meets the 1% rule at list price ($2k rent vs $85k).
- Recommended offer: $77k (9.0% below list) — sets the bar for market timing.
- Cap rate 19.6% vs local median 2.0% in Copperopolis — top-decile yield for the area; either an underpriced asset or a hidden risk that comps aren't pricing in. Stress-test before assuming the spread holds.
Location & tenants
- Location reads 58/100 on livability (#691 in CA) — a working-class tenant base; expect higher turnover. Strengths: housing A+, employment A-, crime B+; Watch: schools D+, amenities F, commute F.
- Bret Harte Union High (town): math 35% / reading 65% proficiency, ranked #429 of 1,400 in CA (top 31%) — acceptable for families but not a draw, mixed tenant base, ~2y average lease.
- Market conditions: 235 active listings in the ZIP; 77 units permitted in Calaveras County in 2024 (0 in 5+ unit buildings).
Forward outlook
- Local home prices are declining (-3.0%/yr); year-one equity from $588 of loan paydown is wiped out by about $3k of value loss. Plan a longer hold.
- Calaveras County population projected at -18% by 2050 — secular population decline; favor cash flow + early exit over multi-decade hold.
- At projected returns (-3.0% appreciation + 3.0% rent growth), your $24k cash investment doubles in ~3 years — after that, you're playing with house money.
Negotiation context
- It's been on market 94 days — a 9% lower offer ($77k) is reasonable based on typical stale-listing flexibility.
- Current owner paid $33k; list at $85k implies a 160% gain — meaningful room to come down on a strong offer.
Risks & watch-outs
- Climate carrying-cost: severe wildfire risk; extreme-heat days projected 7→16/yr by 2055 (HVAC capex compounding) — expect insurance premiums to compound above CPI over the hold.
Questions for the listing agent
- It's been on market 94 days. Have you received any prior offers? Is the seller open to a 9% concession, seller financing, or rate buy-down credit?
- What does the HOA fee cover, when was the last increase, and are there any pending special assessments or reserve-fund shortfalls?
- Why hasn't it sold? Are there any deal-killer items the seller is aware of (foundation, flood, title, zoning, code violations)?
- Is there a deadline driving the sale (1031 exchange, divorce, estate, relocation)? That informs how much negotiation room exists.
- Schools are D-rated, which usually means shorter tenancies and higher turnover. Who's the typical renter profile here, and what's been the actual vacancy rate?
- What's the average days-on-market for RENTAL listings here right now (not sales)? A rising rental-DOM trend means longer vacancies and softer asking-rent achievability than the comps imply.
- What's the recent tenant-quality profile in this submarket — average credit score on applications, eviction rate, late-payment / NSF rate, and stable-employment percentage? A property-management company in the area should have these aggregated.
- How much new for-sale + rental construction is in the pipeline within 1–3 miles? Heavy new supply typically softens prices + rents 12–24 months out; constrained supply supports both.
Investment metrics
- 1% rule
- 2.37% ✓
- Cap rate
- 19.61%
- Cash-on-cash
- 47.57%
- DSCR
- 3.12
- GRM
- 3.5
CMA / ARV
- ARV (on-the-fly)
- $153,592
- Comps found
- 4
Show comp detail 4 sales within ~0.75 mi
| Address | Dist | Beds/Ba | Sqft | Sold | Price | $/sf | Match |
|---|---|---|---|---|---|---|---|
| 954 Morado Cir | 0.09mi | 2/2.0 | 1,050 (-0%) | 9mo | $137,500 | $131 | 84 |
| 976 Morado Cir | 0.08mi | 3/2.0 (+1) | 1,020 (-3%) | 5mo | $149,000 | $146 | 78 |
| 923 Morado Cir | 0.07mi | 3/2.0 (+1) | 960 (-9%) | 7mo | $141,500 | $147 | 67 |
| 979 Morado Cir #123 | 0.06mi | 2/1.0 | 1,196 (+14%) | 22mo | $128,000 | $107 | 56 |
Match score weights: distance 35% · size 25% · config 20% · recency 20%. Top-matched comps best support the ARV.
Projected returns pro-forma
-3.0% appreciation · 3.0% rent growth · sell at horizon
- IRR
- 45.0%
- Equity multiple
- 2.95×
- Total profit
- $46,386
- Equity at exit
- $12,674
- IRR
- 50.9%
- Equity multiple
- 5.96×
- Total profit
- $118,040
- Equity at exit
- $7,349
Cash invested: $23,800 (down + closing). Projections, not guarantees.
Landlord ↔ Tenant lean methodology
- Overall (STATE)
- 18 Strongly Tenant-Friendly
- State California
- 18 Strongly Tenant-Friendly · D+13
- County
- — inherits STATE
- City
- — inherits STATE
ZIP-level market 95228
- Active inventory
- 235
- Price-to-rent
- 3.5×
Monthly cashflow live
- Estimated rent
- $2,011 medium interval (Pro) →
- Mortgage (P&I)
- −$446
- Tax from tax record
- −$113 /mo · $1,352/yr
- Insurance
- −$35
- HOA
- −$51
- Vacancy / Maint / Mgmt
- −$422
- Net cashflow
- $944
Break-even live
UW: 25.0% down · 7.5% · 30yr · 1.5% tax · 5.0% vac · 8.0% maint · 8.0% mgmt
Financing live
Cash to close
- Down payment
- $21,250
- Closing costs
- $2,550
- Reserves months
- —
- Total cash needed
- —
Loan-product check · same deal, 3 products live
Conventional
25% down · 7.5% · 30yr
- Down + closing
- —
- Monthly P&I
- —
- Monthly cashflow
- —
- DSCR
- —
- Eligible?
- —
Personal DTI + credit; lowest rate.
DSCR
20% down · 8.5% · 30yr
- Down + closing
- —
- Monthly P&I
- —
- Monthly cashflow
- —
- DSCR
- —
- Eligible?
- —
No personal income docs; deal must DSCR.
Hard money
10% down · 12.0% · 12mo
- Down + closing
- —
- Monthly P&I
- —
- Monthly cashflow
- —
- DSCR
- —
- Eligible?
- —
Short-term bridge; refi at stabilization.
HOA detail
- Monthly dues
- $51 · $612/yr
- Likely covers
- poolgym
Listing history 1 events
-
2011-12-02soldstatus $32,727
ⓘ Source: listings_history table (triggers on properties + properties_extension) + one-shot
backfill from property_details.listing_events for pre-trigger history.
Tax reassessment forecast CA · Resets to sale price
- Current annual tax
- $1,352 · $113/mo
- Projected year-2 tax
- $1,352 · $113/mo
- Expected delta
- $0/yr ($0/mo · 0.0%)
ⓘ Screening estimate from a state-policy table — verify with the county assessor before closing.
Climate risk First Street
- Flood 1/10 Low FEMA zone X (unshaded) · 0% chance over 30 yrs
- Wildfire 9/10 Extreme
- Heat 7/10 Severe 7 d/yr ≥103°F today · 16 d/yr by 30 yrs out
- Wind 1/10 Low
- Air quality 10/10 Extreme 30 unhealthy d/yr today · 35 by 30 yrs out
Nearby sold comps map
Loading sold comps map…
Walkable amenities ~0.75 mi
Loading nearby amenities…
Taxation est. · year 1
- Rental income
- $24,127
- − Mortgage interest
- −$4,761
- − Property taxes
- −$1,352
- − Insurance
- −$425
- − Repairs & maintenance
- −$1,930
- − Management
- −$1,930
- − HOA
- −$612
- − Depreciation
- −$2,473
- Taxable income
- $10,644
- Est. tax owed @ 24.0%
- −$2,555
- After-tax cash flow
- $8,768/yr
For passive investors: Depreciation is non-cash, so a rental often shows a tax loss while cash-flowing — sheltering income. Rental losses are passive: they offset passive income freely, and up to $25,000/yr can offset ordinary (W-2) income if you actively participate and your MAGI is under $100k (phasing out to $0 by $150k); unused losses carry forward. On sale, claimed depreciation is recaptured at up to 25%, and gains may owe capital-gains tax (a 1031 exchange can defer both). Figures are a year-1 estimate at your 24.0% rate — not tax advice; consult a CPA.
Schools (NCES district)
- District
- Bret Harte Union High
- NCES district ID
- 0605940
- Math proficiency
- 35% ▲ 5.00%
- Reading proficiency
- 65% ▲ 5.00%
- Median HH income
- $56,974
- Composite
- 45.41/100
- National rank
- #5708
- State rank
- #429 of 1400 in CA
Livability — Copperopolis
- Score
- 58/100
- State rank
- #691
- US rank
- #21010
Category grades
Schools grade is shown separately in the Schools card above.
Census & demographics
- Census place
- Copperopolis, CA
- Population (ZIP)
- 4,880
Population outlook (Calaveras County) Hauer SSP2
- Today (2025)
- 43,163 people
- By 2030
- 41,703 · -3.4%
- By 2040
- 38,202 · -11.5%
- By 2050
- 35,385 · -18.0%
- By 2075
- 30,807 · -28.6%
- By 2100
- 25,755 · -40.3%
Race, ethnicity, and origin ACS 2023
- Neighborhood character
- Predominantly White (71%)
- Race & ethnicity
- White 71% Hispanic / Latino 25% Two or more races 15% Black 2%
- Hispanic origin (detail)
- Mexican 21%
- Common ancestry
- Iranian 4% Romanian 4% Russian 3%
- Foreign-born
- 3% · Canada
- Languages at home
- 91% English-only · Spanish 9% Tagalog/Filipino 1%
Political lean MEDSL · Calaveras
- 2024 margin
- Strong R (+28.1) · D 34.7% · R 62.8% · Other 2.5%
- 2008→2024 swing
- -15.2pp toward R · 2008: -13.0pp · 2024: -28.1pp
- All cycles
- 2024: R+28.1 2020: R+23.8 2016: R+23.9 2012: R+17.0 2008: R+13.0
Not yet ingested
- Civics
- —
Market trends
- HPI YoY
- ▼ -141.73%
- Current HPI
- 176.1251
- Rent YoY
- —
- Metro
- —
- State GDP YoY
- ▲ 3.21%
- F500 in state
- 116
Industry mix (Fortune 500 HQ in CA)
| Industry | F500 HQs | Revenue |
|---|---|---|
| Technology | 27 | $1,492B |
|
||
| Financial Services | 3 | $174B |
|
||
| Retail | 3 | $44B |
|
||
| Insurance | 3 | $26B |
|
||
| Media / Entertainment | 2 | $115B |
|
||
| Pharmaceuticals / Biotech | 2 | $62B |
|
||
Price history
1 event — show timeline
- 2011-12-02 Sold (Public Records) $32,727 Public Records
Property tax history
+6.8%/yrLatest (2025): $1,352 · -3.0% YoY. Source: county tax records.
Cash-flow waterfall
monthlySold comps — $/sqft
last 12 mo · ≤1 miLoading sold comps…