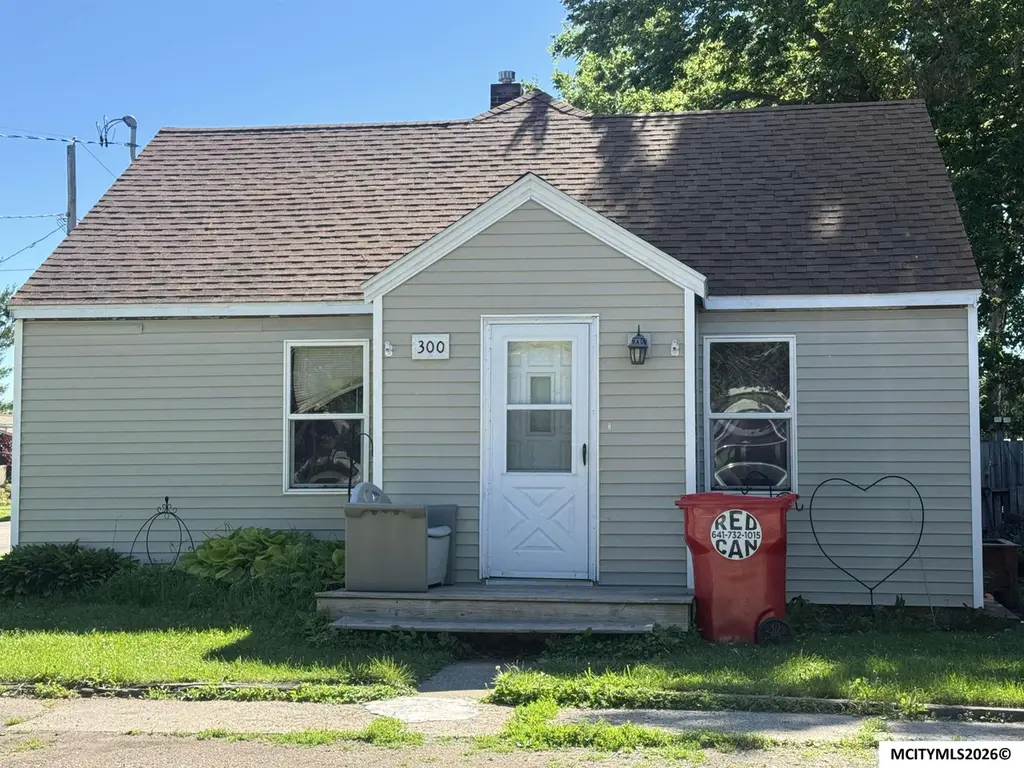
300 5th St St · Rudd, IA
Flood risk 1/10 · Minimal
- FEMA flood zone
- X (unshaded)
- Chance of flooding over 30 yrs
- 0.0%
- Est. flood insurance / yr
- $507 – $1,088
Fire risk 1/10 · Minimal
- Est. fire insurance / yr
- $902 – $1,676
Heat risk 2/10 · Minimal
- Hot days now (above 100°F)
- 7 days/yr
- Hot days in 30 yrs
- 16 days/yr
Wind risk 2/10 · Minimal
- Chance of severe wind over 30 yrs
- —
Air-quality risk 1/10 · Minimal
- Unhealthy air days now
- 0 days/yr
- Unhealthy air days in 30 yrs
- 0 days/yr
Risk factors via First Street. Map © Google.
Why this score? — see what drove the C+ grade
The composite is a weighted blend of 9 inputs, each scored 0–100. Each bar is that input's sub-score; the figure is the points it added to the 100-point composite (weight × sub-score).
- Cash flow +23.1/30.0
- ARV discount +7.5/15.0
- DSCR +7.4/10.0
- Appreciation +6.7/10.0
- 1% rule +5.5/10.0
- Schools +5.5/10.0
- Livability +3.2/5.0
- Rent growth +2.5/5.0
- Condition / age +2.5/5.0
$129,900
🖨 Deal sheet 📄 Offer letter ✓ Due diligence
Listing remarks MLS
Move in ready home in Rudd. This 3-4 bdrm home is truly move in ready. Everything has been done for you, and the décor is wonderful. 3 bdrms upstairs with a walkin closet in largest bedroom. Main level offers a family room or bonus 4th bdrm. Open layout. Formal livingroom offers office/exercise area. Even though this home doesn't have a basement, it offers a crawl space for bad weather, but also all the amenities you need on the main levels. Lets not forget the garage, huge 3 stall HEATED garage. Fenced private back yard with patio and pond.
Key facts
- Main floor laundry
- Spacious rooms
- 4 garage spots
Tags
Property features AI
Exterior
- Parking: Detached concrete garage with 4 spaces
- Security: Smoke detector(s)
- Utilities: Public water; Public sewer
- Home design: Single-family residence; Two-story; Residential property
- Construction: Vinyl siding; Asphalt roof; Built with crawl-space/partial basement
- Exterior features: Fenced yard; Shed; Corner lot
Interior
- Kitchen: Dishwasher, Electric range, Refrigerator
- Bedrooms: One main-level bedroom
- Flooring: Carpet; Vinyl
- Bathrooms: One main-level bathroom
- Heating & cooling: Forced air heating; Central air conditioning; Ceiling fan(s)
- Interior features: Dishwasher, Electric range, Refrigerator; Carpet and vinyl flooring; Basement (partial, crawl space); Ceiling fan(s); Smoke detector(s)
Neighborhood map
What this means for you Summary
Snapshot
- This is a 5-bed/1.0-bath single-family listed at $130k.
Deal economics
- At list price, monthly cash flow is $233 ($3k/yr) — positive.
- The deal already cash-flows at list — no discount required.
- Meets the 1% rule at list price ($1k rent vs $130k).
Location & tenants
- Location reads 64/100 on livability (#611 in IA) — a middle-class / working-renter tenant base. Strengths: cost of living A+, housing A+; Watch: employment C-, health & safety C-, schools F.
- Rudd-Rockford-Marble Rk Community School District (rural): math 67% / reading 63% proficiency, ranked #193 of 289 in IA (top 67%) — acceptable for families but not a draw, mixed tenant base, ~2y average lease.
- Market conditions: 3 active listings in the ZIP; 38 units permitted in Floyd County in 2024 (0 in 5+ unit buildings).
Forward outlook
- In year one you build about $5k of equity ($898 loan paydown + $4k appreciation (3.4% local appreciation)).
- Floyd County population projected to shrink 6% by 2050 — rents likely to lag national; underwrite the cash flow, not the appreciation.
- At projected returns (3.4% appreciation + 3.0% rent growth), your $36k cash investment doubles in ~5 years — after that, you're playing with house money.
- By year 7, paydown + projected appreciation supports a ~$33k cash-out refi (75% LTV) — recoverable capital for the next deal without selling this one.
Negotiation context
- Only 7 days on market — expect competitive offers; lowballing is unlikely to land.
- 2 sale attempts since 11y ago with the ask held roughly flat each time — persistent listings suggest the price (not the market) is what's stuck; bring a comps-based counter.
- Current owner paid $70k; list at $130k implies a 86% gain — meaningful room to come down on a strong offer.
Risks & watch-outs
- Watch-outs: built in 1947 — expect roof / HVAC / electrical / plumbing capex.
Questions for the listing agent
- Built in 1947 — when were the roof, HVAC, electrical panel, plumbing, and water heater last replaced?
- Is there a deadline driving the sale (1031 exchange, divorce, estate, relocation)? That informs how much negotiation room exists.
- Schools are F-rated, which usually means shorter tenancies and higher turnover. Who's the typical renter profile here, and what's been the actual vacancy rate?
- What's the average days-on-market for RENTAL listings here right now (not sales)? A rising rental-DOM trend means longer vacancies and softer asking-rent achievability than the comps imply.
- What's the recent tenant-quality profile in this submarket — average credit score on applications, eviction rate, late-payment / NSF rate, and stable-employment percentage? A property-management company in the area should have these aggregated.
- How much new for-sale + rental construction is in the pipeline within 1–3 miles? Heavy new supply typically softens prices + rents 12–24 months out; constrained supply supports both.
Investment metrics
- 1% rule
- 1.05% ✓
- Cap rate
- 8.44%
- Cash-on-cash
- 7.68%
- DSCR
- 1.34
- GRM
- 8.0
CMA / ARV
No comps found within radius.
Projected returns pro-forma
3.36% appreciation · 3.0% rent growth · sell at horizon
- IRR
- 15.6%
- Equity multiple
- 1.91×
- Total profit
- $32,945
- Equity at exit
- $61,061
- IRR
- 17.0%
- Equity multiple
- 3.57×
- Total profit
- $93,472
- Equity at exit
- $96,218
Cash invested: $36,372 (down + closing). Projections, not guarantees.
Landlord ↔ Tenant lean methodology
- Overall (STATE)
- 83 Strongly Landlord-Friendly
- State Iowa
- 83 Strongly Landlord-Friendly · R+6
- County
- — inherits STATE
- City
- — inherits STATE
ZIP-level market 50471
- Home prices YoY
- 2.1%
- Active inventory
- 3
- Price-to-rent
- 8.0×
Monthly cashflow live
- Estimated rent
- $1,360 medium interval (Pro) →
- Mortgage (P&I)
- −$681
- Tax from tax record
- −$106 /mo · $1,278/yr
- Insurance
- −$54
- HOA
- −$0
- Vacancy / Maint / Mgmt
- −$286
- Net cashflow
- $233
Break-even live
UW: 25.0% down · 7.5% · 30yr · 1.5% tax · 5.0% vac · 8.0% maint · 8.0% mgmt
Financing live
Cash to close
- Down payment
- $32,475
- Closing costs
- $3,897
- Reserves months
- —
- Total cash needed
- —
Loan-product check · same deal, 3 products live
Conventional
25% down · 7.5% · 30yr
- Down + closing
- —
- Monthly P&I
- —
- Monthly cashflow
- —
- DSCR
- —
- Eligible?
- —
Personal DTI + credit; lowest rate.
DSCR
20% down · 8.5% · 30yr
- Down + closing
- —
- Monthly P&I
- —
- Monthly cashflow
- —
- DSCR
- —
- Eligible?
- —
No personal income docs; deal must DSCR.
Hard money
10% down · 12.0% · 12mo
- Down + closing
- —
- Monthly P&I
- —
- Monthly cashflow
- —
- DSCR
- —
- Eligible?
- —
Short-term bridge; refi at stabilization.
Listing history 7 events
-
2026-06-19days on market $129,900 Active 7 DOM
-
2026-06-18days on market $129,900 Active 6 DOM
-
2026-06-17days on market $129,900 Active 5 DOM
-
2026-06-16days on market $129,900 Active 4 DOM
-
2026-06-15days on market $129,900 Active 3 DOM
-
2026-06-13remarks 461-char remark
-
2026-06-13$129,900 Active 1 DOM
ⓘ Source: listings_history table (triggers on properties + properties_extension) + one-shot
backfill from property_details.listing_events for pre-trigger history.
Tax reassessment forecast IA · Partial reset (capped growth)
- Current annual tax
- $1,278 · $106/mo
- Projected year-2 tax
- $1,659 · $138/mo
- Expected delta
- +$381/yr (+$32/mo · 29.8%)
ⓘ Screening estimate from a state-policy table — verify with the county assessor before closing.
Climate risk First Street
- Flood 1/10 Low FEMA zone X (unshaded) · 0% chance over 30 yrs
- Wildfire 1/10 Low
- Heat 2/10 Low 7 d/yr ≥100°F today · 16 d/yr by 30 yrs out
- Wind 2/10 Low
- Air quality 1/10 Low 0 unhealthy d/yr today · 0 by 30 yrs out
Nearby sold comps map
Loading sold comps map…
Walkable amenities ~0.75 mi
Loading nearby amenities…
Taxation est. · year 1
- Rental income
- $16,321
- − Mortgage interest
- −$7,276
- − Property taxes
- −$1,278
- − Insurance
- −$650
- − Repairs & maintenance
- −$1,306
- − Management
- −$1,306
- − Depreciation
- −$3,779
- Taxable income
- $727
- Est. tax owed @ 24.0%
- −$174
- After-tax cash flow
- $2,617/yr
For passive investors: Depreciation is non-cash, so a rental often shows a tax loss while cash-flowing — sheltering income. Rental losses are passive: they offset passive income freely, and up to $25,000/yr can offset ordinary (W-2) income if you actively participate and your MAGI is under $100k (phasing out to $0 by $150k); unused losses carry forward. On sale, claimed depreciation is recaptured at up to 25%, and gains may owe capital-gains tax (a 1031 exchange can defer both). Figures are a year-1 estimate at your 24.0% rate — not tax advice; consult a CPA.
Schools (NCES district)
- District
- Rudd-Rockford-Marble Rk Community School District
- NCES district ID
- 1924960
- Math proficiency
- 67% ▼ -8.00%
- Reading proficiency
- 63% ▼ -2.00%
- Median HH income
- $50,838
- Composite
- 55.32/100
- National rank
- #1259
- State rank
- #193 of 289 in IA
Livability — Rudd
- Score
- 64/100
- State rank
- #611
- US rank
- #14104
Category grades
Schools grade is shown separately in the Schools card above.
Census & demographics
- Census place
- Rudd, IA
- Population (ZIP)
- 786
Population outlook (Floyd County) Hauer SSP2
- Today (2025)
- 15,524 people
- By 2030
- 15,254 · -1.7%
- By 2040
- 14,830 · -4.5%
- By 2050
- 14,660 · -5.6%
- By 2075
- 15,548 · +0.2%
- By 2100
- 17,406 · +12.1%
Race, ethnicity, and origin ACS 2023
- Neighborhood character
- Predominantly White (96%)
- Race & ethnicity
- White 96% Asian 2% Two or more races 1%
- Common ancestry
- Portuguese 6% Italian 5% Iranian 1%
- Foreign-born
- 2% · South Korea
- Languages at home
- 97% English-only · Korean 2% German/W. Germanic 1%
Political lean MEDSL · Floyd
- 2024 margin
- Strong R (+25.7) · D 36.5% · R 62.2% · Other 1.3%
- 2008→2024 swing
- -47.6pp toward R · 2008: 21.9pp · 2024: -25.7pp
- All cycles
- 2024: R+25.7 2020: R+19.4 2016: R+14.9 2012: D+14.7 2008: D+21.9
Not yet ingested
- Civics
- —
Market trends
- HPI YoY
- ▲ 3.36%
- Current HPI
- 165.8803
- Rent YoY
- —
- Metro
- —
- State GDP YoY
- ▲ 2.48%
- F500 in state
- 4
Industry mix (Fortune 500 HQ in IA)
| Industry | F500 HQs | Revenue |
|---|---|---|
| Financial Services | 1 | $16B |
|
||
| Retail / Convenience | 1 | $15B |
|
||
Price history
+795.9% since first listed10 events — show timeline
- 2026-06-12 Listed $129,900 Greater Mason BOR
- 2023-04-17 Sold (Public Records) $70,000 Public Records
- 2021-02-17 Sold (Public Records) $70,000 Public Records
- 2019-03-01 Sold (Public Records) $82,000 Public Records
- 2015-05-08 Sold (Public Records) $80,000 Public Records
- 2015-04-30 Sold (MLS) $80,000 Greater Mason BOR
- 2015-02-28 Listed $84,900 Greater Mason BOR
- 2013-06-21 Sold (Public Records) $74,400 Public Records
- 1997-05-09 Sold (Public Records) $20,000 Public Records
- 1990-05-31 Sold (Public Records) $14,500 Public Records
Property tax history
+5.4%/yrLatest (2025): $1,278 · +7.2% YoY. Source: county tax records.
Cash-flow waterfall
monthlySold comps — $/sqft
last 12 mo · ≤1 miLoading sold comps…