 Multi-family
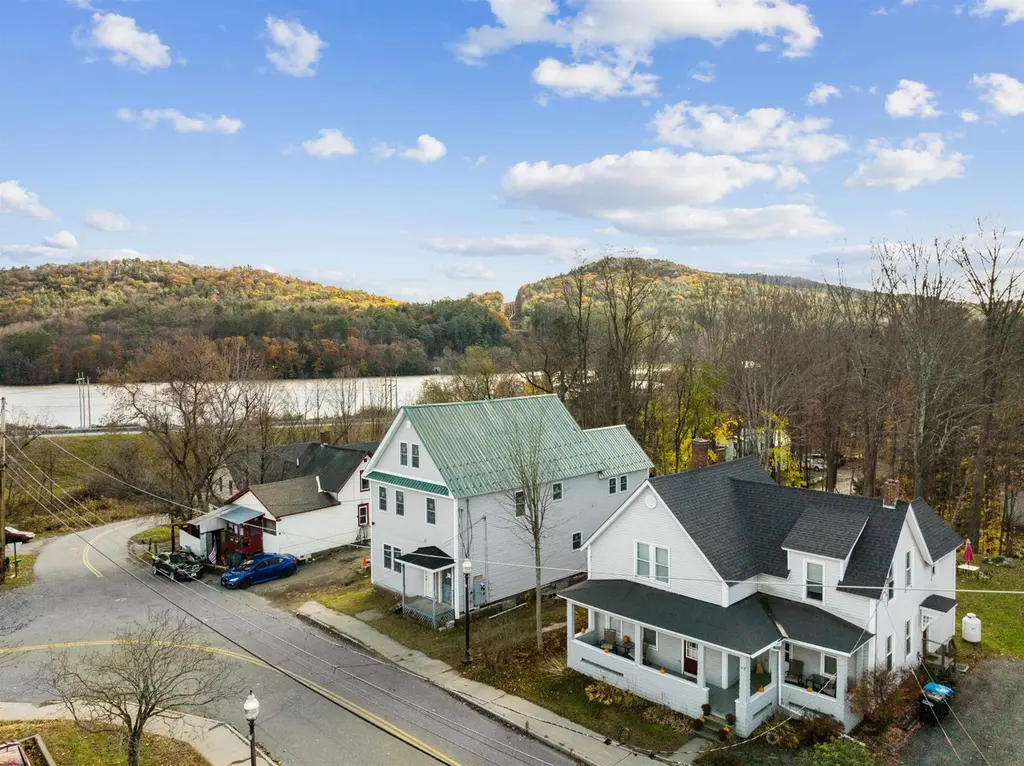
99 Depot St · Wilder, VT
Flood risk 1/10 · Minimal
- FEMA flood zone
- X (unshaded)
- Chance of flooding over 30 yrs
- 0.0%
- Est. flood insurance / yr
- $473 – $860
Fire risk 1/10 · Minimal
- Est. fire insurance / yr
- $480 – $892
Heat risk 3/10 · Minor
- Hot days now (above 93°F)
- 7 days/yr
- Hot days in 30 yrs
- 17 days/yr
Wind risk 3/10 · Minor
- Chance of severe wind over 30 yrs
- 5.0%
Air-quality risk 1/10 · Minimal
- Unhealthy air days now
- 0 days/yr
- Unhealthy air days in 30 yrs
- 0 days/yr
Risk factors via First Street. Map © Google.
Why this score? — see what drove the B- grade
The composite is a weighted blend of 9 inputs, each scored 0–100. Each bar is that input's sub-score; the figure is the points it added to the 100-point composite (weight × sub-score).
- Cash flow +30.0/30.0
- 1% rule +10.0/10.0
- DSCR +10.0/10.0
- ARV discount +7.5/15.0
- Schools +5.0/10.0
- Livability +4.0/5.0
- Rent growth +2.5/5.0
- Condition / age +1.0/5.0
- Appreciation +0.0/10.0
$215,000
🖨 Deal sheet 📄 Offer letter ✓ Due diligence
Multi-family units
County records classify this as Multi-Family (2-4 Unit). Listing-text estimate: 1 unit. estimate disagrees with records
Listing remarks
Welcome to 99 Depot Street, Hartford, VT. This multifamily property presents a distinctive opportunity for both seasoned and novice investors eager to embark on a project with immense potential. Situated just minutes away from the amenities of the Upper Valley, this property is nestled in the village of Wilder, one of Hartford's five lively villages. While restoration work is needed to revive its original 1900s grandeur, the prospects are limitless. This represents a remarkable opportunity for visionary individuals to rejuvenate the property and craft an extraordinary space. Comprising multiple units, the property offers flexibility for diverse investment strategies. One can opt to renovate
Key facts
- Multiple units
- Updated survey
- Multifamily property
Tags
Property features AI
Exterior
- Parking: Dirt driveway
- Utilities: Public water on-site; Public sewer on-site; Electric service with circuit breakers; No internet service indicated
- Home design: Multi-family property; Existing structure; Grey exterior color
- Construction: Built in 1902; Wood frame construction with vinyl and wood siding; Metal roof; Surveyed
- Exterior features: Level lot; Sidewalks; Near trail; In town, neighborhood setting; River nearby (Connecticut River); Paved public road frontage
Interior
- Bedrooms: Unit 1: 2 bedrooms (level 1); Unit 2: 2 bedrooms (level 2); Unit 3: 1 bedroom (level 3)
- Flooring: Wood floors
- Bathrooms: Three full bathrooms total (one in each unit)
- Heating & cooling: No heating; No cooling
- Interior features: Basement with walk-up access; Basement has a dirt floor; Wood flooring throughout
Neighborhood map
What this means for you Summary
Snapshot
- This is a 5-bed/3.0-bath multifamily listed at $215k. Condition is rated poor.
Deal economics
- At list price, monthly cash flow is $2k ($29k/yr) — positive.
- The deal already cash-flows at list — no discount required.
- Meets the 1% rule at list price ($5k rent vs $215k).
- Recommended offer: $212k (1.5% below list) — sets the bar for market timing.
Location & tenants
- Location reads 79/100 on livability (#9 in VT, #2,008 nationally) — a middle-class / working-renter tenant base. Strengths: crime A+, commute A+, health & safety A+; Watch: amenities F.
- Zoned schools: Dothan Brook School (math 47% / reading 57%, grade C-, #44 of 192 statewide, top 24%, 246 students, 28% FRL).
- Market conditions: 58 active listings in the ZIP; solid renter incomes; 339 units permitted in Windsor County in 2024 (240 in 5+ unit buildings).
- At $4,960/mo this rent would consume 76% of the median local household income ($78k/yr) (locally 227% of renters already pay >50% of income on rent) — very limited rent-growth headroom before tenants either downsize or default.
Forward outlook
- Local home prices are declining (-3.0%/yr); year-one equity from $1k of loan paydown is wiped out by about $6k of value loss. Plan a longer hold.
- Windsor County population projected at -21% by 2050 — secular population decline; favor cash flow + early exit over multi-decade hold.
- At projected returns (-3.0% appreciation + 3.0% rent growth), your $60k cash investment doubles in ~3 years — after that, you're playing with house money.
Negotiation context
- It's been on market 25 days — a 2% lower offer ($212k) is reasonable based on typical stale-listing flexibility.
Risks & watch-outs
- Watch-outs: built in 1902 — expect roof / HVAC / electrical / plumbing capex.
Questions for the listing agent
- Have any recent inspections been done? Can we get a copy of the seller's disclosures and any deferred-maintenance estimates?
- Built in 1902 — when were the roof, HVAC, electrical panel, plumbing, and water heater last replaced?
- Is there a deadline driving the sale (1031 exchange, divorce, estate, relocation)? That informs how much negotiation room exists.
- Schools are D-rated, which usually means shorter tenancies and higher turnover. Who's the typical renter profile here, and what's been the actual vacancy rate?
- What's the average days-on-market for RENTAL listings here right now (not sales)? A rising rental-DOM trend means longer vacancies and softer asking-rent achievability than the comps imply.
- What's the recent tenant-quality profile in this submarket — average credit score on applications, eviction rate, late-payment / NSF rate, and stable-employment percentage? A property-management company in the area should have these aggregated.
- How much new apartment / multifamily construction is in the pipeline within 1–3 miles? Heavy new supply (>2% of stock underway) typically softens rents 12–24 months out; light construction supports rent growth.
Investment metrics
- 1% rule
- 2.31% ✓
- Cap rate
- 19.87%
- Cash-on-cash
- 48.49%
- DSCR
- 3.16
- GRM
- 3.6
CMA / ARV
No comps found within radius.
Show comp detail 3 sales within ~0.75 mi
| Address | Dist | Beds/Ba | Sqft | Sold | Price | $/sf | Match |
|---|---|---|---|---|---|---|---|
| 99 Depot St | 0.00mi | 5/3.0 | — | 0mo | $168,000 | — | 87 |
| 29 Hawthorn St | 0.29mi | 4/2.0 (-1) | 2,460 | 17mo | $399,000 | $162 | 51 |
| 410-412 South St | 0.55mi | 4/2.0 (-1) | 1,764 | 23mo | $325,000 | $184 | 34 |
Match score weights: distance 35% · size 25% · config 20% · recency 20%. Top-matched comps best support the ARV.
Projected returns pro-forma
-3.0% appreciation · 3.0% rent growth · sell at horizon
- IRR
- 46.0%
- Equity multiple
- 3.00×
- Total profit
- $120,168
- Equity at exit
- $32,057
- IRR
- 51.8%
- Equity multiple
- 6.06×
- Total profit
- $304,445
- Equity at exit
- $18,589
Cash invested: $60,200 (down + closing). Projections, not guarantees.
Landlord ↔ Tenant lean methodology
- Overall (STATE)
- 41 Moderately Tenant-Leaning
- State Vermont
- 41 Moderately Tenant-Leaning · D+15
- County
- — inherits STATE
- City
- — inherits STATE
ZIP-level market 05001
- Home prices YoY
- -3.5%
- Active inventory
- 58
- Price-to-rent
- 7.2×
Monthly cashflow live
- Estimated rent
- $4,960 medium interval (Pro) →
- Mortgage (P&I)
- −$1,127
- Tax est. 1.5%
- −$269 /mo · $3,225/yr
- Insurance
- −$90
- HOA
- −$0
- Vacancy / Maint / Mgmt
- −$1,042
- Net cashflow
- $2,433
Break-even live
2-unit breakdown (identical units grouped — click to expand)
| Units | Beds | Baths | Est. rent |
|---|---|---|---|
| 2× units | 3 | 1.5 | $4,960 |
| #1 | 3 | 1.5 | $2,480 |
| #2 | 3 | 1.5 | $2,480 |
| Total (2 units) | $4,960 | ||
UW: 25.0% down · 7.5% · 30yr · 1.5% tax · 5.0% vac · 8.0% maint · 8.0% mgmt
Financing live
Cash to close
- Down payment
- $53,750
- Closing costs
- $6,450
- Reserves months
- —
- Total cash needed
- —
Loan-product check · same deal, 3 products live
Conventional
25% down · 7.5% · 30yr
- Down + closing
- —
- Monthly P&I
- —
- Monthly cashflow
- —
- DSCR
- —
- Eligible?
- —
Personal DTI + credit; lowest rate.
DSCR
20% down · 8.5% · 30yr
- Down + closing
- —
- Monthly P&I
- —
- Monthly cashflow
- —
- DSCR
- —
- Eligible?
- —
No personal income docs; deal must DSCR.
Hard money
10% down · 12.0% · 12mo
- Down + closing
- —
- Monthly P&I
- —
- Monthly cashflow
- —
- DSCR
- —
- Eligible?
- —
Short-term bridge; refi at stabilization.
Listing history 2 events
-
2026-04-19status Pending
-
2026-03-25$215,000 Active
ⓘ Source: listings_history table (triggers on properties + properties_extension) + one-shot
backfill from property_details.listing_events for pre-trigger history.
Climate risk First Street
- Flood 1/10 Low FEMA zone X (unshaded) · 0% chance over 30 yrs
- Wildfire 1/10 Low
- Heat 3/10 Moderate 7 d/yr ≥93°F today · 17 d/yr by 30 yrs out
- Wind 3/10 Moderate 5% chance of damaging wind over 30 yrs
- Air quality 1/10 Low 0 unhealthy d/yr today · 0 by 30 yrs out
Nearby sold comps map
Loading sold comps map…
Walkable amenities ~0.75 mi
Loading nearby amenities…
Taxation est. · year 1
- Rental income
- $59,520
- − Mortgage interest
- −$12,043
- − Property taxes
- −$3,225
- − Insurance
- −$1,075
- − Repairs & maintenance
- −$4,762
- − Management
- −$4,762
- − Depreciation
- −$6,255
- Taxable income
- $27,399
- Est. tax owed @ 24.0%
- −$6,576
- After-tax cash flow
- $22,615/yr
For passive investors: Depreciation is non-cash, so a rental often shows a tax loss while cash-flowing — sheltering income. Rental losses are passive: they offset passive income freely, and up to $25,000/yr can offset ordinary (W-2) income if you actively participate and your MAGI is under $100k (phasing out to $0 by $150k); unused losses carry forward. On sale, claimed depreciation is recaptured at up to 25%, and gains may owe capital-gains tax (a 1031 exchange can defer both). Figures are a year-1 estimate at your 24.0% rate — not tax advice; consult a CPA.
Condition & rehab AI · 13 photos
This multifamily property requires extensive repairs and renovations to bring it up to a move-in-ready condition. The roof, exterior siding, interior flooring and walls, HVAC system, and landscaping all need significant attention to increase its resale and rental value.
Repairs flagged
- Major roof — The satellite image shows visible damage and missing shingles.
- Major exterior siding — The satellite image shows peeling and poor condition.
- Major interior flooring — The satellite image shows unfinished and poor condition.
- Major interior walls — The satellite image shows unfinished and poor condition.
- Major windows — The satellite image shows poor condition.
- Major foundation — The satellite image shows poor condition.
- Major HVAC system — The satellite image shows poor condition.
- Major landscaping — The satellite image shows overgrown and poor condition.
Value-add opportunities
- Both roof replacement — A new roof will significantly improve the property's appearance and functionality, attracting buyers and renters.
- Both exterior siding repair — Repairing the peeling siding will improve the property's curb appeal and increase its value.
- Both interior flooring and wall repairs — Completing the unfinished interior will make the property move-in ready and more attractive to buyers and renters.
- Both HVAC system replacement — A new HVAC system will improve the property's comfort and energy efficiency, attracting buyers and renters.
- Both landscaping and yard maintenance — A well-maintained yard will improve the property's curb appeal and attract buyers and renters.
Renovation cost estimate screening
| Repair item | Severity | Est. cost |
|---|---|---|
| roof · The satellite image shows visible damage and missing shingles. | Major | $15,000–50,000 |
| exterior siding · The satellite image shows peeling and poor condition. | Major | $15,000–50,000 |
| interior flooring · The satellite image shows unfinished and poor condition. | Major | $15,000–50,000 |
| interior walls · The satellite image shows unfinished and poor condition. | Major | $15,000–50,000 |
| windows · The satellite image shows poor condition. | Major | $15,000–50,000 |
| foundation · The satellite image shows poor condition. | Major | $15,000–50,000 |
| HVAC system · The satellite image shows poor condition. | Major | $15,000–50,000 |
| landscaping · The satellite image shows overgrown and poor condition. | Major | $15,000–50,000 |
| Total estimated repair cost · 8 items | $120,000–400,000 |
Value-add ROI direction
- Both roof replacement — A new roof will significantly improve the property's appearance and functionality, attracting buyers and renters. ↑
- Both exterior siding repair — Repairing the peeling siding will improve the property's curb appeal and increase its value. ↑
- Both interior flooring and wall repairs — Completing the unfinished interior will make the property move-in ready and more attractive to buyers and renters. ↑
- Both HVAC system replacement — A new HVAC system will improve the property's comfort and energy efficiency, attracting buyers and renters. ↑
- Both landscaping and yard maintenance — A well-maintained yard will improve the property's curb appeal and attract buyers and renters. ↑
ⓘ Cost ranges are severity-bucket heuristics (US national rule-of-thumb). Get contractor quotes + a written scope before underwriting a rehab budget.
Schools (NCES district)
No district data.
Livability — Wilder
- Score
- 79/100
- State rank
- #9
- US rank
- #2008
Category grades
Schools grade is shown separately in the Schools card above.
Census & demographics
- Census place
- Wilder, VT
- County
- Windsor County · 9,751 people
- City population
- 780
- Metro
- Lebanon, NH-VT
- Population (ZIP)
- 9,751
- Household income
- $78,092
- Rent vs Own
- Severe rent burden
- 227.0
Population outlook (Windsor County) Hauer SSP2
- Today (2025)
- 53,235 people
- By 2030
- 51,269 · -3.7%
- By 2040
- 46,517 · -12.6%
- By 2050
- 41,859 · -21.4%
- By 2075
- 33,298 · -37.5%
- By 2100
- 24,523 · -53.9%
Race, ethnicity, and origin ACS 2023
- Neighborhood character
- Predominantly White (92%)
- Race & ethnicity
- White 92% Two or more races 3% Asian 3% Hispanic / Latino 2%
- Common ancestry
- Lithuanian 6% Slovak 5% Romanian 4%
- Foreign-born
- 6% · Canada, China, Philippines
- Languages at home
- 95% English-only · Other Indo-European 2% Spanish 1% Other Asian/Pacific 1%
Political lean MEDSL · Windsor
- 2024 margin
- Solid D (+35.6) · D 66.3% · R 30.7% · Other 2.9%
- 2008→2024 swing
- -4.1pp toward R · 2008: 39.7pp · 2024: 35.6pp
- All cycles
- 2024: D+35.6 2020: D+38.9 2016: D+32.1 2012: D+38.1 2008: D+39.7
Not yet ingested
- Civics
- —
Market trends
- HPI YoY
- ▼ -12.43%
- Current HPI
- 338.3801
- Rent YoY
- —
- Metro
- Lebanon, NH-VT
- State GDP YoY
- —
- F500 in state
- 0
Price history
2 events — show timeline
- 2026-04-19 Pending — PrimeMLS
- 2026-03-25 Listed $215,000 PrimeMLS
Cash-flow waterfall
monthlySold comps — $/sqft
last 12 mo · ≤1 miLoading sold comps…