 46-Plex
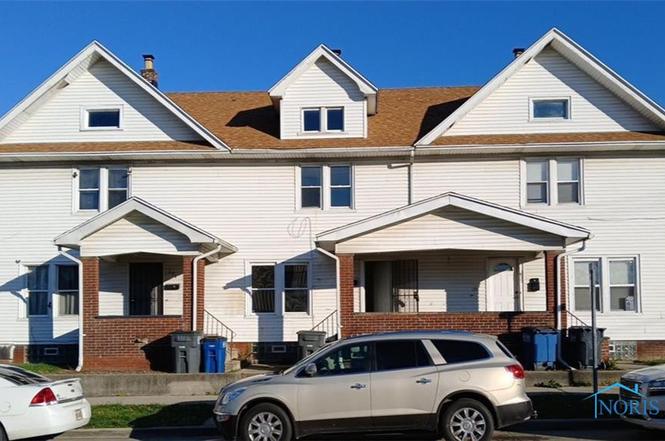
291 E Broadway St · Toledo, OH
Flood risk 1/10 · Minimal
- FEMA flood zone
- X (unshaded)
- Chance of flooding over 30 yrs
- 0.0%
- Est. flood insurance / yr
- $473 – $860
Fire risk 1/10 · Minimal
- Est. fire insurance / yr
- $713 – $1,323
Heat risk 3/10 · Minor
- Hot days now (above 100°F)
- 7 days/yr
- Hot days in 30 yrs
- 16 days/yr
Wind risk 2/10 · Minimal
- Chance of severe wind over 30 yrs
- —
Air-quality risk 2/10 · Minimal
- Unhealthy air days now
- 1 days/yr
- Unhealthy air days in 30 yrs
- 2 days/yr
Risk factors via First Street. Map © Google.
Why this score? — see what drove the D grade
The composite is a weighted blend of 9 inputs, each scored 0–100. Each bar is that input's sub-score; the figure is the points it added to the 100-point composite (weight × sub-score).
- Cash flow +15.0/30.0
- ARV discount +7.5/15.0
- 1% rule +5.0/10.0
- DSCR +5.0/10.0
- Rent growth +3.8/5.0
- Livability +3.3/5.0
- Condition / age +2.5/5.0
- Schools +1.6/10.0
- Appreciation +0.0/10.0
$154,000
🖨 Deal sheet 📄 Offer letter ✓ Due diligence
Multi-family units
County records classify this as Multi-Family (2-4 Unit). Listing-text estimate: 46 units. estimate disagrees with records
Listing remarks MLS
3 unit duplex. 2 units are occupied. One is month to month and the other is until 1/31/2023. Brings in a total rent when fully occupied of $2,040. Great investment opportunity.
Key facts
- 8,821 sq ft lot
- Garage
- Built 1913
Property features AI
Finance
- Other: Property is residential income (apartment/triplex); Lot approximately 0.2025 acres (8,821 sq ft); Located on a corner lot
- Financial info: Multi-family: 3 total units in 1 building; Tenants pay electricity and gas; owner pays water
- HOA & community: No HOA or community details provided
Exterior
- Parking: Has garage (1 garage space)
- Security: No security features provided
- Utilities: Public water; Sanitary sewer; Electricity available and connected (circuit breakers)
- Home design: Residential income property (apartment / triplex); Two levels / 2 stories
- Construction: Built with other construction materials; Block foundation; Shingle roof
- Exterior features: Corner lot
Interior
- Kitchen: No kitchen appliance details provided
- Bedrooms: No bedroom-level details provided
- Flooring: Other flooring
- Bathrooms: No bathroom details provided
- Heating & cooling: Forced air heating; Natural gas heating
- Interior features: Additional interior features listed as 'Other'; Water heater
- Laundry & utility: No laundry appliance details provided
Neighborhood map
What this means for you Summary
Snapshot
- This is a 46 × 6-bed/3.0-bath units multifamily listed at $154k.
Deal economics
- At list price, monthly cash flow is $42k ($509k/yr) — positive. Per door: $922/mo.
- The deal already cash-flows at list — no discount required.
- Meets the 1% rule at list price ($55k rent vs $154k).
- Recommended offer: $136k (12.0% below list) — sets the bar for market timing.
- Cap rate 336.9% vs local median 7.6% in Toledo — top-decile yield for the area; either an underpriced asset or a hidden risk that comps aren't pricing in. Stress-test before assuming the spread holds.
Location & tenants
- Location reads 66/100 on livability (#645 in OH) — a middle-class / working-renter tenant base. Strengths: cost of living A+, housing A+, health & safety A+; Watch: amenities C-, crime F, commute F.
- Toledo City (urban): math 15% / reading 24% proficiency, ranked #634 of 656 in OH (top 97%) — low school quality limits family demand, transient renter base, plan for 1-2y turnover; 72% free/reduced lunch — lower-income household profile, screen leases tightly.
- Zoned schools: Raymer Elementary School (math 14% / reading 16%, grade F, #1,377 of 1,584 statewide, top 87%, 424 students, 0% FRL); Waite High School (math 12% / reading 24%, grade F, #687 of 781 statewide, top 88%, 997 students, 0% FRL) — zoned schools average 0% FRL vs 72% district-wide (72 pts lower); this property's tenant base skews higher-income than the district average.
- Market conditions: Rents rising fast (+5.4%/yr); 117 active listings in the ZIP; lower-income renter base — watch delinquency; 415 units permitted in Lucas County in 2024 (122 in 5+ unit buildings).
- At $54,951/mo this rent would consume 1686% of the median local household income ($39k/yr) (locally 1257% of renters already pay >50% of income on rent) — very limited rent-growth headroom before tenants either downsize or default.
Forward outlook
- Local home prices are declining (-3.0%/yr); year-one equity from $1k of loan paydown is wiped out by about $5k of value loss. Plan a longer hold.
- Lucas County population projected at -16% by 2050 — secular population decline; favor cash flow + early exit over multi-decade hold.
- At projected returns (-3.0% appreciation + 5.4% rent growth), your $43k cash investment doubles in ~1 year — after that, you're playing with house money.
Negotiation context
- It's been on market 205 days — a 12% lower offer ($136k) is reasonable based on typical stale-listing flexibility.
- 6 sale attempts since 14y ago; this cycle's ask has dropped $36k (19%) from the opening price — seller is motivated, your offer sets the floor, not the list.
- Current owner paid $93k; list at $154k implies a 66% gain — meaningful room to come down on a strong offer.
Risks & watch-outs
- Watch-outs: built in 1913 — expect roof / HVAC / electrical / plumbing capex.
Questions for the listing agent
- It's been on market 205 days. Have you received any prior offers? Is the seller open to a 12% concession, seller financing, or rate buy-down credit?
- Can we see the unit-by-unit rent roll, current vacancy, and any below-market leases? What's the average tenancy length?
- What capital expenditures (roof, boiler, parking lot, exteriors) have been made in the last 5 years, and what's planned in the next 2?
- Built in 1913 — when were the roof, HVAC, electrical panel, plumbing, and water heater last replaced?
- Why hasn't it sold? Are there any deal-killer items the seller is aware of (foundation, flood, title, zoning, code violations)?
- Is there a deadline driving the sale (1031 exchange, divorce, estate, relocation)? That informs how much negotiation room exists.
- Schools are D-rated, which usually means shorter tenancies and higher turnover. Who's the typical renter profile here, and what's been the actual vacancy rate?
- Crime grade is F in this area — have there been break-ins, vandalism, or insurance claims at this property in the last 3 years? What carrier currently insures it and at what premium?
- The area grade is low — what's the realistic commute time and amenity access for the typical tenant pool here? Any planned neighborhood developments (good or bad) we should know about?
- What's the average days-on-market for RENTAL listings here right now (not sales)? A rising rental-DOM trend means longer vacancies and softer asking-rent achievability than the comps imply.
- What's the recent tenant-quality profile in this submarket — average credit score on applications, eviction rate, late-payment / NSF rate, and stable-employment percentage? A property-management company in the area should have these aggregated.
- How much new apartment / multifamily construction is in the pipeline within 1–3 miles? Heavy new supply (>2% of stock underway) typically softens rents 12–24 months out; light construction supports rent growth.
Investment metrics
- 1% rule
- 35.68% ✓
- Cap rate
- 336.89%
- Cash-on-cash
- 1180.72%
- DSCR
- 53.54
- GRM
- 0.2
CMA / ARV
- ARV (on-the-fly)
- $72,072
- Comps found
- 1
Show comp detail 1 sale within ~0.75 mi
| Address | Dist | Beds/Ba | Sqft | Sold | Price | $/sf | Match |
|---|---|---|---|---|---|---|---|
| 414 Platt St | 0.20mi | 5/3.0 (-1) | 3,038 (-12%) | 17mo | $64,000 | $21 | 52 |
Match score weights: distance 35% · size 25% · config 20% · recency 20%. Top-matched comps best support the ARV.
Projected returns pro-forma
-3.0% appreciation · 5.37% rent growth · sell at horizon
- IRR
- —
- Equity multiple
- 66.22×
- Total profit
- $2,812,169
- Equity at exit
- $22,962
- IRR
- —
- Equity multiple
- 151.96×
- Total profit
- $6,509,288
- Equity at exit
- $13,315
Cash invested: $43,120 (down + closing). Projections, not guarantees.
Landlord ↔ Tenant lean methodology
- Overall (STATE)
- 73 Landlord-Friendly
- State Ohio
- 73 Landlord-Friendly · R+6
- County
- — inherits STATE
- City
- — inherits STATE
ZIP-level market 43605
- Home prices YoY
- -25.6%
- Rents YoY
- 5.4%
- Active inventory
- 117
- Price-to-rent
- 10.7×
Monthly cashflow live
- Estimated rent
- $54,951 medium interval (Pro) →
- Mortgage (P&I)
- −$808
- Tax from tax record
- −$112 /mo · $1,348/yr
- Insurance
- −$64
- HOA
- −$0
- Vacancy / Maint / Mgmt
- −$11,540
- Net cashflow
- $42,427
Break-even live
46-unit breakdown (identical units grouped — click to expand)
| Units | Beds | Baths | Est. rent |
|---|---|---|---|
| 46× units | 6 | 3 | $54,970 |
| #1 | 6 | 3 | $1,195 |
| #2 | 6 | 3 | $1,195 |
| #3 | 6 | 3 | $1,195 |
| #4 | 6 | 3 | $1,195 |
| #5 | 6 | 3 | $1,195 |
| #6 | 6 | 3 | $1,195 |
| #7 | 6 | 3 | $1,195 |
| #8 | 6 | 3 | $1,195 |
| #9 | 6 | 3 | $1,195 |
| #10 | 6 | 3 | $1,195 |
| #11 | 6 | 3 | $1,195 |
| #12 | 6 | 3 | $1,195 |
| #13 | 6 | 3 | $1,195 |
| #14 | 6 | 3 | $1,195 |
| #15 | 6 | 3 | $1,195 |
| #16 | 6 | 3 | $1,195 |
| #17 | 6 | 3 | $1,195 |
| #18 | 6 | 3 | $1,195 |
| #19 | 6 | 3 | $1,195 |
| #20 | 6 | 3 | $1,195 |
| #21 | 6 | 3 | $1,195 |
| #22 | 6 | 3 | $1,195 |
| #23 | 6 | 3 | $1,195 |
| #24 | 6 | 3 | $1,195 |
| #25 | 6 | 3 | $1,195 |
| #26 | 6 | 3 | $1,195 |
| #27 | 6 | 3 | $1,195 |
| #28 | 6 | 3 | $1,195 |
| #29 | 6 | 3 | $1,195 |
| #30 | 6 | 3 | $1,195 |
| #31 | 6 | 3 | $1,195 |
| #32 | 6 | 3 | $1,195 |
| #33 | 6 | 3 | $1,195 |
| #34 | 6 | 3 | $1,195 |
| #35 | 6 | 3 | $1,195 |
| #36 | 6 | 3 | $1,195 |
| #37 | 6 | 3 | $1,195 |
| #38 | 6 | 3 | $1,195 |
| #39 | 6 | 3 | $1,195 |
| #40 | 6 | 3 | $1,195 |
| #41 | 6 | 3 | $1,195 |
| #42 | 6 | 3 | $1,195 |
| #43 | 6 | 3 | $1,195 |
| #44 | 6 | 3 | $1,195 |
| #45 | 6 | 3 | $1,195 |
| #46 | 6 | 3 | $1,195 |
| Total (46 units) | $54,951 | ||
UW: 25.0% down · 7.5% · 30yr · 1.5% tax · 5.0% vac · 8.0% maint · 8.0% mgmt
Financing live
Cash to close
- Down payment
- $38,500
- Closing costs
- $4,620
- Reserves months
- —
- Total cash needed
- —
Loan-product check · same deal, 3 products live
Conventional
25% down · 7.5% · 30yr
- Down + closing
- —
- Monthly P&I
- —
- Monthly cashflow
- —
- DSCR
- —
- Eligible?
- —
Personal DTI + credit; lowest rate.
DSCR
20% down · 8.5% · 30yr
- Down + closing
- —
- Monthly P&I
- —
- Monthly cashflow
- —
- DSCR
- —
- Eligible?
- —
No personal income docs; deal must DSCR.
Hard money
10% down · 12.0% · 12mo
- Down + closing
- —
- Monthly P&I
- —
- Monthly cashflow
- —
- DSCR
- —
- Eligible?
- —
Short-term bridge; refi at stabilization.
Listing history 35 events
-
2026-06-18days on market $154,000 Active 205 DOM
-
2026-06-17days on market $154,000 Active 204 DOM
-
2026-06-16days on market $154,000 Active 203 DOM
-
2026-06-15days on market $154,000 Active 202 DOM
-
2026-06-14statusdays on market $154,000 Active 200 DOM
-
2026-04-19status Pending
-
2026-01-14price $154,000
-
2025-11-10price $162,000
-
2025-10-14price $93,000 176-char remark
Show marketing remark (346 chars)
Great floor plan for this modern 3 Unit building, each unit has their own private basement along with a quality 2 story, 2 bedroom setup. Tenants are setup to pay their own gas/electric, owner would pay water/sewer/lawn. Whole building has been vandalized, no furnaces, water heaters, or electric service connected. Great building after upgrades.
-
2025-10-14price $30,000 346-char remark
Show marketing remark (346 chars)
Great floor plan for this modern 3 Unit building, each unit has their own private basement along with a quality 2 story, 2 bedroom setup. Tenants are setup to pay their own gas/electric, owner would pay water/sewer/lawn. Whole building has been vandalized, no furnaces, water heaters, or electric service connected. Great building after upgrades.
-
2025-10-13price $23,000
-
2025-09-30$190,000 Active
-
2022-09-20soldstatus $93,000
-
2022-09-09soldstatus $93,000 Closed 176-char remark
Show marketing remark (176 chars)
3 unit duplex. 2 units are occupied. One is month to month and the other is until 1/31/2023. Brings in a total rent when fully occupied of $2,040. Great investment opportunity.
-
2022-08-19status Pending 176-char remark
Show marketing remark (176 chars)
3 unit duplex. 2 units are occupied. One is month to month and the other is until 1/31/2023. Brings in a total rent when fully occupied of $2,040. Great investment opportunity.
-
2022-07-28$107,900 Active 176-char remark
Show marketing remark (176 chars)
3 unit duplex. 2 units are occupied. One is month to month and the other is until 1/31/2023. Brings in a total rent when fully occupied of $2,040. Great investment opportunity.
-
2022-01-13price $675
-
2021-07-09soldstatus $120,000
-
2018-08-06soldstatus $30,000
-
2018-08-01soldstatus $30,000 346-char remark
Show marketing remark (346 chars)
Great floor plan for this modern 3 Unit building, each unit has their own private basement along with a quality 2 story, 2 bedroom setup. Tenants are setup to pay their own gas/electric, owner would pay water/sewer/lawn. Whole building has been vandalized, no furnaces, water heaters, or electric service connected. Great building after upgrades.
-
2018-06-27$52,000 346-char remark
Show marketing remark (346 chars)
Great floor plan for this modern 3 Unit building, each unit has their own private basement along with a quality 2 story, 2 bedroom setup. Tenants are setup to pay their own gas/electric, owner would pay water/sewer/lawn. Whole building has been vandalized, no furnaces, water heaters, or electric service connected. Great building after upgrades.
-
2017-07-06soldstatus $56,000
-
2015-12-31soldstatus $25,000
-
2013-10-01soldstatus $85,000
-
2013-06-28soldstatus $114,500
-
2013-04-15soldstatus $23,000
-
2013-03-22$24,000
-
2013-03-22historical
-
2013-03-22$24,000
-
2013-03-21historical
-
2013-02-12soldstatus $40,000
-
2012-10-04$34,000
-
2007-12-31soldstatus $269,900
-
2003-05-23soldstatus $143,000
-
2003-05-23soldstatus $160,000
ⓘ Source: listings_history table (triggers on properties + properties_extension) + one-shot
backfill from property_details.listing_events for pre-trigger history.
Tax reassessment forecast OH · Partial reset (capped growth)
- Current annual tax
- $1,348 · $112/mo
- Projected year-2 tax
- $1,875 · $156/mo
- Expected delta
- +$527/yr (+$44/mo · 39.1%)
ⓘ Screening estimate from a state-policy table — verify with the county assessor before closing.
Climate risk First Street
- Flood 1/10 Low FEMA zone X (unshaded) · 0% chance over 30 yrs
- Wildfire 1/10 Low
- Heat 3/10 Moderate 7 d/yr ≥100°F today · 16 d/yr by 30 yrs out
- Wind 2/10 Low
- Air quality 2/10 Low 1 unhealthy d/yr today · 2 by 30 yrs out
Nearby sold comps map
Loading sold comps map…
Walkable amenities ~0.75 mi
Loading nearby amenities…
Taxation est. · year 1
- Rental income
- $659,412
- − Mortgage interest
- −$8,626
- − Property taxes
- −$1,348
- − Insurance
- −$770
- − Repairs & maintenance
- −$52,753
- − Management
- −$52,753
- − Depreciation
- −$4,480
- Taxable income
- $538,682
- Est. tax owed @ 24.0%
- −$129,284
- After-tax cash flow
- $379,843/yr
For passive investors: Depreciation is non-cash, so a rental often shows a tax loss while cash-flowing — sheltering income. Rental losses are passive: they offset passive income freely, and up to $25,000/yr can offset ordinary (W-2) income if you actively participate and your MAGI is under $100k (phasing out to $0 by $150k); unused losses carry forward. On sale, claimed depreciation is recaptured at up to 25%, and gains may owe capital-gains tax (a 1031 exchange can defer both). Figures are a year-1 estimate at your 24.0% rate — not tax advice; consult a CPA.
Schools (NCES district)
- District
- Toledo City
- NCES district ID
- 3904490
- Math proficiency
- 15% ▼ -16.00%
- Reading proficiency
- 24% ▼ -13.00%
- Median HH income
- $32,137
- Composite
- 15.76/100
- National rank
- #9276
- State rank
- #634 of 656 in OH
Livability — Toledo
- Score
- 66/100
- State rank
- #645
- US rank
- #11442
Category grades
Schools grade is shown separately in the Schools card above.
Census & demographics
- Census place
- Toledo, OH
- County
- Lucas County · 380,724 people
- City population
- 280,811
- Metro
- Toledo, OH
- Population (ZIP)
- 24,441
- Household income
- $39,118
- Rent vs Own
- Severe rent burden
- 1257.0
Population outlook (Lucas County) Hauer SSP2
- Today (2025)
- 420,751 people
- By 2030
- 410,187 · -2.5%
- By 2040
- 384,019 · -8.7%
- By 2050
- 355,125 · -15.6%
- By 2075
- 291,683 · -30.7%
- By 2100
- 233,670 · -44.5%
Race, ethnicity, and origin ACS 2023
- Neighborhood character
- Diverse neighborhood (Simpson 0.61)
- Race & ethnicity
- White 57% Hispanic / Latino 21% Black 14% Two or more races 14%
- Hispanic origin (detail)
- Mexican 17% Puerto Rican 2%
- Common ancestry
- Romanian 3% Lithuanian 2% Portuguese 1%
- Foreign-born
- 3% · Canada
- Languages at home
- 91% English-only · Spanish 7% Arabic 1%
Political lean MEDSL · Lucas
- 2024 margin
- D (+12.6) · D 55.8% · R 43.2%
- 2008→2024 swing
- -18.9pp toward R · 2008: 31.4pp · 2024: 12.6pp
- All cycles
- 2024: D+12.6 2020: D+16.8 2016: D+17.4 2012: D+30.4 2008: D+31.4
Not yet ingested
- Civics
- —
Market trends
- HPI YoY
- ▼ -47.85%
- Current HPI
- 138.6894
- Rent YoY
- ▲ 5.37%
- Metro
- Toledo, OH
- State GDP YoY
- ▲ 1.98%
- F500 in state
- 48
Industry mix (Fortune 500 HQ in OH)
| Industry | F500 HQs | Revenue |
|---|---|---|
| Insurance | 3 | $145B |
|
||
| Industrial Machinery | 3 | $49B |
|
||
| Financial Services | 3 | $24B |
|
||
| Consumer Goods | 2 | $93B |
|
||
| Aerospace / Defense | 2 | $47B |
|
||
| Utilities | 2 | $33B |
|
||
Price history
+7.7% since first listed30 events — show timeline
- 2026-04-19 Pending — NORIS
- 2026-01-14 Price Changed $154,000 NORIS
- 2025-11-10 Price Changed $162,000 NORIS
- 2025-10-14 Price Changed $93,000 NORIS
- 2025-10-14 Price Changed $30,000 NORIS
- 2025-10-13 Price Changed $23,000 NORIS
- 2025-09-30 Listed $190,000 NORIS
- 2022-09-20 Sold (Public Records) $93,000 Public Records
- 2022-09-09 Sold (MLS) $93,000 NORIS
- 2022-08-19 Pending — NORIS
- 2022-07-28 Listed $107,900 NORIS
- 2022-01-13 Price Changed $675 RENT.
- 2021-07-09 Sold (Public Records) $120,000 Public Records
- 2018-08-06 Sold (Public Records) $30,000 Public Records
- 2018-08-01 Sold (MLS) $30,000 NORIS
- 2018-06-27 Listed $52,000 NORIS
- 2017-07-06 Sold (Public Records) $56,000 Public Records
- 2015-12-31 Sold (Public Records) $25,000 Public Records
- 2013-10-01 Sold (Public Records) $85,000 Public Records
- 2013-06-28 Sold (Public Records) $114,500 Public Records
- 2013-04-15 Sold (MLS) $23,000 NORIS
- 2013-03-22 Listed $24,000 NORIS
- 2013-03-22 Listing Removed — NORIS
- 2013-03-22 Listed $24,000 NORIS
- 2013-03-21 Listing Removed — NORIS
- 2013-02-12 Sold (Public Records) $40,000 Public Records
- 2012-10-04 Listed $34,000 NORIS
- 2007-12-31 Sold (Public Records) $269,900 Public Records
- 2003-05-23 Sold (Public Records) $160,000 Public Records
- 2003-05-23 Sold (Public Records) $143,000 Public Records
Property tax history
-1.0%/yrLatest (2025): $1,348 · +6.9% YoY. Source: county tax records.
Cash-flow waterfall
monthlySold comps — $/sqft
last 12 mo · ≤1 miLoading sold comps…