 Multi-family
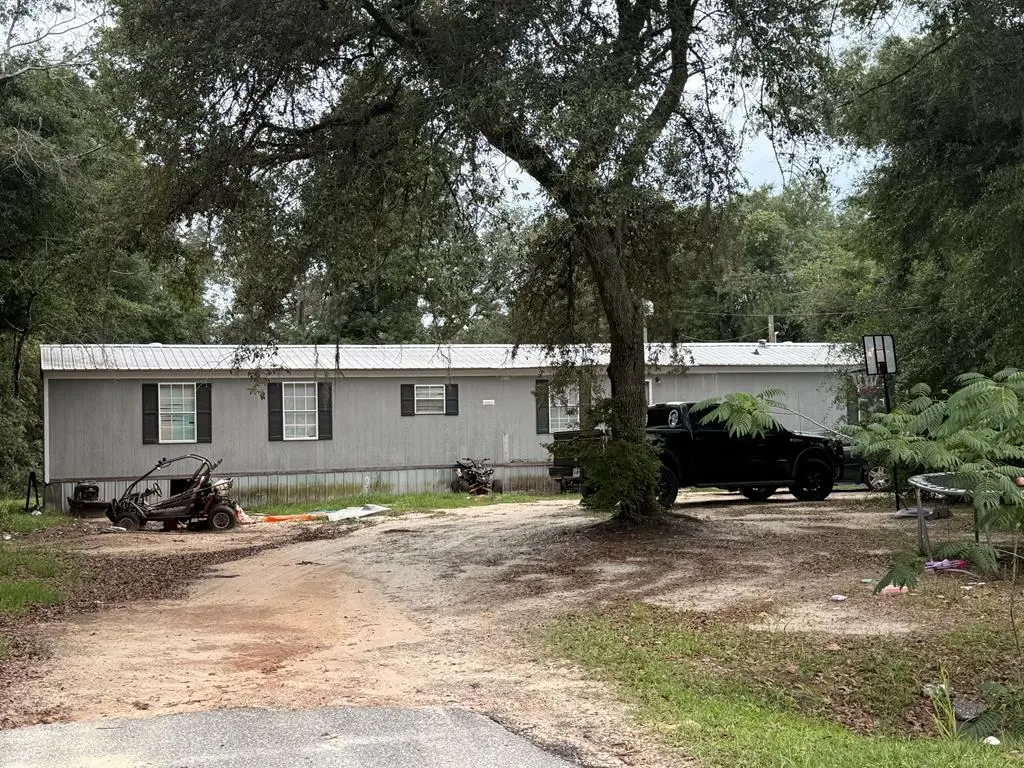
45 & 55 Sand Dollar Rd #2 · Douglas, GA
Flood risk 1/10 · Minimal
- FEMA flood zone
- X (unshaded)
- Chance of flooding over 30 yrs
- 0.0%
- Est. flood insurance / yr
- $507 – $1,088
Fire risk 6/10 · Moderate
- Est. fire insurance / yr
- $963 – $1,789
Heat risk 8/10 · Major
- Hot days now (above 108°F)
- 7 days/yr
- Hot days in 30 yrs
- 19 days/yr
Wind risk 8/10 · Major
- Chance of severe wind over 30 yrs
- 98.0%
Air-quality risk 3/10 · Minor
- Unhealthy air days now
- 2 days/yr
- Unhealthy air days in 30 yrs
- 4 days/yr
Risk factors via First Street. Map © Google.
Why this score? — see what drove the B- grade
The composite is a weighted blend of 9 inputs, each scored 0–100. Each bar is that input's sub-score; the figure is the points it added to the 100-point composite (weight × sub-score).
- Cash flow +30.0/30.0
- DSCR +10.0/10.0
- 1% rule +9.6/10.0
- ARV discount +7.5/15.0
- Livability +3.2/5.0
- Rent growth +2.5/5.0
- Schools +2.4/10.0
- Condition / age +2.2/5.0
- Appreciation +0.0/10.0
$165,750
🖨 Deal sheet 📄 Offer letter ✓ Due diligence
Multi-family units
County records classify this as Multi-Family (2-4 Unit). Listing-text estimate: 1 unit. estimate disagrees with records
Listing remarks
This income-producing property features two mobile homes situated on a single parcel, offering investors immediate cash flow with significant upside potential. The property includes a 3BR/2BA home currently rented for $700/month and a 2BR/2BA home currently rented for $600/month, while market rents support approximately $900/month and $800/month, respectively. Both tenants are currently on month-to-month leases, providing flexibility for investors to implement rental increases and capture additional income. One of the homes has benefited from a new metal roof, helping reduce near-term maintenance costs. The property is serviced by city water and septic, while tenants pay electricity and oth
Key facts
- New metal roof
- Septic
- City water
Tags
Property features AI
Finance
- Other: Subdivision: Hickory Ridge
- Financial info: Annual tax amount reported
Exterior
- Utilities: Public water; Septic tank sewer
- Home design: Multi-family residential property; Single-story; Multi-unit
- Construction: Metal siding construction
- Exterior features: Metal roof; Metal siding; Approximately 1.57 acres; Zoned R (residential)
Interior
- Interior features: No interior feature details available
Neighborhood map
What this means for you Summary
Snapshot
- This is a 5-bed/4.0-bath multifamily listed at $166k. Condition is rated fair.
Deal economics
- At list price, monthly cash flow is $767 ($9k/yr) — positive.
- The deal already cash-flows at list — no discount required.
- Meets the 1% rule at list price ($2k rent vs $166k).
- Recommended offer: $163k (1.5% below list) — sets the bar for market timing.
- Cap rate 11.8% vs local median 4.7% in Douglas — top-decile yield for the area; either an underpriced asset or a hidden risk that comps aren't pricing in. Stress-test before assuming the spread holds.
Location & tenants
- Location reads 64/100 on livability (#252 in GA) — a middle-class / working-renter tenant base. Strengths: cost of living A+, housing A; Watch: health & safety C-, crime D, schools F.
- Coffee County (rural): math 28% / reading 31% proficiency, ranked #99 of 174 in GA (top 57%) — low school quality limits family demand, transient renter base, plan for 1-2y turnover; 66% free/reduced lunch — lower-income household profile, screen leases tightly.
- Market conditions: 31 active listings in the ZIP; 110 units permitted in Coffee County in 2024 (6 in 5+ unit buildings).
Forward outlook
- Local home prices are declining (-3.0%/yr); year-one equity from $1k of loan paydown is wiped out by about $5k of value loss. Plan a longer hold.
- Coffee County population projected to shrink 4% by 2050 — rents likely to lag national; underwrite the cash flow, not the appreciation.
- At projected returns (-3.0% appreciation + 3.0% rent growth), your $46k cash investment doubles in ~7 years — after that, you're playing with house money.
Negotiation context
- It's been on market 16 days — a 2% lower offer ($163k) is reasonable based on typical stale-listing flexibility.
Risks & watch-outs
- Climate carrying-cost: severe wind risk, 98% chance of damaging wind over 30y; major wildfire risk; extreme-heat days projected 7→19/yr by 2055 (HVAC capex compounding) — expect insurance premiums to compound above CPI over the hold.
Questions for the listing agent
- Have any recent inspections been done? Can we get a copy of the seller's disclosures and any deferred-maintenance estimates?
- Is there a deadline driving the sale (1031 exchange, divorce, estate, relocation)? That informs how much negotiation room exists.
- Schools are F-rated, which usually means shorter tenancies and higher turnover. Who's the typical renter profile here, and what's been the actual vacancy rate?
- Crime grade is D in this area — have there been break-ins, vandalism, or insurance claims at this property in the last 3 years? What carrier currently insures it and at what premium?
- What's the average days-on-market for RENTAL listings here right now (not sales)? A rising rental-DOM trend means longer vacancies and softer asking-rent achievability than the comps imply.
- What's the recent tenant-quality profile in this submarket — average credit score on applications, eviction rate, late-payment / NSF rate, and stable-employment percentage? A property-management company in the area should have these aggregated.
- How much new apartment / multifamily construction is in the pipeline within 1–3 miles? Heavy new supply (>2% of stock underway) typically softens rents 12–24 months out; light construction supports rent growth.
Investment metrics
- 1% rule
- 1.46% ✓
- Cap rate
- 11.85%
- Cash-on-cash
- 19.84%
- DSCR
- 1.88
- GRM
- 5.7
CMA / ARV
No comps found within radius.
Projected returns pro-forma
-3.0% appreciation · 3.0% rent growth · sell at horizon
- IRR
- 12.0%
- Equity multiple
- 1.47×
- Total profit
- $22,037
- Equity at exit
- $24,714
- IRR
- 20.9%
- Equity multiple
- 2.77×
- Total profit
- $82,251
- Equity at exit
- $14,331
Cash invested: $46,410 (down + closing). Projections, not guarantees.
Landlord ↔ Tenant lean methodology
- Overall (STATE)
- 90 Strongly Landlord-Friendly
- State Georgia
- 90 Strongly Landlord-Friendly · R+3
- County
- — inherits STATE
- City
- — inherits STATE
ZIP-level market 31533
- Home prices YoY
- -21.6%
- Active inventory
- 31
- Price-to-rent
- 10.9×
Monthly cashflow live
- Estimated rent
- $2,421 medium interval (Pro) →
- Mortgage (P&I)
- −$869
- Tax est. 1.5%
- −$207 /mo · $2,486/yr
- Insurance
- −$69
- HOA
- −$0
- Vacancy / Maint / Mgmt
- −$508
- Net cashflow
- $767
Break-even live
2-unit breakdown (identical units grouped — click to expand)
| Units | Beds | Baths | Est. rent |
|---|---|---|---|
| 1× unit | 3 | 2 | $1,270 |
| 1× unit | 2 | 2 | $1,151 |
| Total (2 units) | $2,421 | ||
UW: 25.0% down · 7.5% · 30yr · 1.5% tax · 5.0% vac · 8.0% maint · 8.0% mgmt
Financing live
Cash to close
- Down payment
- $41,438
- Closing costs
- $4,972
- Reserves months
- —
- Total cash needed
- —
Loan-product check · same deal, 3 products live
Conventional
25% down · 7.5% · 30yr
- Down + closing
- —
- Monthly P&I
- —
- Monthly cashflow
- —
- DSCR
- —
- Eligible?
- —
Personal DTI + credit; lowest rate.
DSCR
20% down · 8.5% · 30yr
- Down + closing
- —
- Monthly P&I
- —
- Monthly cashflow
- —
- DSCR
- —
- Eligible?
- —
No personal income docs; deal must DSCR.
Hard money
10% down · 12.0% · 12mo
- Down + closing
- —
- Monthly P&I
- —
- Monthly cashflow
- —
- DSCR
- —
- Eligible?
- —
Short-term bridge; refi at stabilization.
Listing history 12 events
-
2026-06-18days on market $165,750 Active 16 DOM
-
2026-06-17days on market $165,750 Active 15 DOM
-
2026-06-16days on market $165,750 Active 14 DOM
-
2026-06-15days on market $165,750 Active 13 DOM
-
2026-06-13days on market $165,750 Active 11 DOM
-
2026-06-12days on market $165,750 Active 10 DOM
-
2026-06-09days on market $165,750 Active 7 DOM
-
2026-06-08days on market $165,750 Active 6 DOM
-
2026-06-07days on market $165,750 Active 5 DOM
-
2026-06-07days on market $165,750 Active 4 DOM
-
2026-06-03remarks 699-char remark
-
2026-06-03$165,750 Active 1 DOM
ⓘ Source: listings_history table (triggers on properties + properties_extension) + one-shot
backfill from property_details.listing_events for pre-trigger history.
Climate risk First Street
- Flood 1/10 Low FEMA zone X (unshaded) · 0% chance over 30 yrs
- Wildfire 6/10 Major
- Heat 8/10 Severe 7 d/yr ≥108°F today · 19 d/yr by 30 yrs out
- Wind 8/10 Severe 98% chance of damaging wind over 30 yrs
- Air quality 3/10 Moderate 2 unhealthy d/yr today · 4 by 30 yrs out
Nearby sold comps map
Loading sold comps map…
Walkable amenities ~0.75 mi
Loading nearby amenities…
Taxation est. · year 1
- Rental income
- $29,052
- − Mortgage interest
- −$9,285
- − Property taxes
- −$2,486
- − Insurance
- −$829
- − Repairs & maintenance
- −$2,324
- − Management
- −$2,324
- − Depreciation
- −$4,822
- Taxable income
- $6,982
- Est. tax owed @ 24.0%
- −$1,676
- After-tax cash flow
- $7,530/yr
For passive investors: Depreciation is non-cash, so a rental often shows a tax loss while cash-flowing — sheltering income. Rental losses are passive: they offset passive income freely, and up to $25,000/yr can offset ordinary (W-2) income if you actively participate and your MAGI is under $100k (phasing out to $0 by $150k); unused losses carry forward. On sale, claimed depreciation is recaptured at up to 25%, and gains may owe capital-gains tax (a 1031 exchange can defer both). Figures are a year-1 estimate at your 24.0% rate — not tax advice; consult a CPA.
Condition & rehab AI · 2 photos
This multi-family property requires significant repairs and maintenance, including a new roof and exterior painting, to improve its condition and value.
Repairs flagged
- Major roof — Visible rust and wear
- Major exterior siding — Peeling paint and visible wear
- Major landscaping — Minimal landscaping
Value-add opportunities
- Rental paint exterior siding — Fresh paint can improve curb appeal and tenant satisfaction
- Resale repair roof — A new roof can significantly increase the home's value
- Both landscaping — Improved landscaping can enhance curb appeal and attract more tenants
Renovation cost estimate screening
| Repair item | Severity | Est. cost |
|---|---|---|
| roof · Visible rust and wear | Major | $15,000–50,000 |
| exterior siding · Peeling paint and visible wear | Major | $15,000–50,000 |
| landscaping · Minimal landscaping | Major | $15,000–50,000 |
| Total estimated repair cost · 3 items | $45,000–150,000 |
Value-add ROI direction
- Rental paint exterior siding — Fresh paint can improve curb appeal and tenant satisfaction ↑
- Resale repair roof — A new roof can significantly increase the home's value ↑
- Both landscaping — Improved landscaping can enhance curb appeal and attract more tenants ↑
ⓘ Cost ranges are severity-bucket heuristics (US national rule-of-thumb). Get contractor quotes + a written scope before underwriting a rehab budget.
Schools (NCES district)
- District
- Coffee County
- NCES district ID
- 1301350
- Math proficiency
- 28% ▼ -12.00%
- Reading proficiency
- 31% ▼ -8.00%
- Median HH income
- $35,068
- Composite
- 24.36/100
- National rank
- #7693
- State rank
- #99 of 174 in GA
Livability — Douglas
- Score
- 64/100
- State rank
- #252
- US rank
- #14074
Category grades
Schools grade is shown separately in the Schools card above.
Census & demographics
- Population (ZIP)
- 17,464
Population outlook (Coffee County) Hauer SSP2
- Today (2025)
- 43,255 people
- By 2030
- 43,007 · -0.6%
- By 2040
- 42,337 · -2.1%
- By 2050
- 41,505 · -4.0%
- By 2075
- 39,695 · -8.2%
- By 2100
- 36,090 · -16.6%
Race, ethnicity, and origin ACS 2023
- Neighborhood character
- Diverse neighborhood (Simpson 0.63)
- Race & ethnicity
- White 48% Black 34% Hispanic / Latino 15% Two or more races 11%
- Hispanic origin (detail)
- Mexican 12%
- Common ancestry
- Slovak 2% Lithuanian 1% Serbian 1%
- Foreign-born
- 9% · Canada
- Languages at home
- 85% English-only · Spanish 14% Other Indo-European 1%
Political lean MEDSL · Coffee
- 2024 margin
- Solid R (+45.1) · D 27.3% · R 72.5%
- 2008→2024 swing
- -15.6pp toward R · 2008: -29.5pp · 2024: -45.1pp
- All cycles
- 2024: R+45.1 2020: R+39.9 2016: R+39.5 2012: R+29.1 2008: R+29.5
Not yet ingested
- Civics
- —
Market trends
- HPI YoY
- ▼ -51.34%
- Current HPI
- 186.6264
- Rent YoY
- —
- Metro
- —
- State GDP YoY
- ▲ 2.66%
- F500 in state
- 28
Industry mix (Fortune 500 HQ in GA)
| Industry | F500 HQs | Revenue |
|---|---|---|
| Paper / Packaging | 2 | $29B |
|
||
| Retail | 1 | $160B |
|
||
| Transportation / Logistics | 1 | $91B |
|
||
| Airlines | 1 | $62B |
|
||
| Consumer Goods | 1 | $47B |
|
||
| Utilities | 1 | $25B |
|
||
Price history
1 event — show timeline
- 2026-06-02 Listed $165,750 SGMLS
Cash-flow waterfall
monthlySold comps — $/sqft
last 12 mo · ≤1 miLoading sold comps…