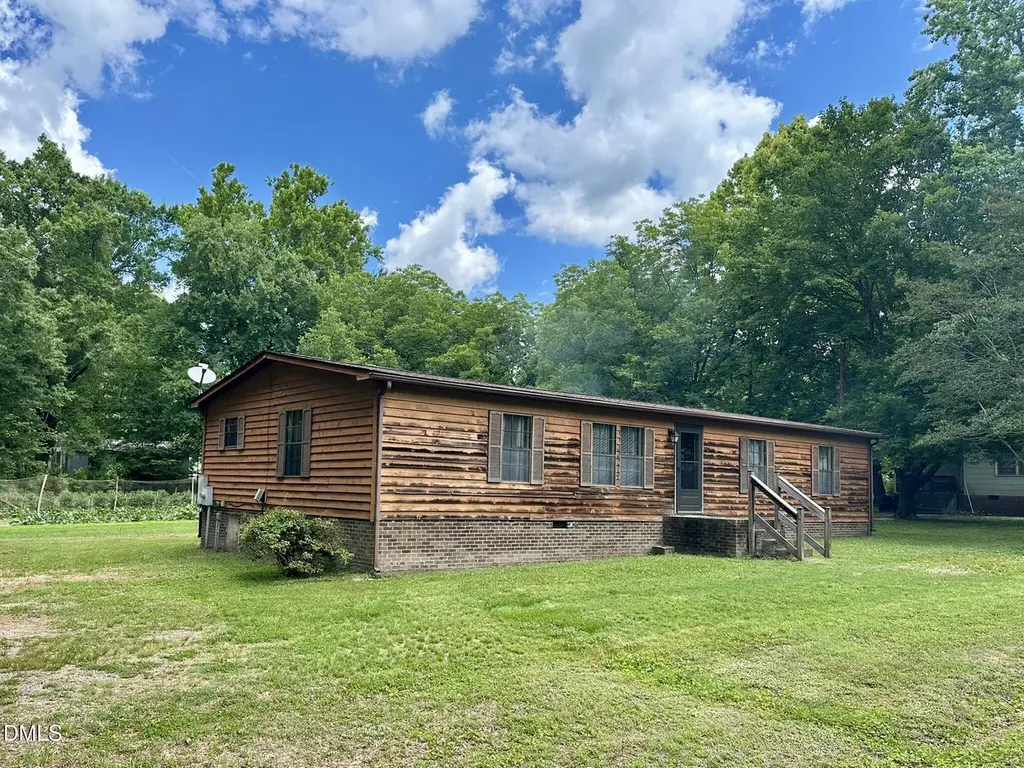
104 Virginia Ave · Norlina, NC
Flood risk 1/10 · Minimal
- FEMA flood zone
- X (unshaded)
- Chance of flooding over 30 yrs
- 0.0%
- Est. flood insurance / yr
- $507 – $1,088
Fire risk 3/10 · Minor
- Est. fire insurance / yr
- $906 – $1,684
Heat risk 6/10 · Moderate
- Hot days now (above 106°F)
- 7 days/yr
- Hot days in 30 yrs
- 16 days/yr
Wind risk 6/10 · Moderate
- Chance of severe wind over 30 yrs
- 39.0%
Air-quality risk 1/10 · Minimal
- Unhealthy air days now
- 0 days/yr
- Unhealthy air days in 30 yrs
- 0 days/yr
Risk factors via First Street. Map © Google.
Why this score? — see what drove the B- grade
The composite is a weighted blend of 9 inputs, each scored 0–100. Each bar is that input's sub-score; the figure is the points it added to the 100-point composite (weight × sub-score).
- Cash flow +22.4/30.0
- ARV discount +15.0/15.0
- Appreciation +7.8/10.0
- DSCR +7.2/10.0
- 1% rule +5.8/10.0
- Condition / age +3.8/5.0
- Livability +3.4/5.0
- Rent growth +2.5/5.0
- Schools +1.5/10.0
$129,000
🖨 Deal sheet 📄 Offer letter ✓ Due diligence
Listing remarks
Don't miss this opportunity to own a 3-bedroom, 2-bath home situated on a quiet street in Norlina, NC. Featuring public water and septic, this property offers excellent potential for investors, first-time buyers, or anyone looking for an affordable place to call home. With solid bones and plenty of possibilities, it's ready for your personal touches and vision. Conveniently located with small-town charm while still providing easy access to nearby amenities. Whether you're looking to add to your investment portfolio or settle into a home of your own, this property is worth a look!
Key facts
- Quiet street
- Easy access
- Septic
Tags
Property features AI
Finance
- Other: Lot size approximately 0.27 acres; Living area reported as 1,512
- Financial info:
- HOA & community: No homeowners association; No community amenities listed; Not a senior community
Exterior
- Parking:
- Security:
- Utilities: Public water; Public sewer
- Home design: Manufactured home (double wide); Single-story
- Construction: Cedar and other/unknown exterior materials; Shingle roof; Built in 1990
- Exterior features: No exterior amenities listed; No fencing
Interior
- Kitchen: Includes dishwasher, range, and refrigerator
- Bedrooms: 3 bedrooms (all on the main level)
- Flooring: Vinyl
- Bathrooms: 2 full bathrooms
- Heating & cooling: Electric heating; Electric cooling with heat pump
- Interior features: Dishwasher, Range, Refrigerator, Washer and Dryer; Vinyl flooring
- Laundry & utility: Washer and dryer included
Neighborhood map
What this means for you Summary
Snapshot
- This is a 3-bed/2.0-bath manufactured listed at $129k. Condition is rated good.
Deal economics
- At list price, monthly cash flow is $214 ($3k/yr) — positive.
- The deal already cash-flows at list — no discount required.
- Meets the 1% rule at list price ($1k rent vs $129k).
Location & tenants
- Location reads 68/100 on livability (#185 in NC) — a middle-class / working-renter tenant base. Strengths: cost of living A+, health & safety A+, crime A; Watch: amenities F, commute F, employment F.
- Warren County Schools (rural): math 11% / reading 25% proficiency, ranked #174 of 178 in NC (top 98%) — low school quality limits family demand, transient renter base, plan for 1-2y turnover; 79% free/reduced lunch — lower-income household profile, screen leases tightly.
- Zoned schools: Warren County High (math 15% / reading 27%, grade F, #488 of 535 statewide, top 91%, 384 students, 99% FRL) — zoned schools average 99% FRL vs 79% district-wide (20 pts higher); higher-poverty schools than district average — tighter screening recommended.
- Market conditions: 20 active listings in the ZIP; 255 units permitted in Warren County in 2024 (0 in 5+ unit buildings).
Forward outlook
- In year one you build about $8k of equity ($892 loan paydown + $7k appreciation (5.5% local appreciation)).
- Warren County population projected at -27% by 2050 — secular population decline; favor cash flow + early exit over multi-decade hold.
- At projected returns (5.5% appreciation + 3.0% rent growth), your $36k cash investment doubles in ~4 years — after that, you're playing with house money.
- By year 5, paydown + projected appreciation supports a ~$35k cash-out refi (75% LTV) — recoverable capital for the next deal without selling this one.
Negotiation context
- Only 12 days on market — expect competitive offers; lowballing is unlikely to land.
Risks & watch-outs
- Climate carrying-cost: major wind risk, 39% chance of damaging wind over 30y; extreme-heat days projected 7→16/yr by 2055 (HVAC capex compounding) — expect insurance premiums to compound above CPI over the hold.
Questions for the listing agent
- Is there a deadline driving the sale (1031 exchange, divorce, estate, relocation)? That informs how much negotiation room exists.
- Schools are F-rated, which usually means shorter tenancies and higher turnover. Who's the typical renter profile here, and what's been the actual vacancy rate?
- What's the average days-on-market for RENTAL listings here right now (not sales)? A rising rental-DOM trend means longer vacancies and softer asking-rent achievability than the comps imply.
- What's the recent tenant-quality profile in this submarket — average credit score on applications, eviction rate, late-payment / NSF rate, and stable-employment percentage? A property-management company in the area should have these aggregated.
- How much new for-sale + rental construction is in the pipeline within 1–3 miles? Heavy new supply typically softens prices + rents 12–24 months out; constrained supply supports both.
Investment metrics
- 1% rule
- 1.08% ✓
- Cap rate
- 8.28%
- Cash-on-cash
- 7.11%
- DSCR
- 1.32
- GRM
- 7.7
CMA / ARV
- ARV (on-the-fly)
- $161,784
- Comps found
- 1
Show comp detail 1 sale within ~0.75 mi
| Address | Dist | Beds/Ba | Sqft | Sold | Price | $/sf | Match |
|---|---|---|---|---|---|---|---|
| 202 High St | 0.39mi | 3/2.0 | 1,288 (-15%) | 20mo | $138,000 | $107 | 40 |
Match score weights: distance 35% · size 25% · config 20% · recency 20%. Top-matched comps best support the ARV.
Projected returns pro-forma
5.55% appreciation · 3.0% rent growth · sell at horizon
- IRR
- 20.2%
- Equity multiple
- 2.31×
- Total profit
- $47,487
- Equity at exit
- $77,467
- IRR
- 19.7%
- Equity multiple
- 4.60×
- Total profit
- $130,044
- Equity at exit
- $137,454
Cash invested: $36,120 (down + closing). Projections, not guarantees.
Landlord ↔ Tenant lean methodology
- Overall (STATE)
- 85 Strongly Landlord-Friendly
- State North Carolina
- 85 Strongly Landlord-Friendly · R+3
- County
- — inherits STATE
- City
- — inherits STATE
ZIP-level market 27563
- Home prices YoY
- 3.2%
- Active inventory
- 20
- Price-to-rent
- 7.7×
Monthly cashflow live
- Estimated rent
- $1,399 medium interval (Pro) →
- Mortgage (P&I)
- −$676
- Tax est. 1.5%
- −$161 /mo · $1,935/yr
- Insurance
- −$54
- HOA
- −$0
- Vacancy / Maint / Mgmt
- −$294
- Net cashflow
- $214
Break-even live
UW: 25.0% down · 7.5% · 30yr · 1.5% tax · 5.0% vac · 8.0% maint · 8.0% mgmt
Financing live
Cash to close
- Down payment
- $32,250
- Closing costs
- $3,870
- Reserves months
- —
- Total cash needed
- —
Loan-product check · same deal, 3 products live
Conventional
25% down · 7.5% · 30yr
- Down + closing
- —
- Monthly P&I
- —
- Monthly cashflow
- —
- DSCR
- —
- Eligible?
- —
Personal DTI + credit; lowest rate.
DSCR
20% down · 8.5% · 30yr
- Down + closing
- —
- Monthly P&I
- —
- Monthly cashflow
- —
- DSCR
- —
- Eligible?
- —
No personal income docs; deal must DSCR.
Hard money
10% down · 12.0% · 12mo
- Down + closing
- —
- Monthly P&I
- —
- Monthly cashflow
- —
- DSCR
- —
- Eligible?
- —
Short-term bridge; refi at stabilization.
Listing history 8 events
-
2026-06-16status $129,000 Pending 12 DOM
-
2026-06-15days on market $129,000 Active 12 DOM
-
2026-06-13days on market $129,000 Active 10 DOM
-
2026-06-09days on market $129,000 Active 6 DOM
-
2026-06-08days on market $129,000 Active 5 DOM
-
2026-06-07days on market $129,000 Active 4 DOM
-
2026-06-03remarks 586-char remark
-
2026-06-03$129,000 Active 1 DOM
ⓘ Source: listings_history table (triggers on properties + properties_extension) + one-shot
backfill from property_details.listing_events for pre-trigger history.
Climate risk First Street
- Flood 1/10 Low FEMA zone X (unshaded) · 0% chance over 30 yrs
- Wildfire 3/10 Moderate
- Heat 6/10 Major 7 d/yr ≥106°F today · 16 d/yr by 30 yrs out
- Wind 6/10 Major 39% chance of damaging wind over 30 yrs
- Air quality 1/10 Low 0 unhealthy d/yr today · 0 by 30 yrs out
Nearby sold comps map
Loading sold comps map…
Walkable amenities ~0.75 mi
Loading nearby amenities…
Taxation est. · year 1
- Rental income
- $16,792
- − Mortgage interest
- −$7,226
- − Property taxes
- −$1,935
- − Insurance
- −$645
- − Repairs & maintenance
- −$1,343
- − Management
- −$1,343
- − Depreciation
- −$3,753
- Taxable income
- $547
- Est. tax owed @ 24.0%
- −$131
- After-tax cash flow
- $2,437/yr
For passive investors: Depreciation is non-cash, so a rental often shows a tax loss while cash-flowing — sheltering income. Rental losses are passive: they offset passive income freely, and up to $25,000/yr can offset ordinary (W-2) income if you actively participate and your MAGI is under $100k (phasing out to $0 by $150k); unused losses carry forward. On sale, claimed depreciation is recaptured at up to 25%, and gains may owe capital-gains tax (a 1031 exchange can defer both). Figures are a year-1 estimate at your 24.0% rate — not tax advice; consult a CPA.
Condition & rehab AI · 12 photos
This 3-bedroom, 2-bath home in Norlina, NC, is in good condition with solid bones and plenty of potential. It's ready for a fresh coat of paint and some minor updates to enhance its curb appeal and value.
Value-add opportunities
- Resale Paint exterior siding — Fresh paint can enhance curb appeal and property value.
- Both Replace old flooring — New flooring can improve both the aesthetic and functionality of the home.
- Both Update kitchen appliances — Modern appliances can attract more buyers and renters.
- Both Install smart home devices — Smart home features can increase property value and attract tech-savvy buyers and renters.
Renovation cost estimate screening
Value-add ROI direction
- Resale Paint exterior siding — Fresh paint can enhance curb appeal and property value. ↑
- Both Replace old flooring — New flooring can improve both the aesthetic and functionality of the home. ↑
- Both Update kitchen appliances — Modern appliances can attract more buyers and renters. ↑
- Both Install smart home devices — Smart home features can increase property value and attract tech-savvy buyers and renters. ↑
ⓘ Cost ranges are severity-bucket heuristics (US national rule-of-thumb). Get contractor quotes + a written scope before underwriting a rehab budget.
Schools (NCES district)
- District
- Warren County Schools
- NCES district ID
- 3704740
- Math proficiency
- 11% ▼ -12.00%
- Reading proficiency
- 25% ▼ -3.00%
- Median HH income
- $33,433
- Composite
- 14.62/100
- National rank
- #9409
- State rank
- #174 of 178 in NC
Livability — Norlina
- Score
- 68/100
- State rank
- #185
- US rank
- #9302
Category grades
Schools grade is shown separately in the Schools card above.
Census & demographics
- Census place
- Norlina, NC
- Population (ZIP)
- 5,300
Population outlook (Warren County) Hauer SSP2
- Today (2025)
- 18,664 people
- By 2030
- 17,641 · -5.5%
- By 2040
- 15,442 · -17.3%
- By 2050
- 13,634 · -27.0%
- By 2075
- 10,523 · -43.6%
- By 2100
- 7,777 · -58.3%
Race, ethnicity, and origin ACS 2023
- Neighborhood character
- Majority Black (63%)
- Race & ethnicity
- Black 63% White 31% Two or more races 4%
- Common ancestry
- Lithuanian 2% Italian 1%
- Foreign-born
- 0% · Canada
- Languages at home
- 98% English-only · German/W. Germanic 1% Russian/Polish/Slavic 1% Spanish 1%
Political lean MEDSL · Warren
- 2024 margin
- D (+19.0) · D 58.8% · R 39.8% · Other 1.4%
- 2008→2024 swing
- -20.5pp toward R · 2008: 39.5pp · 2024: 19.0pp
- All cycles
- 2024: D+19.0 2020: D+25.7 2016: D+33.2 2012: D+36.0 2008: D+39.5
Not yet ingested
- Civics
- —
Market trends
- HPI YoY
- ▲ 5.55%
- Current HPI
- 181.0661
- Rent YoY
- —
- Metro
- —
- State GDP YoY
- ▲ 3.28%
- F500 in state
- 26
Industry mix (Fortune 500 HQ in NC)
| Industry | F500 HQs | Revenue |
|---|---|---|
| Financial Services | 2 | $213B |
|
||
| Retail | 2 | $95B |
|
||
| Industrial Conglomerate | 1 | $38B |
|
||
| Metals / Steel | 1 | $35B |
|
||
| Utilities | 1 | $30B |
|
||
| Industrial Machinery | 1 | $19B |
|
||
Price history
1 event — show timeline
- 2026-06-03 Listed $129,000 TMLS
Cash-flow waterfall
monthlySold comps — $/sqft
last 12 mo · ≤1 miLoading sold comps…