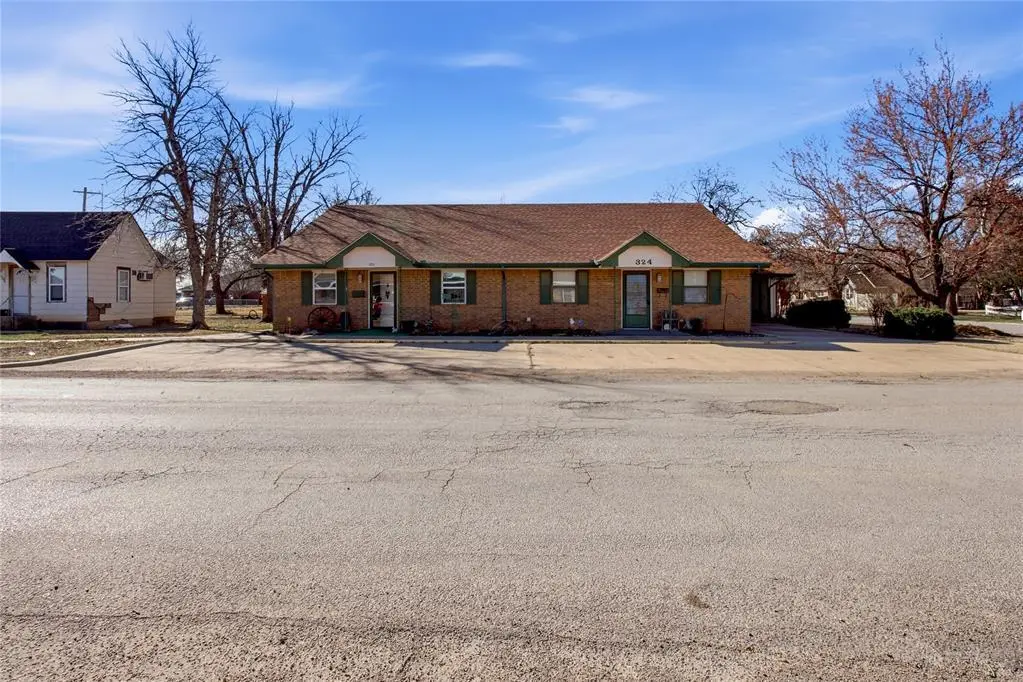
324 W 4th St · Hobart, OK
Flood risk No data
- FEMA flood zone
- —
- Chance of flooding over 30 yrs
- —
- Est. flood insurance / yr
- —
Fire risk No data
- Est. fire insurance / yr
- —
Heat risk No data
- Hot days now (above threshold)
- —
- Hot days in 30 yrs
- —
Wind risk No data
- Chance of severe wind over 30 yrs
- —
Air-quality risk No data
- Unhealthy air days now
- —
- Unhealthy air days in 30 yrs
- —
Risk factors via First Street. Map © Google.
Why this score? — see what drove the B+ grade
The composite is a weighted blend of 9 inputs, each scored 0–100. Each bar is that input's sub-score; the figure is the points it added to the 100-point composite (weight × sub-score).
- Cash flow +30.0/30.0
- 1% rule +10.0/10.0
- DSCR +10.0/10.0
- Appreciation +10.0/10.0
- ARV discount +7.5/15.0
- Livability +2.7/5.0
- Rent growth +2.5/5.0
- Condition / age +2.5/5.0
- Schools +2.1/10.0
$79,500
🖨 Deal sheet 📄 Offer letter ✓ Due diligence
Listing remarks
Charming, well-maintained brick home offering comfortable living and a functional layout at an affordable price! This attached single-family home features a spacious living area and a generously sized kitchen with abundant wood cabinetry, built-in storage, and a seamless flow into the dining space—perfect for everyday living. The primary bedroom includes a private bath, while the guest bathroom offers a convenient tub/shower combo. Additional features include a dedicated laundry area, central heat and air, and thoughtful built-in storage throughout the home. Exterior highlights include a durable brick exterior, attached garage with additional covered parking, a large concrete driv
Key facts
- 2,204 sq ft lot
- 2 garage spots
- Built 1983
Property features AI
Finance
- Other: Living area recorded as 1,372 (assessor); Property occupied: No; Listing status: Active; Directions: From S. Broadway Ave. and Southwest
- Financial info: Not assumable; Loan qualification unknown; Property is homestead exempt
- HOA & community: No mandatory association dues
Exterior
- Parking: 2-car garage
- Home design: Single-family residence; Residential property; One-level home; Facing/located in the Hills addition
- Construction: Brick and frame construction; Composition roof; Built (existing property)
- Exterior features: Interior lot; No special zoning district; No storm shelter
Interior
- Bedrooms: 2 bedrooms
- Bathrooms: 2 full bathrooms
- Interior features: One living area; No fireplace; Slab foundation
Neighborhood map
What this means for you Summary
Snapshot
- This is a 3-bed/2.0-bath single-family listed at $80k.
Deal economics
- At list price, monthly cash flow is $472 ($6k/yr) — positive.
- The deal already cash-flows at list — no discount required.
- Meets the 1% rule at list price ($1k rent vs $80k).
- Recommended offer: $75k (6.0% below list) — sets the bar for market timing.
- Cap rate 13.4% vs local median 8.3% in Hobart — top-decile yield for the area; either an underpriced asset or a hidden risk that comps aren't pricing in. Stress-test before assuming the spread holds.
Location & tenants
- Location reads 53/100 on livability (#627 in OK) — a working-class tenant base; expect higher turnover. Strengths: cost of living A+; Watch: crime D+, amenities F, commute F.
- Hobart (town): math 23% / reading 28% proficiency, ranked #110 of 270 in OK (top 41%) — low school quality limits family demand, transient renter base, plan for 1-2y turnover; 63% free/reduced lunch — lower-income household profile, screen leases tightly.
- Zoned schools: Hobart Es (math 32% / reading 27%, grade F, #255 of 845 statewide, top 35%, 366 students, 0% FRL); Hobart Hs (math 5% / reading 24%, grade F, #332 of 447 statewide, top 78%, 197 students, 0% FRL) — zoned schools average 0% FRL vs 63% district-wide (63 pts lower); this property's tenant base skews higher-income than the district average.
- Market conditions: 52 active listings in the ZIP.
Forward outlook
- In year one you build about $8k of equity ($550 loan paydown + $8k appreciation (10.0% local appreciation)).
- At projected returns (10.0% appreciation + 3.0% rent growth), your $22k cash investment doubles in ~2 years — after that, you're playing with house money.
- By year 4, paydown + projected appreciation supports a ~$30k cash-out refi (75% LTV) — recoverable capital for the next deal without selling this one.
Negotiation context
- It's been on market 85 days — a 6% lower offer ($75k) is reasonable based on typical stale-listing flexibility.
- Current owner paid $58k; 37% above their basis — modest negotiation headroom, anchor on the comps not their cost.
Questions for the listing agent
- It's been on market 85 days. Have you received any prior offers? Is the seller open to a 6% concession, seller financing, or rate buy-down credit?
- Why hasn't it sold? Are there any deal-killer items the seller is aware of (foundation, flood, title, zoning, code violations)?
- Is there a deadline driving the sale (1031 exchange, divorce, estate, relocation)? That informs how much negotiation room exists.
- Schools are F-rated, which usually means shorter tenancies and higher turnover. Who's the typical renter profile here, and what's been the actual vacancy rate?
- Crime grade is D in this area — have there been break-ins, vandalism, or insurance claims at this property in the last 3 years? What carrier currently insures it and at what premium?
- What's the average days-on-market for RENTAL listings here right now (not sales)? A rising rental-DOM trend means longer vacancies and softer asking-rent achievability than the comps imply.
- What's the recent tenant-quality profile in this submarket — average credit score on applications, eviction rate, late-payment / NSF rate, and stable-employment percentage? A property-management company in the area should have these aggregated.
- How much new for-sale + rental construction is in the pipeline within 1–3 miles? Heavy new supply typically softens prices + rents 12–24 months out; constrained supply supports both.
Investment metrics
- 1% rule
- 1.56% ✓
- Cap rate
- 13.41%
- Cash-on-cash
- 25.43%
- DSCR
- 2.13
- GRM
- 5.3
CMA / ARV
- ARV (on-the-fly)
- $79,576
- Comps found
- 12
Show comp detail 12 sales within ~0.75 mi
| Address | Dist | Beds/Ba | Sqft | Sold | Price | $/sf | Match |
|---|---|---|---|---|---|---|---|
| 215 N Washington | 0.41mi | 3/2.0 | 1,416 (+3%) | 9mo | $139,500 | $99 | 68 |
| 829 S Washington St | 0.45mi | 2/2.0 (-1) | 1,375 (+0%) | 10mo | $130,000 | $95 | 66 |
| 415 N Hitchcock St | 0.62mi | 3/1.0 | 1,372 (0%) | 6mo | $5,000 | $4 | 62 |
| 229 S Hill St | 0.12mi | 2/1.0 (-1) | 1,254 (-9%) | 15mo | $45,000 | $36 | 59 |
| 409 S Park Rd | 0.46mi | 3/1.0 | 1,366 (-0%) | 18mo | $79,000 | $58 | 58 |
| 118 S Hitchcock St | 0.32mi | 3/1.0 | 1,456 (+6%) | 20mo | $11,666 | $8 | 54 |
| 416 S Hill St | 0.03mi | 2/1.0 (-1) | 1,188 (-13%) | 20mo | $16,666 | $14 | 50 |
| 200 S Pueblo Ave | 0.45mi | 3/2.0 | 1,232 (-10%) | 19mo | $100,000 | $81 | 46 |
| 326 N Washington St | 0.52mi | 3/2.0 | 1,523 (+11%) | 18mo | $83,100 | $55 | 43 |
| 512 N Randlett St | 0.66mi | 3/1.0 | 1,248 (-9%) | 11mo | $115,000 | $92 | 42 |
| 325 W Dogwood St | 0.71mi | 2/1.0 (-1) | 1,246 (-9%) | 9mo | $73,000 | $59 | 35 |
| 309 N Stephens St | 0.63mi | 3/2.0 | 1,520 (+11%) | 24mo | $48,000 | $32 | 33 |
Match score weights: distance 35% · size 25% · config 20% · recency 20%. Top-matched comps best support the ARV.
Projected returns pro-forma
10.0% appreciation · 3.0% rent growth · sell at horizon
- IRR
- 43.4%
- Equity multiple
- 4.29×
- Total profit
- $73,340
- Equity at exit
- $71,620
- IRR
- 37.6%
- Equity multiple
- 9.64×
- Total profit
- $192,331
- Equity at exit
- $154,451
Cash invested: $22,260 (down + closing). Projections, not guarantees.
Landlord ↔ Tenant lean methodology
- Overall (STATE)
- 83 Strongly Landlord-Friendly
- State Oklahoma
- 83 Strongly Landlord-Friendly · R+20
- County
- — inherits STATE
- City
- — inherits STATE
ZIP-level market 73651
- Home prices YoY
- 8.0%
- Active inventory
- 52
- Price-to-rent
- 5.3×
Monthly cashflow live
- Estimated rent
- $1,240 medium interval (Pro) →
- Mortgage (P&I)
- −$417
- Tax from tax record
- −$58 /mo · $696/yr
- Insurance
- −$33
- HOA
- −$0
- Vacancy / Maint / Mgmt
- −$260
- Net cashflow
- $472
Break-even live
UW: 25.0% down · 7.5% · 30yr · 1.5% tax · 5.0% vac · 8.0% maint · 8.0% mgmt
Financing live
Cash to close
- Down payment
- $19,875
- Closing costs
- $2,385
- Reserves months
- —
- Total cash needed
- —
Loan-product check · same deal, 3 products live
Conventional
25% down · 7.5% · 30yr
- Down + closing
- —
- Monthly P&I
- —
- Monthly cashflow
- —
- DSCR
- —
- Eligible?
- —
Personal DTI + credit; lowest rate.
DSCR
20% down · 8.5% · 30yr
- Down + closing
- —
- Monthly P&I
- —
- Monthly cashflow
- —
- DSCR
- —
- Eligible?
- —
No personal income docs; deal must DSCR.
Hard money
10% down · 12.0% · 12mo
- Down + closing
- —
- Monthly P&I
- —
- Monthly cashflow
- —
- DSCR
- —
- Eligible?
- —
Short-term bridge; refi at stabilization.
Listing history 18 events
-
2026-06-18days on market $79,500 Active 85 DOM
-
2026-06-17days on market $79,500 Active 84 DOM
-
2026-06-16days on market $79,500 Active 83 DOM
-
2026-06-15days on market $79,500 Active 82 DOM
-
2026-06-13days on market $79,500 Active 80 DOM
-
2026-06-12days on market $79,500 Active 79 DOM
-
2026-06-09days on market $79,500 Active 76 DOM
-
2026-06-08days on market $79,500 Active 75 DOM
-
2026-06-08days on market $79,500 Active 74 DOM
-
2026-06-05days on market $79,500 Active 72 DOM
-
2026-06-04days on market $79,500 Active 70 DOM
-
2026-06-03price $79,500 Active 69 DOM
-
2026-06-02days on market $86,500 Active 69 DOM
-
2026-06-01days on market $86,500 Active 68 DOM
-
2026-05-31days on market $86,500 Active 67 DOM
-
2026-03-25$86,500 Active
-
2014-12-10soldstatus $58,000
-
2002-07-10soldstatus $57,500
ⓘ Source: listings_history table (triggers on properties + properties_extension) + one-shot
backfill from property_details.listing_events for pre-trigger history.
Tax reassessment forecast OK · Resets to sale price
- Current annual tax
- $696 · $58/mo
- Projected year-2 tax
- $716 · $60/mo
- Expected delta
- +$20/yr (+$2/mo · 2.8%)
ⓘ Screening estimate from a state-policy table — verify with the county assessor before closing.
Nearby sold comps map
Loading sold comps map…
Walkable amenities ~0.75 mi
Loading nearby amenities…
Taxation est. · year 1
- Rental income
- $14,883
- − Mortgage interest
- −$4,453
- − Property taxes
- −$696
- − Insurance
- −$398
- − Repairs & maintenance
- −$1,191
- − Management
- −$1,191
- − Depreciation
- −$2,313
- Taxable income
- $4,643
- Est. tax owed @ 24.0%
- −$1,114
- After-tax cash flow
- $4,547/yr
For passive investors: Depreciation is non-cash, so a rental often shows a tax loss while cash-flowing — sheltering income. Rental losses are passive: they offset passive income freely, and up to $25,000/yr can offset ordinary (W-2) income if you actively participate and your MAGI is under $100k (phasing out to $0 by $150k); unused losses carry forward. On sale, claimed depreciation is recaptured at up to 25%, and gains may owe capital-gains tax (a 1031 exchange can defer both). Figures are a year-1 estimate at your 24.0% rate — not tax advice; consult a CPA.
Schools (NCES district)
- District
- Hobart
- NCES district ID
- 4014700
- Math proficiency
- 23% ▼ -6.00%
- Reading proficiency
- 28% ▼ -8.00%
- Median HH income
- $36,779
- Composite
- 21.2/100
- National rank
- #8417
- State rank
- #110 of 270 in OK
Livability — Hobart
- Score
- 53/100
- State rank
- #627
- US rank
- #24677
Category grades
Schools grade is shown separately in the Schools card above.
Census & demographics
- Census place
- Hobart, OK
- City population
- 4,070
- Population (ZIP)
- 4,070
Population outlook (Kiowa County) Hauer SSP2
- Today (2025)
- 8,842 people
- By 2030
- 8,733 · -1.2%
- By 2040
- 8,641 · -2.3%
- By 2050
- 8,758 · -1.0%
- By 2075
- 9,894 · +11.9%
- By 2100
- 11,194 · +26.6%
Race, ethnicity, and origin ACS 2023
- Neighborhood character
- Predominantly White (72%)
- Race & ethnicity
- White 72% Hispanic / Latino 15% Two or more races 10% Black 4% Native American 2%
- Hispanic origin (detail)
- Mexican 13%
- Common ancestry
- Iranian 8% Italian 2% Slovak 1%
- Foreign-born
- 1% · Canada
- Languages at home
- 90% English-only · Spanish 10%
Political lean MEDSL · Kiowa
- 2024 margin
- Solid R (+58.3) · D 20.1% · R 78.4% · Other 1.6%
- 2008→2024 swing
- -23.5pp toward R · 2008: -34.8pp · 2024: -58.3pp
- All cycles
- 2024: R+58.3 2020: R+57.6 2016: R+52.4 2012: R+35.4 2008: R+34.8
Not yet ingested
- Civics
- —
Market trends
- HPI YoY
- ▲ 11.68%
- Current HPI
- 158.6311
- Rent YoY
- —
- Metro
- —
- State GDP YoY
- ▲ 1.55%
- F500 in state
- 6
Industry mix (Fortune 500 HQ in OK)
| Industry | F500 HQs | Revenue |
|---|---|---|
| Energy | 3 | $48B |
|
||
Price history
+50.4% since first listed3 events — show timeline
- 2026-03-25 Listed $86,500 MLSOK
- 2014-12-10 Sold (Public Records) $58,000 Public Records
- 2002-07-10 Sold (Public Records) $57,500 Public Records
Property tax history
+4.1%/yrLatest (2025): $696 · -1.7% YoY. Source: county tax records.
Cash-flow waterfall
monthlySold comps — $/sqft
last 12 mo · ≤1 miLoading sold comps…