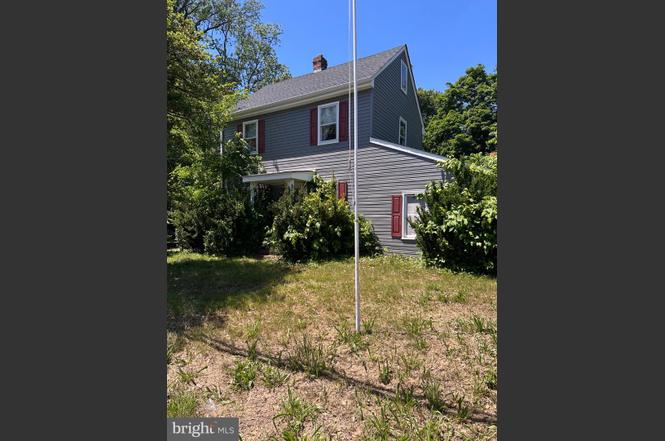
677 Monmouth Rd · McGuire AFB, NJ
Flood risk 1/10 · Minimal
- FEMA flood zone
- X (unshaded)
- Chance of flooding over 30 yrs
- 0.0%
- Est. flood insurance / yr
- $507 – $1,088
Fire risk 2/10 · Minimal
- Est. fire insurance / yr
- $526 – $976
Heat risk 6/10 · Moderate
- Hot days now (above 102°F)
- 7 days/yr
- Hot days in 30 yrs
- 15 days/yr
Wind risk 6/10 · Moderate
- Chance of severe wind over 30 yrs
- 66.0%
Air-quality risk 4/10 · Minor
- Unhealthy air days now
- 4 days/yr
- Unhealthy air days in 30 yrs
- 5 days/yr
Risk factors via First Street. Map © Google.
Why this score? — see what drove the C- grade
The composite is a weighted blend of 9 inputs, each scored 0–100. Each bar is that input's sub-score; the figure is the points it added to the 100-point composite (weight × sub-score).
- Cash flow +15.1/30.0
- Appreciation +8.7/10.0
- ARV discount +7.5/15.0
- 1% rule +5.2/10.0
- DSCR +4.6/10.0
- Schools +3.9/10.0
- Livability +3.0/5.0
- Rent growth +2.5/5.0
- Condition / age +2.5/5.0
$170,000
🖨 Deal sheet 📄 Offer letter ✓ Due diligence
Listing remarks
2 Bedroom 1 bath rehab on about . 80 acre . This property is being sold through a guardianship and may take 3 to 6 months to close. Please assume the property will not be cleaned out. Property is being sold in as is condition and buyer is responsible for any and all inspections for the CO and to transfer title. Buyer is responsible to confirm all utilities.
Key facts
- 0.8 acre lot
- Built 1850
- Listed 3 days
Property features AI
Finance
- Other: Ownership: fee simple
Exterior
- Parking: Driveway
- Utilities: Water source: other
- Home design: Detached structure; Year built: estimated
- Construction: Frame construction; Foundation: other
- Exterior features: Lot dimensions approximately 98 x 363; No tidal water on the property; Other above- and below-grade structures present
Interior
- Bedrooms: One bedroom on the main level; One bedroom on the upper level
- Bathrooms: One full bathroom on the main level; One full bathroom total
- Heating & cooling: Heating: other; Heating fuel: other; Hot water: other
- Interior features: Finished above-grade living area recorded by assessor; Basement present (other type)
Neighborhood map
What this means for you Summary
Snapshot
- This is a 2-bed/1.0-bath single-family listed at $170k.
Deal economics
- At list price, monthly cash flow is $56 ($676/yr) — positive.
- The deal already cash-flows at list — no discount required.
- Meets the 1% rule at list price ($2k rent vs $170k).
Location & tenants
- Location reads 60/100 on livability (#479 in NJ) — a middle-class / working-renter tenant base. Strengths: employment A+, crime A, housing B; Watch: schools C-, amenities F, commute F.
- Northern Burlington County Regional School District (rural): math 27% / reading 57% proficiency, ranked #198 of 472 in NJ (top 42%) — families likely to look elsewhere, expect single-tenant / working-renter base with shorter leases; only 8% free/reduced lunch — higher-income household profile.
- Market conditions: 33 active listings in the ZIP; 2,161 units permitted in Burlington County in 2024 (988 in 5+ unit buildings).
Forward outlook
- In year one you build about $14k of equity ($1k loan paydown + $12k appreciation (7.3% local appreciation)).
- Burlington County population projected to shrink 5% by 2050 — rents likely to lag national; underwrite the cash flow, not the appreciation.
- At projected returns (7.3% appreciation + 3.0% rent growth), your $48k cash investment doubles in ~4 years — after that, you're playing with house money.
- By year 3, paydown + projected appreciation supports a ~$34k cash-out refi (75% LTV) — recoverable capital for the next deal without selling this one.
Negotiation context
- Only 3 days on market — expect competitive offers; lowballing is unlikely to land.
Risks & watch-outs
- Watch-outs: built in 1850 — expect roof / HVAC / electrical / plumbing capex.
- Climate carrying-cost: major wind risk, 66% chance of damaging wind over 30y; extreme-heat days projected 7→15/yr by 2055 (HVAC capex compounding) — expect insurance premiums to compound above CPI over the hold.
Questions for the listing agent
- Built in 1850 — when were the roof, HVAC, electrical panel, plumbing, and water heater last replaced?
- Is there a deadline driving the sale (1031 exchange, divorce, estate, relocation)? That informs how much negotiation room exists.
- What's the average days-on-market for RENTAL listings here right now (not sales)? A rising rental-DOM trend means longer vacancies and softer asking-rent achievability than the comps imply.
- What's the recent tenant-quality profile in this submarket — average credit score on applications, eviction rate, late-payment / NSF rate, and stable-employment percentage? A property-management company in the area should have these aggregated.
- How much new for-sale + rental construction is in the pipeline within 1–3 miles? Heavy new supply typically softens prices + rents 12–24 months out; constrained supply supports both.
Investment metrics
- 1% rule
- 1.02% ✓
- Cap rate
- 6.69%
- Cash-on-cash
- 1.42%
- DSCR
- 1.06
- GRM
- 8.2
CMA / ARV
No comps found within radius.
Projected returns pro-forma
7.34% appreciation · 3.0% rent growth · sell at horizon
- IRR
- 19.6%
- Equity multiple
- 2.40×
- Total profit
- $66,591
- Equity at exit
- $121,562
- IRR
- 18.5%
- Equity multiple
- 5.01×
- Total profit
- $190,817
- Equity at exit
- $234,397
Cash invested: $47,600 (down + closing). Projections, not guarantees.
Landlord ↔ Tenant lean methodology
- Overall (STATE)
- 21 Tenant-Leaning
- State New Jersey
- 21 Tenant-Leaning · D+6
- County
- — inherits STATE
- City
- — inherits STATE
ZIP-level market 08562
- Home prices YoY
- 2.5%
- Active inventory
- 33
- Price-to-rent
- 8.2×
Monthly cashflow live
- Estimated rent
- $1,733 medium interval (Pro) →
- Mortgage (P&I)
- −$891
- Tax from tax record
- −$350 /mo · $4,205/yr
- Insurance
- −$71
- HOA
- −$0
- Vacancy / Maint / Mgmt
- −$364
- Net cashflow
- $56
Break-even live
UW: 25.0% down · 7.5% · 30yr · 1.5% tax · 5.0% vac · 8.0% maint · 8.0% mgmt
Financing live
Cash to close
- Down payment
- $42,500
- Closing costs
- $5,100
- Reserves months
- —
- Total cash needed
- —
Loan-product check · same deal, 3 products live
Conventional
25% down · 7.5% · 30yr
- Down + closing
- —
- Monthly P&I
- —
- Monthly cashflow
- —
- DSCR
- —
- Eligible?
- —
Personal DTI + credit; lowest rate.
DSCR
20% down · 8.5% · 30yr
- Down + closing
- —
- Monthly P&I
- —
- Monthly cashflow
- —
- DSCR
- —
- Eligible?
- —
No personal income docs; deal must DSCR.
Hard money
10% down · 12.0% · 12mo
- Down + closing
- —
- Monthly P&I
- —
- Monthly cashflow
- —
- DSCR
- —
- Eligible?
- —
Short-term bridge; refi at stabilization.
Listing history 4 events
-
2026-06-18days on market $170,000 Active 3 DOM
-
2026-06-17days on market $170,000 Active 2 DOM
-
2026-06-15remarks 359-char remark
-
2026-06-15$170,000 Active 1 DOM
ⓘ Source: listings_history table (triggers on properties + properties_extension) + one-shot
backfill from property_details.listing_events for pre-trigger history.
Tax reassessment forecast NJ · Partial reset (capped growth)
- Current annual tax
- $4,205 · $350/mo
- Projected year-2 tax
- $4,219 · $352/mo
- Expected delta
- +$14/yr (+$1/mo · 0.3%)
ⓘ Screening estimate from a state-policy table — verify with the county assessor before closing.
Climate risk First Street
- Flood 1/10 Low FEMA zone X (unshaded) · 0% chance over 30 yrs
- Wildfire 2/10 Low
- Heat 6/10 Major 7 d/yr ≥102°F today · 15 d/yr by 30 yrs out
- Wind 6/10 Major 66% chance of damaging wind over 30 yrs
- Air quality 4/10 Moderate 4 unhealthy d/yr today · 5 by 30 yrs out
Nearby sold comps map
Loading sold comps map…
Walkable amenities ~0.75 mi
Loading nearby amenities…
Taxation est. · year 1
- Rental income
- $20,796
- − Mortgage interest
- −$9,523
- − Property taxes
- −$4,205
- − Insurance
- −$850
- − Repairs & maintenance
- −$1,664
- − Management
- −$1,664
- − Depreciation
- −$4,945
- Taxable loss
- −$2,055
- Est. tax savings @ 24.0%
- +$493
- After-tax cash flow
- $1,169/yr
For passive investors: Depreciation is non-cash, so a rental often shows a tax loss while cash-flowing — sheltering income. Rental losses are passive: they offset passive income freely, and up to $25,000/yr can offset ordinary (W-2) income if you actively participate and your MAGI is under $100k (phasing out to $0 by $150k); unused losses carry forward. On sale, claimed depreciation is recaptured at up to 25%, and gains may owe capital-gains tax (a 1031 exchange can defer both). Figures are a year-1 estimate at your 24.0% rate — not tax advice; consult a CPA.
Schools (NCES district)
- District
- Northern Burlington County Regional School District
- NCES district ID
- 3411700
- Math proficiency
- 27% ▼ -22.00%
- Reading proficiency
- 57% ▼ -10.00%
- Median HH income
- $82,110
- Composite
- 39.1/100
- National rank
- #4042
- State rank
- #198 of 472 in NJ
Livability — McGuire AFB
- Score
- 60/100
- State rank
- #479
- US rank
- #18722
Category grades
Schools grade is shown separately in the Schools card above.
Census & demographics
- City population
- 4,491
- Population (ZIP)
- 4,301
Population outlook (Burlington County) Hauer SSP2
- Today (2025)
- 453,425 people
- By 2030
- 452,359 · -0.2%
- By 2040
- 445,033 · -1.9%
- By 2050
- 431,760 · -4.8%
- By 2075
- 406,277 · -10.4%
- By 2100
- 364,732 · -19.6%
Race, ethnicity, and origin ACS 2023
- Neighborhood character
- Predominantly White (67%)
- Race & ethnicity
- White 67% Two or more races 22% Hispanic / Latino 15% Black 6%
- Hispanic origin (detail)
- Mexican 10% Puerto Rican 2%
- Common ancestry
- Romanian 10% Lithuanian 3% Slovak 2%
- Foreign-born
- 11% · Canada, Jamaica
- Languages at home
- 84% English-only · Spanish 12% Russian/Polish/Slavic 2% Tagalog/Filipino 1%
Political lean MEDSL · Burlington
- 2024 margin
- D (+16.6) · D 57.6% · R 41.0% · Other 1.3%
- 2008→2024 swing
- -2.0pp toward R · 2008: 18.6pp · 2024: 16.6pp
- All cycles
- 2024: D+16.6 2020: D+19.5 2016: D+14.8 2012: D+18.7 2008: D+18.6
Not yet ingested
- Civics
- —
Market trends
- HPI YoY
- ▲ 7.34%
- Current HPI
- 306.1085
- Rent YoY
- —
- Metro
- —
- State GDP YoY
- ▲ 2.05%
- F500 in state
- 34
Industry mix (Fortune 500 HQ in NJ)
| Industry | F500 HQs | Revenue |
|---|---|---|
| Consumer Goods | 3 | $31B |
|
||
| Pharmaceuticals | 2 | $153B |
|
||
| Technology | 2 | $21B |
|
||
| Insurance | 2 | $20B |
|
||
| Healthcare | 2 | $19B |
|
||
| Financial Services | 1 | $70B |
|
||
Price history
+428.0% since first listed5 events — show timeline
- 2026-06-15 Listed $170,000 BRIGHT MLS
- 2001-03-30 Sold (Public Records) $215,000 Public Records
- 1981-09-01 Sold (Public Records) $26,500 Public Records
- 1979-03-01 Sold (Public Records) $10,000 Public Records
- 1978-11-01 Sold (Public Records) $32,200 Public Records
Property tax history
+0.9%/yrLatest (2025): $4,205 · +4.3% YoY. Source: county tax records.
Cash-flow waterfall
monthlySold comps — $/sqft
last 12 mo · ≤1 miLoading sold comps…