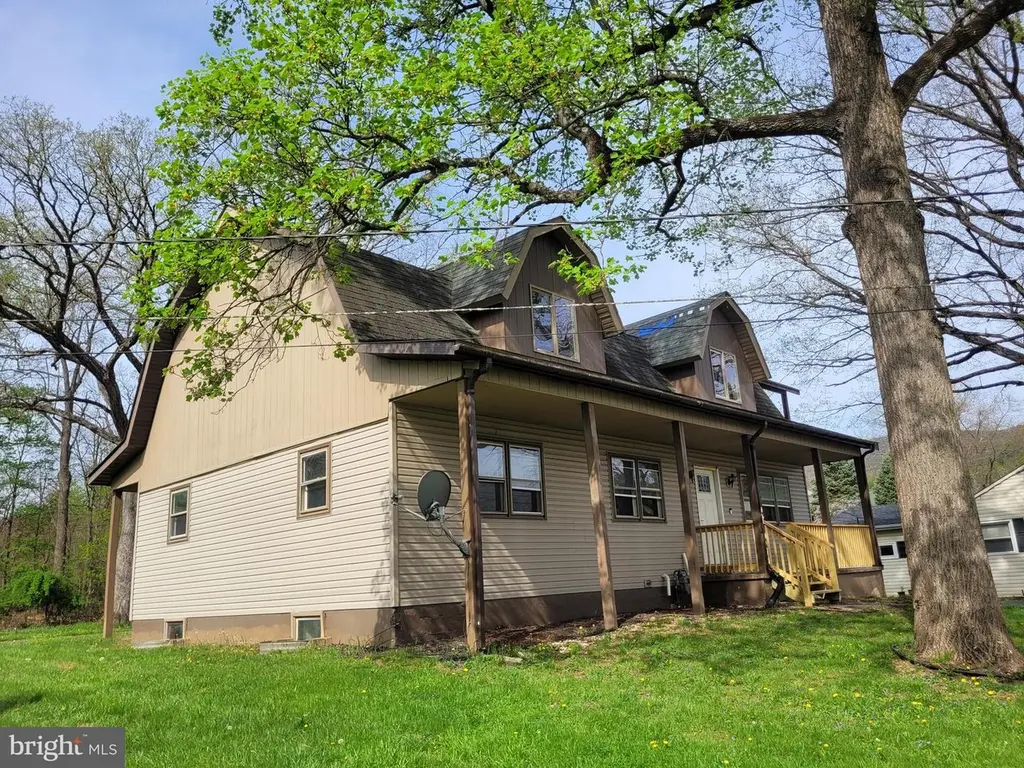
23 Oaklawn Ave · La Vale, MD
Flood risk 1/10 · Minimal
- FEMA flood zone
- X (unshaded)
- Chance of flooding over 30 yrs
- 0.0%
- Est. flood insurance / yr
- $473 – $860
Fire risk 2/10 · Minimal
- Est. fire insurance / yr
- $755 – $1,403
Heat risk 4/10 · Minor
- Hot days now (above 100°F)
- 7 days/yr
- Hot days in 30 yrs
- 18 days/yr
Wind risk 2/10 · Minimal
- Chance of severe wind over 30 yrs
- —
Air-quality risk 2/10 · Minimal
- Unhealthy air days now
- 0 days/yr
- Unhealthy air days in 30 yrs
- 1 days/yr
Risk factors via First Street. Map © Google.
Why this score? — see what drove the C- grade
The composite is a weighted blend of 9 inputs, each scored 0–100. Each bar is that input's sub-score; the figure is the points it added to the 100-point composite (weight × sub-score).
- Cash flow +21.3/30.0
- ARV discount +7.5/15.0
- DSCR +6.8/10.0
- 1% rule +5.4/10.0
- Rent growth +5.0/5.0
- Livability +3.9/5.0
- Condition / age +2.5/5.0
- Schools +1.9/10.0
- Appreciation +0.0/10.0
$154,900
🖨 Deal sheet 📄 Offer letter ✓ Due diligence
Listing remarks MLS
Property being sold as is . Please take a look at this great cape cod with lots of potential and modern kitchen
Key facts
- 9,632 sq ft lot
- Built 1981
- Listed 58 days
Neighborhood map
What this means for you Summary
Snapshot
- This is a 5-bed/2.0-bath single-family listed at $155k.
Deal economics
- At list price, monthly cash flow is $227 ($3k/yr) — positive.
- The deal already cash-flows at list — no discount required.
- Meets the 1% rule at list price ($2k rent vs $155k).
- Recommended offer: $150k (3.0% below list) — sets the bar for market timing.
Location & tenants
- Location reads 77/100 on livability (#82 in MD, #3,161 nationally) — a middle-class / working-renter tenant base. Strengths: employment A+, cost of living A+, housing A+; Watch: amenities F, commute F.
- Allegany County Public Schools (other): math 15% / reading 30% proficiency, ranked #18 of 24 in MD (top 75%) — low school quality limits family demand, transient renter base, plan for 1-2y turnover.
- Market conditions: Rents rising fast (+10.9%/yr); 235 active listings in the ZIP; 24 units permitted in Allegany County in 2024 (0 in 5+ unit buildings).
- This rent runs 32% of the median local income ($61k/yr) — at the standard rent-burdened threshold; future hikes will face affordability resistance.
Forward outlook
- Local home prices are declining (-3.0%/yr); year-one equity from $1k of loan paydown is wiped out by about $5k of value loss. Plan a longer hold.
- Allegany County population projected at -14% by 2050 — secular population decline; favor cash flow + early exit over multi-decade hold.
- At projected returns (-3.0% appreciation + 8.0% rent growth), your $43k cash investment doubles in ~9 years — after that, you're playing with house money.
Negotiation context
- It's been on market 59 days — a 3% lower offer ($150k) is reasonable based on typical stale-listing flexibility.
- 6 sale attempts since 12y ago with the ask held roughly flat each time — persistent listings suggest the price (not the market) is what's stuck; bring a comps-based counter.
Questions for the listing agent
- It's been on market 59 days. Have you received any prior offers? Is the seller open to a 3% concession, seller financing, or rate buy-down credit?
- Is there a deadline driving the sale (1031 exchange, divorce, estate, relocation)? That informs how much negotiation room exists.
- Schools are B-rated — typically a magnet for longer-tenancy family renters. What's the average tenant stay here, and is there a school-zone premium baked into asking?
- What's the average days-on-market for RENTAL listings here right now (not sales)? A rising rental-DOM trend means longer vacancies and softer asking-rent achievability than the comps imply.
- What's the recent tenant-quality profile in this submarket — average credit score on applications, eviction rate, late-payment / NSF rate, and stable-employment percentage? A property-management company in the area should have these aggregated.
- How much new for-sale + rental construction is in the pipeline within 1–3 miles? Heavy new supply typically softens prices + rents 12–24 months out; constrained supply supports both.
Investment metrics
- 1% rule
- 1.04% ✓
- Cap rate
- 8.05%
- Cash-on-cash
- 6.27%
- DSCR
- 1.28
- GRM
- 8.0
CMA / ARV
- ARV (median comp)
- $329,185
- List price
- $154,900
- Delta
- -52.94%
- Verdict
- UNDERPRICED
- Comps
- 20 within 1.0 mi
Show comp detail 4 sales within ~0.75 mi
| Address | Dist | Beds/Ba | Sqft | Sold | Price | $/sf | Match |
|---|---|---|---|---|---|---|---|
| 906 Weires Ave | 0.44mi | 5/3.0 | 3,158 (+2%) | 14mo | $299,900 | $95 | 60 |
| 15 Warfield Pl | 0.55mi | 5/2.5 | 2,830 (-8%) | 8mo | $305,000 | $108 | 52 |
| 207 Sunset Dr | 0.71mi | 4/3.0 (-1) | 3,181 (+3%) | 10mo | $260,000 | $82 | 44 |
| 1021 National Hwy | 0.39mi | 6/3.0 (+1) | 3,320 (+8%) | 22mo | $239,000 | $72 | 42 |
Match score weights: distance 35% · size 25% · config 20% · recency 20%. Top-matched comps best support the ARV.
Projected returns pro-forma
-3.0% appreciation · 8.0% rent growth · sell at horizon
- IRR
- -1.2%
- Equity multiple
- 0.95×
- Total profit
- $-2,129
- Equity at exit
- $23,096
- IRR
- 13.1%
- Equity multiple
- 2.28×
- Total profit
- $55,578
- Equity at exit
- $13,393
Cash invested: $43,372 (down + closing). Projections, not guarantees.
Landlord ↔ Tenant lean methodology
- Overall (STATE)
- 27 Tenant-Leaning
- State Maryland
- 27 Tenant-Leaning · D+14
- County
- — inherits STATE
- City
- — inherits STATE
ZIP-level market 21502
- Home prices YoY
- -17.4%
- Rents YoY
- 10.9%
- Active inventory
- 235
- Price-to-rent
- 8.0×
Monthly cashflow live
- Estimated rent
- $1,613 medium interval (Pro) →
- Mortgage (P&I)
- −$812
- Tax from tax record
- −$171 /mo · $2,050/yr
- Insurance
- −$65
- HOA
- −$0
- Vacancy / Maint / Mgmt
- −$339
- Net cashflow
- $227
Break-even live
UW: 25.0% down · 7.5% · 30yr · 1.5% tax · 5.0% vac · 8.0% maint · 8.0% mgmt
Financing live
Cash to close
- Down payment
- $38,725
- Closing costs
- $4,647
- Reserves months
- —
- Total cash needed
- —
Loan-product check · same deal, 3 products live
Conventional
25% down · 7.5% · 30yr
- Down + closing
- —
- Monthly P&I
- —
- Monthly cashflow
- —
- DSCR
- —
- Eligible?
- —
Personal DTI + credit; lowest rate.
DSCR
20% down · 8.5% · 30yr
- Down + closing
- —
- Monthly P&I
- —
- Monthly cashflow
- —
- DSCR
- —
- Eligible?
- —
No personal income docs; deal must DSCR.
Hard money
10% down · 12.0% · 12mo
- Down + closing
- —
- Monthly P&I
- —
- Monthly cashflow
- —
- DSCR
- —
- Eligible?
- —
Short-term bridge; refi at stabilization.
Listing history 34 events
-
2026-06-19days on market $154,900 Active 59 DOM
-
2026-06-18days on market $154,900 Active 58 DOM
-
2026-06-17days on market $154,900 Active 57 DOM
-
2026-06-16days on market $154,900 Active 56 DOM
-
2026-06-15days on market $154,900 Active 55 DOM
-
2026-06-14days on market $154,900 Active 53 DOM
-
2026-06-12days on market $154,900 Active 52 DOM
-
2026-06-09days on market $154,900 Active 49 DOM
-
2026-06-08days on market $154,900 Active 48 DOM
-
2026-06-07days on market $154,900 Active 47 DOM
-
2026-06-02days on market $154,900 Active 42 DOM
-
2026-06-01days on market $154,900 Active 41 DOM
-
2026-05-31days on market $154,900 Active 40 DOM
-
2026-05-30days on market $154,900 Active 39 DOM
-
2026-04-21$154,900 Active 111-char remark
Show marketing remark (111 chars)
Property being sold as is . Please take a look at this great cape cod with lots of potential and modern kitchen
-
2025-09-24historical
-
2025-07-09price $208,999
-
2025-07-01price $219,000
-
2025-06-24$230,000 Active
-
2025-06-04historical
-
2025-04-08price $289,000
-
2025-02-25$299,999 Active
-
2019-04-08soldstatus $163,000
-
2019-03-22soldstatus $163,000 Closed
-
2019-01-25status Pending
-
2018-10-09$175,000 Active
-
2015-02-20historical
-
2015-02-20soldstatus $51,500 Sold
-
2015-02-20soldstatus $51,500
-
2014-12-29status Contingent (No Kick Out)
-
2014-12-29historical
-
2014-11-30$55,500 Active
-
2014-11-30$55,500
-
2007-08-28soldstatus $125,000
ⓘ Source: listings_history table (triggers on properties + properties_extension) + one-shot
backfill from property_details.listing_events for pre-trigger history.
Tax reassessment forecast MD · Partial reset (capped growth)
- Current annual tax
- $2,050 · $171/mo
- Projected year-2 tax
- $2,050 · $171/mo
- Expected delta
- $0/yr ($0/mo · 0.0%)
ⓘ Screening estimate from a state-policy table — verify with the county assessor before closing.
Climate risk First Street
- Flood 1/10 Low FEMA zone X (unshaded) · 0% chance over 30 yrs
- Wildfire 2/10 Low
- Heat 4/10 Moderate 7 d/yr ≥100°F today · 18 d/yr by 30 yrs out
- Wind 2/10 Low
- Air quality 2/10 Low 0 unhealthy d/yr today · 1 by 30 yrs out
Nearby sold comps map
Loading sold comps map…
Walkable amenities ~0.75 mi
Loading nearby amenities…
Taxation est. · year 1
- Rental income
- $19,357
- − Mortgage interest
- −$8,677
- − Property taxes
- −$2,050
- − Insurance
- −$774
- − Repairs & maintenance
- −$1,549
- − Management
- −$1,549
- − Depreciation
- −$4,506
- Taxable income
- $253
- Est. tax owed @ 24.0%
- −$61
- After-tax cash flow
- $2,659/yr
For passive investors: Depreciation is non-cash, so a rental often shows a tax loss while cash-flowing — sheltering income. Rental losses are passive: they offset passive income freely, and up to $25,000/yr can offset ordinary (W-2) income if you actively participate and your MAGI is under $100k (phasing out to $0 by $150k); unused losses carry forward. On sale, claimed depreciation is recaptured at up to 25%, and gains may owe capital-gains tax (a 1031 exchange can defer both). Figures are a year-1 estimate at your 24.0% rate — not tax advice; consult a CPA.
Schools (NCES district)
- District
- Allegany County Public Schools
- NCES district ID
- 2400030
- Math proficiency
- 15% ▼ -26.00%
- Reading proficiency
- 30% ▼ -20.00%
- Median HH income
- $39,760
- Composite
- 18.95/100
- National rank
- #8854
- State rank
- #18 of 24 in MD
Livability — La Vale
- Score
- 77/100
- State rank
- #82
- US rank
- #3161
Category grades
Schools grade is shown separately in the Schools card above.
Census & demographics
- Census place
- La Vale, MD
- County
- Allegany County · 41,015 people
- Metro
- Cumberland, MD-WV
- Population (ZIP)
- 41,015
- Household income
- $60,725
- Rent vs Own
- Severe rent burden
- 824.0
Population outlook (Allegany County) Hauer SSP2
- Today (2025)
- 68,778 people
- By 2030
- 66,766 · -2.9%
- By 2040
- 62,784 · -8.7%
- By 2050
- 59,179 · -14.0%
- By 2075
- 50,732 · -26.2%
- By 2100
- 40,837 · -40.6%
Race, ethnicity, and origin ACS 2023
- Neighborhood character
- Predominantly White (83%)
- Race & ethnicity
- White 83% Black 9% Two or more races 5% Hispanic / Latino 2%
- Common ancestry
- Slovak 3% Romanian 2% Italian 1%
- Foreign-born
- 2% · Canada
- Languages at home
- 96% English-only · Spanish 2%
Political lean MEDSL · Allegany
- 2024 margin
- Solid R (+40.3) · D 28.9% · R 69.2% · Other 2.0%
- 2008→2024 swing
- -14.4pp toward R · 2008: -25.9pp · 2024: -40.3pp
- All cycles
- 2024: R+40.3 2020: R+38.3 2016: R+48.0 2012: R+32.9 2008: R+25.9
Not yet ingested
- Civics
- —
Market trends
- HPI YoY
- ▼ -54.33%
- Current HPI
- 258.6676
- Rent YoY
- ▲ 10.88%
- Metro
- Cumberland, MD-WV
- State GDP YoY
- ▲ 2.97%
- F500 in state
- 12
Industry mix (Fortune 500 HQ in MD)
| Industry | F500 HQs | Revenue |
|---|---|---|
| Aerospace / Defense | 1 | $71B |
|
||
| Utilities | 1 | $25B |
|
||
| Hotels | 1 | $24B |
|
||
| Consumer Goods | 1 | $7B |
|
||
| Real Estate | 1 | $6B |
|
||
| Chemicals | 1 | $2B |
|
||
Price history
+23.9% since first listed20 events — show timeline
- 2026-04-21 Listed $154,900 BRIGHT MLS
- 2025-09-24 Listing Removed — BRIGHT MLS
- 2025-07-09 Price Changed $208,999 BRIGHT MLS
- 2025-07-01 Price Changed $219,000 BRIGHT MLS
- 2025-06-24 Listed $230,000 BRIGHT MLS
- 2025-06-04 Listing Removed — BRIGHT MLS
- 2025-04-08 Price Changed $289,000 BRIGHT MLS
- 2025-02-25 Listed $299,999 BRIGHT MLS
- 2019-04-08 Sold (Public Records) $163,000 Public Records
- 2019-03-22 Sold (MLS) $163,000 BRIGHT MLS
- 2019-01-25 Pending — BRIGHT MLS
- 2018-10-09 Listed $175,000 BRIGHT MLS
- 2015-02-20 Delisted — MRIS
- 2015-02-20 Sold (MLS) $51,500 BRIGHT MLS
- 2015-02-20 Sold (MLS) $51,500 MRIS
- 2014-12-29 Pending — MRIS
- 2014-12-29 Listing Removed — BRIGHT MLS
- 2014-11-30 Listed $55,500 MRIS
- 2014-11-30 Listed $55,500 BRIGHT MLS
- 2007-08-28 Sold (Public Records) $125,000 Public Records
Property tax history
+1.7%/yrLatest (2025): $2,050 · +9.1% YoY. Source: county tax records.
Cash-flow waterfall
monthlySold comps — $/sqft
last 12 mo · ≤1 miLoading sold comps…