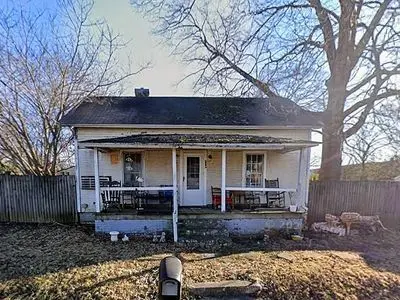
728 Durham St · Burlington, NC
Flood risk 1/10 · Minimal
- FEMA flood zone
- X (unshaded)
- Chance of flooding over 30 yrs
- 0.0%
- Est. flood insurance / yr
- $507 – $1,088
Fire risk 1/10 · Minimal
- Est. fire insurance / yr
- $906 – $1,684
Heat risk 6/10 · Moderate
- Hot days now (above 104°F)
- 7 days/yr
- Hot days in 30 yrs
- 18 days/yr
Wind risk 5/10 · Moderate
- Chance of severe wind over 30 yrs
- 22.0%
Air-quality risk 2/10 · Minimal
- Unhealthy air days now
- 2 days/yr
- Unhealthy air days in 30 yrs
- 2 days/yr
Risk factors via First Street. Map © Google.
Why this score? — see what drove the B- grade
The composite is a weighted blend of 9 inputs, each scored 0–100. Each bar is that input's sub-score; the figure is the points it added to the 100-point composite (weight × sub-score).
- Cash flow +30.0/30.0
- DSCR +10.0/10.0
- 1% rule +8.0/10.0
- ARV discount +7.5/15.0
- Livability +3.5/5.0
- Schools +3.0/10.0
- Rent growth +2.8/5.0
- Condition / age +2.5/5.0
- Appreciation +0.0/10.0
$99,000
🖨 Deal sheet 📄 Offer letter ✓ Due diligence
Listing remarks
Investor special with strong upside potential in a growing Burlington neighborhood. This 2-bedroom, 1-bath home offers approximately 960 square feet of living space and features a large attic that may provide opportunities for additional living space, subject to buyer verification and approvals. The property primarily needs exterior improvements, making it an attractive option for investors, renovators, or buyers looking to build equity. Whether you& apos; re seeking a rental property, renovation project, or affordable homeownership opportunity, this property offers flexibility and value at an accessible price point. Conveniently located near downtown Burlington, shopping, dining, schoo
Key facts
- 5,227 sq ft lot
- 50 parking spots
- Built 1950
Neighborhood map
What this means for you Summary
Snapshot
- This is a 2-bed/1.0-bath single-family listed at $99k.
Deal economics
- At list price, monthly cash flow is $413 ($5k/yr) — positive.
- The deal already cash-flows at list — no discount required.
- Meets the 1% rule at list price ($1k rent vs $99k).
- Cap rate 11.3% vs local median 3.6% in Burlington — top-decile yield for the area; either an underpriced asset or a hidden risk that comps aren't pricing in. Stress-test before assuming the spread holds.
Location & tenants
- Location reads 70/100 on livability (#123 in NC) — a middle-class / working-renter tenant base. Strengths: cost of living A+, housing A+, health & safety A+; Watch: commute D+, schools F, crime F.
- Alamance-Burlington Schools (rural): math 30% / reading 40% proficiency, ranked #133 of 178 in NC (top 75%) — families likely to look elsewhere, expect single-tenant / working-renter base with shorter leases.
- Market conditions: Rents rising (+1.1%/yr); 273 active listings in the ZIP; 27 comparable units currently listed for rent nearby; rentals at typical pace (median 21d on market — plan ~3-4 weeks tenant-placement turnaround); 2,466 units permitted in Alamance County in 2024 (403 in 5+ unit buildings).
Forward outlook
- Local home prices are declining (-3.0%/yr); year-one equity from $684 of loan paydown is wiped out by about $3k of value loss. Plan a longer hold.
- Alamance County population projected at +19% by 2050 — long-run rental-demand tailwind backs the buy-and-hold thesis.
- At projected returns (-3.0% appreciation + 1.1% rent growth), your $28k cash investment doubles in ~8 years — after that, you're playing with house money.
Negotiation context
- Only 8 days on market — expect competitive offers; lowballing is unlikely to land.
- Current owner paid $15k; list at $99k implies a 560% gain — meaningful room to come down on a strong offer.
Risks & watch-outs
- Watch-outs: built in 1950 — expect roof / HVAC / electrical / plumbing capex.
- Climate carrying-cost: moderate wind risk, 22% chance of damaging wind over 30y; extreme-heat days projected 7→18/yr by 2055 (HVAC capex compounding) — expect insurance premiums to compound above CPI over the hold.
Questions for the listing agent
- Built in 1950 — when were the roof, HVAC, electrical panel, plumbing, and water heater last replaced?
- Is there a deadline driving the sale (1031 exchange, divorce, estate, relocation)? That informs how much negotiation room exists.
- Schools are F-rated, which usually means shorter tenancies and higher turnover. Who's the typical renter profile here, and what's been the actual vacancy rate?
- Crime grade is F in this area — have there been break-ins, vandalism, or insurance claims at this property in the last 3 years? What carrier currently insures it and at what premium?
- What's the average days-on-market for RENTAL listings here right now (not sales)? A rising rental-DOM trend means longer vacancies and softer asking-rent achievability than the comps imply.
- What's the recent tenant-quality profile in this submarket — average credit score on applications, eviction rate, late-payment / NSF rate, and stable-employment percentage? A property-management company in the area should have these aggregated.
- How much new for-sale + rental construction is in the pipeline within 1–3 miles? Heavy new supply typically softens prices + rents 12–24 months out; constrained supply supports both.
Investment metrics
- 1% rule
- 1.30% ✓
- Cap rate
- 11.30%
- Cash-on-cash
- 17.88%
- DSCR
- 1.80
- GRM
- 6.4
CMA / ARV
- ARV (on-the-fly)
- $202,560
- Comps found
- 12
Show comp detail 12 sales within ~0.75 mi
| Address | Dist | Beds/Ba | Sqft | Sold | Price | $/sf | Match |
|---|---|---|---|---|---|---|---|
| 230 Hall Ave | 0.43mi | 2/1.0 | 919 (-4%) | 3mo | $68,000 | $74 | 70 |
| 525 Lakeside Ave | 0.31mi | 2/1.0 | 861 (-10%) | 3mo | $85,000 | $99 | 66 |
| 318 Lakeside Ave | 0.31mi | 2/1.0 | 831 (-13%) | 2mo | $175,000 | $211 | 62 |
| 1112 W Webb Ave | 0.41mi | 3/1.0 (+1) | 1,036 (+8%) | 2mo | $185,000 | $179 | 61 |
| 1412 Tarleton Ave | 0.62mi | 3/1.0 (+1) | 906 (-6%) | 2mo | $205,000 | $226 | 55 |
| 1204 Wallace St | 0.65mi | 2/1.0 | 900 (-6%) | 6mo | $180,000 | $200 | 55 |
| 913 Gorrel St | 0.39mi | 2/2.0 | 1,064 (+11%) | 6mo | $155,000 | $146 | 55 |
| 1322 Elm St | 0.50mi | 3/1.5 (+1) | 865 (-10%) | 1mo | $205,000 | $237 | 52 |
| 424 Jeffries St | 0.66mi | 3/1.5 (+1) | 916 (-5%) | 3mo | $175,000 | $191 | 52 |
| 444 Jeffries St | 0.66mi | 3/1.5 (+1) | 908 (-5%) | 2mo | $195,000 | $215 | 52 |
| 1414 Tarleton Ave | 0.61mi | 2/1.0 | 819 (-15%) | 1mo | $186,500 | $228 | 46 |
| 602 Mitchell St | 0.64mi | 2/1.0 | 817 (-15%) | 1mo | $183,000 | $224 | 44 |
Match score weights: distance 35% · size 25% · config 20% · recency 20%. Top-matched comps best support the ARV.
Projected returns pro-forma
-3.0% appreciation · 1.06% rent growth · sell at horizon
- IRR
- 7.3%
- Equity multiple
- 1.28×
- Total profit
- $7,769
- Equity at exit
- $14,761
- IRR
- 15.0%
- Equity multiple
- 2.11×
- Total profit
- $30,801
- Equity at exit
- $8,560
Cash invested: $27,720 (down + closing). Projections, not guarantees.
Landlord ↔ Tenant lean methodology
- Overall (STATE)
- 85 Strongly Landlord-Friendly
- State North Carolina
- 85 Strongly Landlord-Friendly · R+3
- County
- — inherits STATE
- City
- — inherits STATE
ZIP-level market 27217
- Home prices YoY
- -22.3%
- Rents YoY
- 1.1%
- Active inventory
- 273
- Price-to-rent
- 6.4×
Monthly cashflow live
- Estimated rent
- $1,284 high interval (Pro) →
- Mortgage (P&I)
- −$519
- Tax from tax record
- −$41 /mo · $489/yr
- Insurance
- −$41
- HOA
- −$0
- Vacancy / Maint / Mgmt
- −$270
- Net cashflow
- $413
Break-even live
UW: 25.0% down · 7.5% · 30yr · 1.5% tax · 5.0% vac · 8.0% maint · 8.0% mgmt
Financing live
Cash to close
- Down payment
- $24,750
- Closing costs
- $2,970
- Reserves months
- —
- Total cash needed
- —
Loan-product check · same deal, 3 products live
Conventional
25% down · 7.5% · 30yr
- Down + closing
- —
- Monthly P&I
- —
- Monthly cashflow
- —
- DSCR
- —
- Eligible?
- —
Personal DTI + credit; lowest rate.
DSCR
20% down · 8.5% · 30yr
- Down + closing
- —
- Monthly P&I
- —
- Monthly cashflow
- —
- DSCR
- —
- Eligible?
- —
No personal income docs; deal must DSCR.
Hard money
10% down · 12.0% · 12mo
- Down + closing
- —
- Monthly P&I
- —
- Monthly cashflow
- —
- DSCR
- —
- Eligible?
- —
Short-term bridge; refi at stabilization.
Rent comps 27 comps
| Address | Beds | Baths | Sqft | Rent | $/sqft | DOM | Units | Dist |
|---|---|---|---|---|---|---|---|---|
| 1013 Attica St Burlington, NC | 2.0 | 1.0 | 855 | $1,245 | $1.46 | 13d | 1 | 0.26mi |
| 525 Lakeside Ave Burlington, NC | 3.0 | 1.0 | 975 | $1,300 | $1.33 | 21d | 1 | 0.29mi |
| 654 Lakeside Ave Unit 654 Burlington, NC | 2.0 | 1.0 | 830 | $1,125 | $1.36 | 13d | 1 | 0.32mi |
| 1000 Camden St Burlington, NC | 2.0 | 1.0 | 600 | $1,095 | $1.82 | 13d | 1 | 0.49mi |
| 1322 Elm St Burlington, NC | 3.0 | 1.5 | 848 | $1,550 | $1.83 | 13d | 1 | 0.51mi |
| 1128 Ava St Burlington, NC | 2.0 | 1.0 | 900 | $1,200 | $1.33 | 13d | 1 | 0.52mi |
| 1331 Elm St Burlington, NC | 3.0 | 1.0 | 950 | $1,475 | $1.55 | 21d | 1 | 0.58mi |
| 317 Caswell St Unit 2 Burlington, NC | 1.0 | 1.0 | 650 | $750 | $1.15 | 21d | 1 | 0.59mi |
| 511 W Davis St Burlington, NC | 2.0 | 2.0 | 840 | $2,395 | $2.85 | 21d | 1 | 0.62mi |
| 306 N Ireland St Unit 306 Burlington, NC | 2.0 | 1.0 | 807 | $1,250 | $1.55 | 21d | 1 | 0.79mi |
| 1615 Cadiz St Burlington, NC | 2.0 | 1.0 | 1100 | $1,200 | $1.09 | 21d | 1 | 0.81mi |
| 939-941 S Church St Unit 939 Burlington, NC | 1.0 | 1.0 | 583 | $995 | $1.71 | 21d | 1 | 0.95mi |
| 607 N Main St Unit 609 Burlington, NC | 1.0 | 1.0 | 568 | $850 | $1.50 | 21d | 1 | 1.01mi |
| 1515 Woodland Ave Burlington, NC | 3.0 | 2.0 | 1101 | $1,500 | $1.36 | 13d | 1 | 1.04mi |
| 824 Chandler Ave Burlington, NC | 2.0 | 1.0 | 750 | $1,275 | $1.70 | 13d | 1 | 1.08mi |
| 131 Carolina Ave Burlington, NC | 2.0 | 1.0 | 900 | $1,295 | $1.44 | 21d | 1 | 1.10mi |
| 321 E 5th St Burlington, NC | 1.0 | 1.0 | 700 | $850 | $1.21 | 21d | 1 | 1.17mi |
| 910 N Main St Unit A Burlington, NC | 2.0 | 2.0 | 1100 | $1,395 | $1.27 | 13d | 1 | 1.18mi |
| 805 S Broad St Burlington, NC | 2.0 | 1.0 | 779 | $1,100 | $1.41 | 21d | 1 | 1.18mi |
| 102-A/B W Summit Ave Unit B Burlington, NC | 1.0 | 1.0 | 750 | $895 | $1.19 | 13d | 1 | 1.22mi |
| 516 Maple Ave Unit B Burlington, NC | 1.0 | 1.0 | 869 | $850 | $0.98 | 21d | 1 | 1.29mi |
| 109 Craig St Unit 109-F Burlington, NC | 2.0 | 1.0 | 750 | $1,095 | $1.46 | 13d | 1 | 1.31mi |
| 1016 Washington St Unit A Burlington, NC | 1.0 | 1.0 | 650 | $775 | $1.19 | 21d | 1 | 1.33mi |
| 916 Harris St Burlington, NC | 1.0 | 1.0 | 601 | $895 | $1.49 | 21d | 1 | 1.36mi |
| 411 S Saint John St Burlington, NC | 1.0 | 1.0 | 700 | $1,100 | $1.57 | 21d | 1 | 1.38mi |
| 1016 Grace Ave Burlington, NC | 3.0 | 1.0 | 994 | $1,245 | $1.25 | 21d | 1 | 1.40mi |
| 1055 Baldwin Ridge Rd Burlington, NC | 1.0–3.0 | 1.0–2.0 | 1025 | $1,512 | $1.48 | 13d | 19 | 1.47mi |
Listing history 12 events
-
2026-06-19days on market $99,000 Active 8 DOM
-
2026-06-18days on market $99,000 Active 7 DOM
-
2026-06-17days on market $99,000 Active 6 DOM
-
2026-06-16days on market $99,000 Active 5 DOM
-
2026-06-15days on market $99,000 Active 4 DOM
-
2026-06-14days on market $99,000 Active 2 DOM
-
2026-06-13pricedays on market $99,000 Active 1 DOM
-
2026-06-10days on market $75,000 Active 4 DOM
-
2026-06-09days on market $75,000 Active 3 DOM
-
2026-06-08days on market $75,000 Active 2 DOM
-
2026-06-07remarks 695-char remark
-
2026-06-07$75,000 Active 1 DOM
ⓘ Source: listings_history table (triggers on properties + properties_extension) + one-shot
backfill from property_details.listing_events for pre-trigger history.
Tax reassessment forecast NC · Resets to sale price
- Current annual tax
- $489 · $41/mo
- Projected year-2 tax
- $812 · $68/mo
- Expected delta
- +$323/yr (+$27/mo · 66.1%)
ⓘ Screening estimate from a state-policy table — verify with the county assessor before closing.
Climate risk First Street
- Flood 1/10 Low FEMA zone X (unshaded) · 0% chance over 30 yrs
- Wildfire 1/10 Low
- Heat 6/10 Major 7 d/yr ≥104°F today · 18 d/yr by 30 yrs out
- Wind 5/10 Major 22% chance of damaging wind over 30 yrs
- Air quality 2/10 Low 2 unhealthy d/yr today · 2 by 30 yrs out
Nearby sold comps map
Loading sold comps map…
Walkable amenities ~0.75 mi
Loading nearby amenities…
Taxation est. · year 1
- Rental income
- $15,404
- − Mortgage interest
- −$5,546
- − Property taxes
- −$489
- − Insurance
- −$495
- − Repairs & maintenance
- −$1,232
- − Management
- −$1,232
- − Depreciation
- −$2,880
- Taxable income
- $3,530
- Est. tax owed @ 24.0%
- −$847
- After-tax cash flow
- $4,108/yr
For passive investors: Depreciation is non-cash, so a rental often shows a tax loss while cash-flowing — sheltering income. Rental losses are passive: they offset passive income freely, and up to $25,000/yr can offset ordinary (W-2) income if you actively participate and your MAGI is under $100k (phasing out to $0 by $150k); unused losses carry forward. On sale, claimed depreciation is recaptured at up to 25%, and gains may owe capital-gains tax (a 1031 exchange can defer both). Figures are a year-1 estimate at your 24.0% rate — not tax advice; consult a CPA.
Schools (NCES district)
- District
- Alamance-Burlington Schools
- NCES district ID
- 3700030
- Math proficiency
- 30% ▼ -6.00%
- Reading proficiency
- 40% ▲ 2.00%
- Median HH income
- $43,359
- Composite
- 29.68/100
- National rank
- #6460
- State rank
- #133 of 178 in NC
Livability — Burlington
- Score
- 70/100
- State rank
- #123
- US rank
- #7396
Category grades
Schools grade is shown separately in the Schools card above.
Census & demographics
- Census place
- Burlington, NC
- County
- Alamance County · 173,369 people
- City population
- 88,508
- Metro
- Burlington, NC
- Population (ZIP)
- 41,406
- Household income
- $51,950
- Rent vs Own
- Severe rent burden
- 1040.0
Population outlook (Alamance County) Hauer SSP2
- Today (2025)
- 173,381 people
- By 2030
- 180,609 · +4.2%
- By 2040
- 194,327 · +12.1%
- By 2050
- 206,158 · +18.9%
- By 2075
- 235,665 · +35.9%
- By 2100
- 258,626 · +49.2%
Race, ethnicity, and origin ACS 2023
- Neighborhood character
- Diverse neighborhood (Simpson 0.69)
- Race & ethnicity
- White 38% Black 29% Hispanic / Latino 29% Two or more races 7% Native American 1%
- Hispanic origin (detail)
- Mexican 19% Puerto Rican 1%
- Common ancestry
- Serbian 2% Italian 1% Slovak 1%
- Foreign-born
- 13% · Canada
- Languages at home
- 75% English-only · Spanish 24%
Political lean MEDSL · Alamance
- 2024 margin
- Lean R (+8.2) · D 45.4% · R 53.5% · Other 1.1%
- 2008→2024 swing
- +1.1pp toward D · 2008: -9.2pp · 2024: -8.2pp
- All cycles
- 2024: R+8.2 2020: R+8.4 2016: R+12.9 2012: R+14.1 2008: R+9.2
Not yet ingested
- Civics
- —
Market trends
- HPI YoY
- ▼ -74.45%
- Current HPI
- 259.8107
- Rent YoY
- ▲ 1.06%
- Metro
- Burlington, NC
- State GDP YoY
- ▲ 3.28%
- F500 in state
- 26
Industry mix (Fortune 500 HQ in NC)
| Industry | F500 HQs | Revenue |
|---|---|---|
| Financial Services | 2 | $213B |
|
||
| Retail | 2 | $95B |
|
||
| Industrial Conglomerate | 1 | $38B |
|
||
| Metals / Steel | 1 | $35B |
|
||
| Utilities | 1 | $30B |
|
||
| Industrial Machinery | 1 | $19B |
|
||
Price history
+212.5% since first listed3 events — show timeline
- 2026-06-07 Listed $75,000 FSBO.com
- 2012-12-14 Sold (Public Records) $15,000 Public Records
- 1987-10-09 Sold (Public Records) $24,000 Public Records
Property tax history
+12.6%/yrLatest (2025): $489 · +102.2% YoY. Source: county tax records.
Cash-flow waterfall
monthlySold comps — $/sqft
last 12 mo · ≤1 miLoading sold comps…