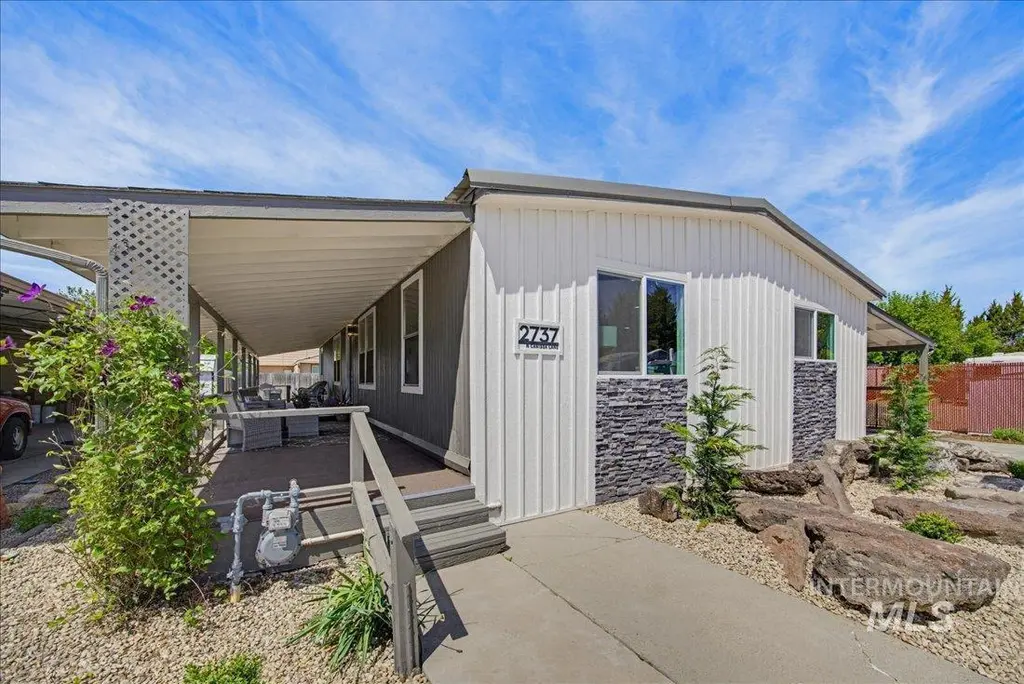
2737 N Carissa Ln · Boise City, ID
Flood risk 1/10 · Minimal
- FEMA flood zone
- X (unshaded)
- Chance of flooding over 30 yrs
- 0.0%
- Est. flood insurance / yr
- $507 – $1,088
Fire risk 1/10 · Minimal
- Est. fire insurance / yr
- $584 – $1,086
Heat risk 4/10 · Minor
- Hot days now (above 96°F)
- 7 days/yr
- Hot days in 30 yrs
- 17 days/yr
Wind risk 1/10 · Minimal
- Chance of severe wind over 30 yrs
- —
Air-quality risk 8/10 · Major
- Unhealthy air days now
- 14 days/yr
- Unhealthy air days in 30 yrs
- 19 days/yr
Risk factors via First Street. Map © Google.
Why this score? — see what drove the C grade
The composite is a weighted blend of 9 inputs, each scored 0–100. Each bar is that input's sub-score; the figure is the points it added to the 100-point composite (weight × sub-score).
- Cash flow +24.3/30.0
- DSCR +7.8/10.0
- 1% rule +6.3/10.0
- Schools +5.2/10.0
- ARV discount +4.5/15.0
- Condition / age +4.2/5.0
- Rent growth +3.0/5.0
- Livability +2.5/5.0
- Appreciation +0.0/10.0
$169,000
🖨 Deal sheet 📄 Offer letter ✓ Due diligence
Listing remarks
Beautifully updated manufactured home in a centrally located 55+ community in Boise! This expansive home offers a functional layout with abundant natural light and modern finishes throughout. Enjoy the convenience of a large carport and a versatile 12x10 shop. Perfect for hobbies, storage, or workspace needs. Step inside to find new cabinets, quartz countertops, and brand-new appliances that elevate the kitchen. Durable LVP flooring flows through the main living areas, complemented by updated light fixtures for a fresh, contemporary feel. The spacious living and dining areas create an inviting atmosphere for relaxing or entertaining. Outdoor living is just as appealing with a large covered
Key facts
- 2 parking spots
- Built 1978
- Listed 41 days
Property features AI
Finance
- HOA & community: Located in an over‑55 community
Exterior
- Parking: 2 covered spaces in a 2-car carport
- Utilities: City water service; Sewer connected; Electricity connected; Paved road access
- Home design: Mobile/manufactured home on a rented lot; Located in an over‑55 community; Situated in a mobile home park
- Construction: Masonry construction; Metal roof; Built in 1978
- Exterior features: Partial fencing; Auto, drip and full sprinkler systems
Interior
- Kitchen: Dishwasher; Microwave; Electric water heater
- Bedrooms: 3 bedrooms, all on the main level
- Flooring: Carpet flooring
- Bathrooms: 2 bathrooms
- Heating & cooling: Electric forced-air heating; Central air conditioning; Fireplace
- Interior features: Primary bedroom with en-suite bath; Kitchen island; Quartz countertops
Neighborhood map
What this means for you Summary
Snapshot
- This is a 3-bed/2.0-bath manufactured listed at $169k. Condition is rated good.
Deal economics
- At list price, monthly cash flow is $339 ($4k/yr) — positive.
- The deal already cash-flows at list — no discount required.
- Meets the 1% rule at list price ($2k rent vs $169k).
- Recommended offer: $164k (3.0% below list) — sets the bar for market timing.
- Cap rate 8.7% vs local median 2.6% in Boise City — top-decile yield for the area; either an underpriced asset or a hidden risk that comps aren't pricing in. Stress-test before assuming the spread holds.
Location & tenants
- Location reads: area grade C — affects rentability + tenant quality, not the cash-flow math above.
- Joint School District No. 2 (suburban): math 53% / reading 67% proficiency, ranked #11 of 92 in ID (top 12%) — acceptable for families but not a draw, mixed tenant base, ~2y average lease.
- Zoned schools: Ustick Elementary School (math 32% / reading 37%, grade F, #272 of 357 statewide, top 80%, 357 students, 60% FRL); Centennial High School (math 53% / reading 76%, grade B-, #10 of 169 statewide, top 7%, 1,931 students, 22% FRL) — zoned schools average 41% FRL vs 23% district-wide (18 pts higher); higher-poverty schools than district average — tighter screening recommended.
- Market conditions: Rents rising (+1.9%/yr); 193 active listings in the ZIP; 15 comparable units currently listed for rent nearby; rentals at typical pace (median 14d on market — plan ~3-4 weeks tenant-placement turnaround); 5,129 units permitted in Ada County in 2024 (414 in 5+ unit buildings).
- This rent runs 31% of the median local income ($73k/yr) — at the standard rent-burdened threshold; future hikes will face affordability resistance.
Forward outlook
- Local home prices are declining (-3.0%/yr); year-one equity from $1k of loan paydown is wiped out by about $5k of value loss. Plan a longer hold.
- Ada County population projected at +45% by 2050 — long-run rental-demand tailwind backs the buy-and-hold thesis.
Negotiation context
- It's been on market 41 days — a 3% lower offer ($164k) is reasonable based on typical stale-listing flexibility.
Questions for the listing agent
- It's been on market 41 days. Have you received any prior offers? Is the seller open to a 3% concession, seller financing, or rate buy-down credit?
- Built in 1978 — when were the roof, HVAC, electrical panel, plumbing, and water heater last replaced?
- Is there a deadline driving the sale (1031 exchange, divorce, estate, relocation)? That informs how much negotiation room exists.
- What's the average days-on-market for RENTAL listings here right now (not sales)? A rising rental-DOM trend means longer vacancies and softer asking-rent achievability than the comps imply.
- What's the recent tenant-quality profile in this submarket — average credit score on applications, eviction rate, late-payment / NSF rate, and stable-employment percentage? A property-management company in the area should have these aggregated.
- How much new for-sale + rental construction is in the pipeline within 1–3 miles? Heavy new supply typically softens prices + rents 12–24 months out; constrained supply supports both.
Investment metrics
- 1% rule
- 1.13% ✓
- Cap rate
- 8.70%
- Cash-on-cash
- 8.60%
- DSCR
- 1.38
- GRM
- 7.4
CMA / ARV
- ARV (on-the-fly)
- $158,368
- Comps found
- 12
Show comp detail 12 sales within ~0.75 mi
| Address | Dist | Beds/Ba | Sqft | Sold | Price | $/sf | Match |
|---|---|---|---|---|---|---|---|
| 2711 N Pilgrim Ln | 0.22mi | 3/2.0 | 1,680 (+7%) | 4mo | $99,900 | $59 | 74 |
| 2392 N Patricia Ln | 0.46mi | 2/2.0 (-1) | 1,568 (0%) | 2mo | $129,999 | $83 | 72 |
| 10623 W Macaw Ln | 0.45mi | 3/2.0 | 1,512 (-4%) | 6mo | $125,000 | $83 | 68 |
| 10642 Abram Ln | 0.49mi | 3/2.0 | 1,512 (-4%) | 9mo | $99,000 | $65 | 63 |
| 2223 N Iris Ln | 0.46mi | 3/2.0 | 1,664 (+6%) | 7mo | $168,000 | $101 | 62 |
| 2485 N Bali Dr | 0.65mi | 3/2.0 | 1,650 (+5%) | 0mo | $225,000 | $136 | 61 |
| 3467 N Dalton Ln | 0.64mi | 3/2.0 | 1,456 (-7%) | 2mo | $145,000 | $100 | 56 |
| 9390 W Ustick Rd #58 | 0.58mi | 2/2.0 (-1) | 1,482 (-6%) | 6mo | $259,990 | $175 | 54 |
| 9390 W Ustick Rd Trlr 26 | 0.58mi | 3/2.0 | 1,344 (-14%) | 2mo | $189,000 | $141 | 48 |
| 9390 W Ustick #65 | 0.61mi | 2/2.0 (-1) | 1,746 (+11%) | 2mo | $224,900 | $129 | 46 |
| 10894 Tahiti | 0.61mi | 2/2.0 (-1) | 1,344 (-14%) | 1mo | $179,000 | $133 | 42 |
| 3468 N Dalton Ln | 0.66mi | 4/2.0 (+1) | 1,782 (+14%) | 10mo | $175,000 | $98 | 33 |
Match score weights: distance 35% · size 25% · config 20% · recency 20%. Top-matched comps best support the ARV.
Projected returns pro-forma
-3.0% appreciation · 1.95% rent growth · sell at horizon
- IRR
- -4.4%
- Equity multiple
- 0.84×
- Total profit
- $-7,757
- Equity at exit
- $25,198
- IRR
- 4.0%
- Equity multiple
- 1.28×
- Total profit
- $13,156
- Equity at exit
- $14,612
Cash invested: $47,320 (down + closing). Projections, not guarantees.
Landlord ↔ Tenant lean methodology
- Overall (STATE)
- 91 Strongly Landlord-Friendly
- State Idaho
- 91 Strongly Landlord-Friendly · R+18
- County
- — inherits STATE
- City
- — inherits STATE
ZIP-level market 83704
- Rents YoY
- 1.9%
- Active inventory
- 193
- Price-to-rent
- 7.4×
Monthly cashflow live
- Estimated rent
- $1,908 high interval (Pro) →
- Mortgage (P&I)
- −$886
- Tax est. 1.5%
- −$211 /mo · $2,535/yr
- Insurance
- −$70
- HOA
- −$0
- Vacancy / Maint / Mgmt
- −$401
- Net cashflow
- $339
Break-even live
UW: 25.0% down · 7.5% · 30yr · 1.5% tax · 5.0% vac · 8.0% maint · 8.0% mgmt
Financing live
Cash to close
- Down payment
- $42,250
- Closing costs
- $5,070
- Reserves months
- —
- Total cash needed
- —
Loan-product check · same deal, 3 products live
Conventional
25% down · 7.5% · 30yr
- Down + closing
- —
- Monthly P&I
- —
- Monthly cashflow
- —
- DSCR
- —
- Eligible?
- —
Personal DTI + credit; lowest rate.
DSCR
20% down · 8.5% · 30yr
- Down + closing
- —
- Monthly P&I
- —
- Monthly cashflow
- —
- DSCR
- —
- Eligible?
- —
No personal income docs; deal must DSCR.
Hard money
10% down · 12.0% · 12mo
- Down + closing
- —
- Monthly P&I
- —
- Monthly cashflow
- —
- DSCR
- —
- Eligible?
- —
Short-term bridge; refi at stabilization.
Rent comps 15 comps
| Address | Beds | Baths | Sqft | Rent | $/sqft | DOM | Units | Dist |
|---|---|---|---|---|---|---|---|---|
| 10096 W Garverdale Ln Boise, ID | 3.0 | 2.0 | 1113 | $1,600 | $1.44 | 23d | 1 | 0.61mi |
| 3325 N Covered Wagon Way Boise, ID | 3.0 | 2.0 | 1200 | $2,050 | $1.71 | 23d | 1 | 0.73mi |
| 9846 W Rosecroft Ct #102 Boise, ID | 2.0 | 2.5 | 1236 | $1,545 | $1.25 | 3d | 1 | 0.80mi |
| 11274 W Race St Boise, ID | 3.0 | 2.5 | 1744 | $2,150 | $1.23 | 14d | 1 | 0.80mi |
| 9993 W Rosecroft Ct #101 Boise, ID | 2.0 | 2.5 | 1136 | $1,575 | $1.39 | 3d | 1 | 0.84mi |
| 11383 W Fairview Ave Boise, ID | 2.0 | 2.0 | 1123 | $1,575 | $1.40 | 2d | 4 | 1.13mi |
| 10764 W Goldenrod Ave Boise, ID | 3.0 | 2.0 | 1220 | $1,895 | $1.55 | 19d | 1 | 1.13mi |
| 11239 W Gabrielle Dr Boise, ID | 2.0 | 2.5 | 1128 | $1,645 | $1.46 | 23d | 1 | 1.16mi |
| 9952 W Pattie Dr Boise, ID | 3.0 | 3.0 | 1900 | $2,250 | $1.18 | 2d | 1 | 1.17mi |
| 8973 W Irving St Bldg 6 Boise, ID | 3.0 | 2.5 | 1524 | $2,250 | $1.48 | 14d | 1 | 1.18mi |
| 4418 N Oxbow Pl Boise, ID | 3.0 | 2.0 | 1120 | $2,095 | $1.87 | 14d | 1 | 1.25mi |
| 11703 W Ginger Creek Dr Boise, ID | 3.0 | 2.0 | 1366 | $2,000 | $1.46 | 2d | 1 | 1.27mi |
| 930 N Maple Grove Rd Boise, ID | 1.0–3.0 | 1.0–2.0 | 950 | $2,333 | $2.46 | 2d | 14 | 1.30mi |
| 2663 N Fastwater Ave Boise, ID | 3.0 | 2.0 | 1204 | $1,795 | $1.49 | 14d | 1 | 1.36mi |
| 4107 N Vera St Boise, ID | 4.0 | 2.0 | 1344 | $1,895 | $1.41 | 23d | 1 | 1.39mi |
Listing history 14 events
-
2026-06-18days on market $169,000 Active 41 DOM
-
2026-06-17days on market $169,000 Active 40 DOM
-
2026-06-16days on market $169,000 Active 39 DOM
-
2026-06-15pricedays on market $169,000 Active 38 DOM
-
2026-06-13days on market $179,000 Active 36 DOM
-
2026-06-10days on market $179,000 Active 33 DOM
-
2026-06-09days on market $179,000 Active 32 DOM
-
2026-06-08days on market $179,000 Active 31 DOM
-
2026-06-07days on market $179,000 Active 30 DOM
-
2026-06-03days on market $179,000 Active 26 DOM
-
2026-06-03days on market $179,000 Active 25 DOM
-
2026-06-01days on market $179,000 Active 24 DOM
-
2026-05-31days on market $179,000 Active 23 DOM
-
2026-05-08$179,000 Active
ⓘ Source: listings_history table (triggers on properties + properties_extension) + one-shot
backfill from property_details.listing_events for pre-trigger history.
Climate risk First Street
- Flood 1/10 Low FEMA zone X (unshaded) · 0% chance over 30 yrs
- Wildfire 1/10 Low
- Heat 4/10 Moderate 7 d/yr ≥96°F today · 17 d/yr by 30 yrs out
- Wind 1/10 Low
- Air quality 8/10 Severe 14 unhealthy d/yr today · 19 by 30 yrs out
Nearby sold comps map
Loading sold comps map…
Walkable amenities ~0.75 mi
Loading nearby amenities…
Taxation est. · year 1
- Rental income
- $22,891
- − Mortgage interest
- −$9,467
- − Property taxes
- −$2,535
- − Insurance
- −$845
- − Repairs & maintenance
- −$1,831
- − Management
- −$1,831
- − Depreciation
- −$4,916
- Taxable income
- $1,465
- Est. tax owed @ 24.0%
- −$352
- After-tax cash flow
- $3,717/yr
For passive investors: Depreciation is non-cash, so a rental often shows a tax loss while cash-flowing — sheltering income. Rental losses are passive: they offset passive income freely, and up to $25,000/yr can offset ordinary (W-2) income if you actively participate and your MAGI is under $100k (phasing out to $0 by $150k); unused losses carry forward. On sale, claimed depreciation is recaptured at up to 25%, and gains may owe capital-gains tax (a 1031 exchange can defer both). Figures are a year-1 estimate at your 24.0% rate — not tax advice; consult a CPA.
Condition & rehab AI · 12 photos
This beautifully updated manufactured home in a centrally located 55+ community is move-in ready with good condition and minimal repairs needed.
Value-add opportunities
- Both landscaping — enhances curb appeal and outdoor living space
- Both exterior paint — fresh paint can improve home's appearance and value
- Both interior paint — fresh paint can improve home's appearance and value
Renovation cost estimate screening
Value-add ROI direction
- Both landscaping — enhances curb appeal and outdoor living space ↑
- Both exterior paint — fresh paint can improve home's appearance and value ↑
- Both interior paint — fresh paint can improve home's appearance and value ↑
ⓘ Cost ranges are severity-bucket heuristics (US national rule-of-thumb). Get contractor quotes + a written scope before underwriting a rehab budget.
Schools (NCES district)
- District
- Joint School District No. 2
- NCES district ID
- 1602100
- Math proficiency
- 53% ▼ -6.00%
- Reading proficiency
- 67% ▼ -1.00%
- Median HH income
- $64,573
- Composite
- 52.42/100
- National rank
- #1576
- State rank
- #11 of 92 in ID
Livability — Boise City
No livability data for this city. (Only ~50 U.S. cities are tracked.)
Census & demographics
- Census place
- Boise City, ID
- County
- Ada County · 522,161 people
- City population
- 152,689
- Metro
- Boise City, ID
- Population (ZIP)
- 42,719
- Household income
- $73,390
- Rent vs Own
- Severe rent burden
- 1415.0
Population outlook (Ada County) Hauer SSP2
- Today (2025)
- 535,818 people
- By 2030
- 585,751 · +9.3%
- By 2040
- 682,435 · +27.4%
- By 2050
- 775,818 · +44.8%
- By 2075
- 994,458 · +85.6%
- By 2100
- 1,148,884 · +114.4%
Race, ethnicity, and origin ACS 2023
- Neighborhood character
- Predominantly White (77%)
- Race & ethnicity
- White 77% Hispanic / Latino 14% Two or more races 9% Asian 2% Native American 2% Black 1%
- Hispanic origin (detail)
- Mexican 10%
- Common ancestry
- Italian 4% Portuguese 3% Slovak 2%
- Foreign-born
- 8% · Canada
- Languages at home
- 87% English-only · Spanish 8% Russian/Polish/Slavic 1% Other Indo-European 1%
Political lean MEDSL · Ada
- 2024 margin
- R (+10.3) · D 43.4% · R 53.8% · Other 2.8%
- 2008→2024 swing
- -4.2pp toward R · 2008: -6.2pp · 2024: -10.3pp
- All cycles
- 2024: R+10.3 2020: R+3.9 2016: R+9.2 2012: R+11.3 2008: R+6.2
Not yet ingested
- Civics
- —
Market trends
- HPI YoY
- ▼ -393.15%
- Current HPI
- 379.0934
- Rent YoY
- ▲ 1.95%
- Metro
- Boise City, ID
- State GDP YoY
- ▲ 4.51%
- F500 in state
- 6
Industry mix (Fortune 500 HQ in ID)
| Industry | F500 HQs | Revenue |
|---|---|---|
| Retail | 1 | $79B |
|
||
| Technology | 1 | $25B |
|
||
| Food / Agriculture | 1 | $6B |
|
||
Price history
1 event — show timeline
- 2026-05-08 Listed $179,000 IMLS
Cash-flow waterfall
monthlySold comps — $/sqft
last 12 mo · ≤1 miLoading sold comps…