510 Elmont St · Abilene, TX
Flood risk 1/10 · Minimal
- FEMA flood zone
- X (unshaded)
- Chance of flooding over 30 yrs
- 0.0%
- Est. flood insurance / yr
- $507 – $1,088
Fire risk 4/10 · Minor
- Est. fire insurance / yr
- $1,222 – $2,270
Heat risk 7/10 · Major
- Hot days now (above 104°F)
- 7 days/yr
- Hot days in 30 yrs
- 25 days/yr
Wind risk 4/10 · Minor
- Chance of severe wind over 30 yrs
- 19.0%
Air-quality risk 1/10 · Minimal
- Unhealthy air days now
- 0 days/yr
- Unhealthy air days in 30 yrs
- 0 days/yr
Risk factors via First Street. Map © Google.
Why this score? — see what drove the C- grade
The composite is a weighted blend of 9 inputs, each scored 0–100. Each bar is that input's sub-score; the figure is the points it added to the 100-point composite (weight × sub-score).
- Cash flow +17.9/30.0
- ARV discount +7.1/15.0
- DSCR +5.6/10.0
- Rent growth +5.0/5.0
- 1% rule +4.8/10.0
- Condition / age +4.0/5.0
- Livability +3.8/5.0
- Schools +2.8/10.0
- Appreciation +0.0/10.0
$274,990
🖨 Deal sheet (PDF) 📄 Offer letter ✓ Due diligence
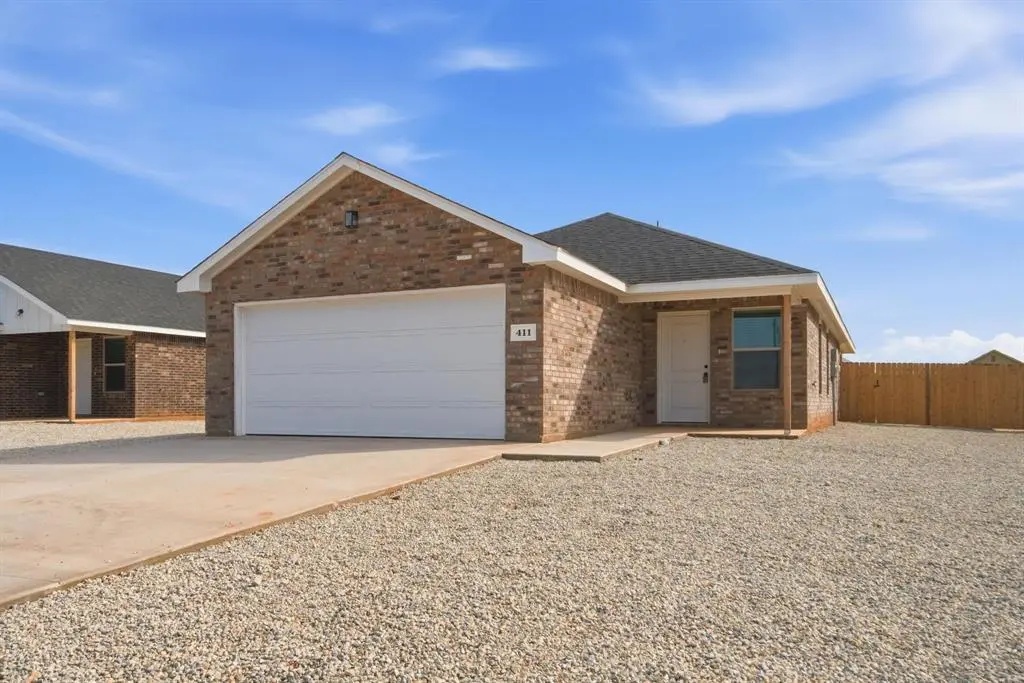
Listing remarks
New construction investment opportunity in a rapidly growing area of Abilene. This 1,337 sq ft property features 3 bedrooms, 2 full bathrooms, and a 2-car garage with a modern, open-concept layout designed for strong resident appeal and low-maintenance ownership. Built new and never occupied, the home offers the advantage of minimal near-term maintenance and strong rental demand from nearby employers and institutions. Ideally located less than 10 minutes from the upcoming Stargate Project, and just minutes from Abilene Christian University and Hendrick North Hospital, this property sits in a high-demand rental corridor attracting students, medical professionals, and workforce tenants. The f
Key facts
- 7,405 sq ft lot
- 2 garage spots
- Built 2026
Neighborhood map
What this means for you Summary
Snapshot
- This is a 3-bed/2.0-bath single-family listed at $275k. Condition is rated good.
Deal economics
- At list price, monthly cash flow is $230 ($3k/yr) — positive.
- The deal already cash-flows at list — no discount required.
- To meet the 1% rule (rent ≥ 1% of price), the offer needs to be $270k (1.9% below list).
- Recommended offer: $270k (1.9% below list) — sets the bar for 1% rule.
Location & tenants
- Location reads 75/100 on livability (#142 in TX, #4,037 nationally) — a middle-class / working-renter tenant base. Strengths: cost of living A+, housing A+, health & safety A+; Watch: schools D+, crime D, commute F.
- Abilene ISD (urban): math 32% / reading 34% proficiency, ranked #575 of 826 in TX (top 70%) — families likely to look elsewhere, expect single-tenant / working-renter base with shorter leases.
- Market conditions: Rents rising fast (+43.4%/yr); 196 active listings in the ZIP; 3 comparable units currently listed for rent nearby; rentals lingering (median 46d on market — plan ~5-8 weeks vacancy on turnover, expect pricing pressure); 100% of comp listings sitting > 30 days — soft ceiling on asking rent; 508 units permitted in Taylor County in 2024 (0 in 5+ unit buildings).
- At $2,697/mo this rent would consume 60% of the median local household income ($54k/yr) (locally 1240% of renters already pay >50% of income on rent) — very limited rent-growth headroom before tenants either downsize or default.
Forward outlook
- Local home prices are declining (-3.0%/yr); year-one equity from $2k of loan paydown is wiped out by about $8k of value loss. Plan a longer hold.
- Taylor County population projected at +16% by 2050 — long-run rental-demand tailwind backs the buy-and-hold thesis.
- At projected returns (-3.0% appreciation + 8.0% rent growth), your $77k cash investment doubles in ~10 years — after that, you're playing with house money.
Negotiation context
- Only 1 days on market — expect competitive offers; lowballing is unlikely to land.
- 2 sale attempts; this cycle's ask is 9900% above the opening price — seller raised mid-cycle; expect resistance to lowballs.
Risks & watch-outs
- Climate carrying-cost: extreme-heat days projected 7→25/yr by 2055 (HVAC capex compounding) — expect insurance premiums to compound above CPI over the hold.
Questions for the listing agent
- Is there a deadline driving the sale (1031 exchange, divorce, estate, relocation)? That informs how much negotiation room exists.
- Schools are D-rated, which usually means shorter tenancies and higher turnover. Who's the typical renter profile here, and what's been the actual vacancy rate?
- Crime grade is D in this area — have there been break-ins, vandalism, or insurance claims at this property in the last 3 years? What carrier currently insures it and at what premium?
- What's the average days-on-market for RENTAL listings here right now (not sales)? A rising rental-DOM trend means longer vacancies and softer asking-rent achievability than the comps imply.
- What's the recent tenant-quality profile in this submarket — average credit score on applications, eviction rate, late-payment / NSF rate, and stable-employment percentage? A property-management company in the area should have these aggregated.
- How much new for-sale + rental construction is in the pipeline within 1–3 miles? Heavy new supply typically softens prices + rents 12–24 months out; constrained supply supports both.
Investment metrics
- 1% rule
- 0.98% ✗
- Cap rate
- 7.30%
- Cash-on-cash
- 3.59%
- DSCR
- 1.16
- GRM
- 8.5
CMA / ARV
- ARV (on-the-fly)
- $272,748
- Comps found
- 12
Show comp detail 12 sales within ~0.75 mi
| Address | Dist | Beds/Ba | Sqft | Sold | Price | $/sf | Match |
|---|---|---|---|---|---|---|---|
| 4173 Ranger Rd | 0.10mi | 3/2.0 | 1,337 (0%) | 1mo | $274,990 | $206 | 95 |
| 4225 Ranger Rd | 0.09mi | 3/2.0 | 1,337 (0%) | 1mo | $272,990 | $204 | 95 |
| 4217 Ranger Rd | 0.09mi | 3/2.0 | 1,337 (0%) | 1mo | $272,990 | $204 | 95 |
| 4149 Ranger Rd | 0.11mi | 3/2.0 | 1,337 (0%) | 0mo | $274,990 | $206 | 94 |
| 4201 Ranger Rd | 0.10mi | 3/2.0 | 1,337 (0%) | 1mo | $274,990 | $206 | 94 |
| 4181 Ranger Rd | 0.11mi | 3/2.0 | 1,337 (0%) | 1mo | $274,990 | $206 | 94 |
| 519 Colorado St | 0.11mi | 3/2.0 | 1,337 (0%) | 2mo | $272,990 | $204 | 94 |
| 511 Colorado St | 0.11mi | 3/2.0 | 1,337 (0%) | 2mo | $272,990 | $204 | 94 |
| 4157 Ranger Rd | 0.13mi | 3/2.0 | 1,337 (0%) | 0mo | $274,990 | $206 | 94 |
| 527 Colorado St | 0.11mi | 3/2.0 | 1,337 (0%) | 2mo | $272,990 | $204 | 94 |
| 4209 Ranger Rd | 0.11mi | 3/2.0 | 1,337 (0%) | 2mo | $272,990 | $204 | 93 |
| 435 Colorado St | 0.11mi | 3/2.0 | 1,337 (0%) | 2mo | $269,990 | $202 | 93 |
Match score weights: distance 35% · size 25% · config 20% · recency 20%. Top-matched comps best support the ARV.
Projected returns pro-forma
-3.0% appreciation · 8.0% rent growth · sell at horizon
- IRR
- -5.2%
- Equity multiple
- 0.80×
- Total profit
- $-15,593
- Equity at exit
- $41,002
- IRR
- 9.6%
- Equity multiple
- 1.91×
- Total profit
- $70,357
- Equity at exit
- $23,776
Cash invested: $76,997 (down + closing). Projections, not guarantees.
Landlord ↔ Tenant lean methodology
- Overall (STATE)
- 87 Strongly Landlord-Friendly
- State Texas
- 87 Strongly Landlord-Friendly · R+5
- County
- — inherits STATE
- City
- — inherits STATE
ZIP-level market 79601
- Home prices YoY
- -22.8%
- Rents YoY
- 43.4%
- Active inventory
- 196
- Price-to-rent
- 8.5×
Monthly cashflow live
- Estimated rent
- $2,697 medium interval (Pro) →
- Mortgage (P&I)
- −$1,442
- Tax est. 1.5%
- −$344 /mo · $4,125/yr
- Insurance
- −$115
- HOA
- −$0
- Lot rent
- −$0
- Vacancy / Maint / Mgmt
- −$566
- Net cashflow
- $230
Break-even live
Sensitivity live
| Price | -10% $420 | -5% $325 | +0% $230 | +5% $135 | +10% $40 |
|---|---|---|---|---|---|
| Rent | -10% $17 | -5% $124 | +0% $230 | +5% $337 | +10% $443 |
| Rate | -1.0pp $369 | -0.5pp $300 | base $230 | +0.5pp $159 | +1.0pp $87 |
UW: 25.0% down · 7.5% · 30yr · 1.5% tax · 5.0% vac · 8.0% maint · 8.0% mgmt
Financing live
Cash to close
- Down payment
- $68,748
- Closing costs
- $8,250
- Reserves months
- —
- Total cash needed
- —
Loan-product check · same deal, 3 products live
Conventional
25% down · 7.5% · 30yr
- Down + closing
- —
- Monthly P&I
- —
- Monthly cashflow
- —
- DSCR
- —
- Eligible?
- —
Personal DTI + credit; lowest rate.
DSCR
20% down · 8.5% · 30yr
- Down + closing
- —
- Monthly P&I
- —
- Monthly cashflow
- —
- DSCR
- —
- Eligible?
- —
No personal income docs; deal must DSCR.
Hard money
10% down · 12.0% · 12mo
- Down + closing
- —
- Monthly P&I
- —
- Monthly cashflow
- —
- DSCR
- —
- Eligible?
- —
Short-term bridge; refi at stabilization.
Rent comps 3 comps
| Address | Beds | Baths | Sqft | Rent | $/sqft | DOM | Units | Dist |
|---|---|---|---|---|---|---|---|---|
| 527 Colorado St Abilene, TX | 3.0 | 2.0 | 1337 | $2,750 | $2.06 | 46d | 1 | 0.09mi |
| 4225 Ranger Rd Abilene, TX | 3.0 | 2.0 | 1337 | $2,749 | $2.06 | 46d | 1 | 0.12mi |
| 4217 Ranger Rd Abilene, TX | 3.0 | 2.0 | 1337 | $2,749 | $2.06 | 46d | 1 | 0.12mi |
Listing history 3 events
-
2026-04-17$2,750
-
2026-04-13status Pending
-
2026-04-13$274,990 Active
ⓘ Source: listings_history table (triggers on properties + properties_extension) + one-shot
backfill from property_details.listing_events for pre-trigger history.
Climate risk First Street
- Flood 1/10 Low FEMA zone X (unshaded) · 0% chance over 30 yrs
- Wildfire 4/10 Moderate
- Heat 7/10 Severe 7 d/yr ≥104°F today · 25 d/yr by 30 yrs out
- Wind 4/10 Moderate 19% chance of damaging wind over 30 yrs
- Air quality 1/10 Low 0 unhealthy d/yr today · 0 by 30 yrs out
Nearby sold comps map
Loading sold comps map…
Walkable amenities ~0.75 mi
Loading nearby amenities…
Taxation est. · year 1
- Rental income
- $32,366
- − Mortgage interest
- −$15,404
- − Property taxes
- −$4,125
- − Insurance
- −$1,375
- − Repairs & maintenance
- −$2,589
- − Management
- −$2,589
- − Depreciation
- −$8,000
- Taxable loss
- −$1,716
- Est. tax savings @ 24.0%
- +$412
- After-tax cash flow
- $3,176/yr
For passive investors: Depreciation is non-cash, so a rental often shows a tax loss while cash-flowing — sheltering income. Rental losses are passive: they offset passive income freely, and up to $25,000/yr can offset ordinary (W-2) income if you actively participate and your MAGI is under $100k (phasing out to $0 by $150k); unused losses carry forward. On sale, claimed depreciation is recaptured at up to 25%, and gains may owe capital-gains tax (a 1031 exchange can defer both). Figures are a year-1 estimate at your 24.0% rate — not tax advice; consult a CPA.
Condition & rehab AI · 10 photos
This new construction home in Abilene, TX is move-in ready with a modern design and low-maintenance features, ideal for both resale and rental markets.
Value-add opportunities
- Both Paint interior walls — Fresh paint enhances curb appeal and interior aesthetics.
- Both Install smart home devices — Smart home devices improve convenience and attract tech-savvy buyers/tenants.
- Both Add outdoor lighting — Outdoor lighting enhances safety and curb appeal, especially in a new construction setting.
Renovation cost estimate screening
Value-add ROI direction
- Both Paint interior walls — Fresh paint enhances curb appeal and interior aesthetics. ↑
- Both Install smart home devices — Smart home devices improve convenience and attract tech-savvy buyers/tenants. ↑
- Both Add outdoor lighting — Outdoor lighting enhances safety and curb appeal, especially in a new construction setting. ↑
ⓘ Cost ranges are severity-bucket heuristics (US national rule-of-thumb). Get contractor quotes + a written scope before underwriting a rehab budget.
Schools (NCES district)
- District
- Abilene ISD
- NCES district ID
- 4807440
- Math proficiency
- 32% ▼ -11.00%
- Reading proficiency
- 34% ▼ -5.00%
- Median HH income
- $39,782
- Composite
- 27.71/100
- National rank
- #6909
- State rank
- #575 of 826 in TX
Livability — Abilene
- Score
- 75/100
- State rank
- #142
- US rank
- #4037
Category grades
Schools grade is shown separately in the Schools card above.
Census & demographics
- Census place
- Abilene, TX
- County
- Taylor County · 136,672 people
- City population
- 136,672
- Metro
- Abilene, TX
- Population (ZIP)
- 28,050
- Household income
- $53,631
- Rent vs Own
- Severe rent burden
- 1240.0
Population outlook (Taylor County) Hauer SSP2
- Today (2025)
- 145,270 people
- By 2030
- 150,050 · +3.3%
- By 2040
- 159,417 · +9.7%
- By 2050
- 168,883 · +16.3%
- By 2075
- 194,436 · +33.8%
- By 2100
- 203,163 · +39.9%
Race, ethnicity, and origin ACS 2023
- Neighborhood character
- Diverse neighborhood (Simpson 0.61)
- Race & ethnicity
- White 55% Hispanic / Latino 25% Black 13% Two or more races 13% Asian 3%
- Hispanic origin (detail)
- Mexican 21%
- Common ancestry
- Italian 2% Lithuanian 2% Serbian 1%
- Foreign-born
- 7% · Canada, Vietnam
- Languages at home
- 81% English-only · Spanish 15% French/Haitian/Cajun 1% Vietnamese 1%
Political lean MEDSL · Taylor
- 2024 margin
- Solid R (+49.8) · D 24.6% · R 74.4% · Other 1.0%
- 2008→2024 swing
- -4.2pp toward R · 2008: -45.6pp · 2024: -49.8pp
- All cycles
- 2024: R+49.8 2020: R+45.3 2016: R+51.1 2012: R+53.6 2008: R+45.6
Not yet ingested
- Civics
- —
Market trends
- HPI YoY
- ▼ -63.17%
- Current HPI
- 214.4372
- Rent YoY
- ▲ 43.38%
- Metro
- Abilene, TX
- State GDP YoY
- ▲ 3.95%
- F500 in state
- 110
Industry mix (Fortune 500 HQ in TX)
| Industry | F500 HQs | Revenue |
|---|---|---|
| Energy | 16 | $1,198B |
|
||
| Technology | 5 | $198B |
|
||
| Engineering / Construction | 4 | $72B |
|
||
| Energy Services | 3 | $60B |
|
||
| Utilities | 3 | $41B |
|
||
| Healthcare | 2 | $330B |
|
||
Price history
-99.0% since first listed3 events — show timeline
- 2026-04-17 Listed for Rent $2,750 NTREIS
- 2026-04-13 Pending — NTREIS
- 2026-04-13 Listed $274,990 NTREIS
Cash-flow waterfall
monthlySold comps — $/sqft
last 12 mo · ≤1 miLoading sold comps…