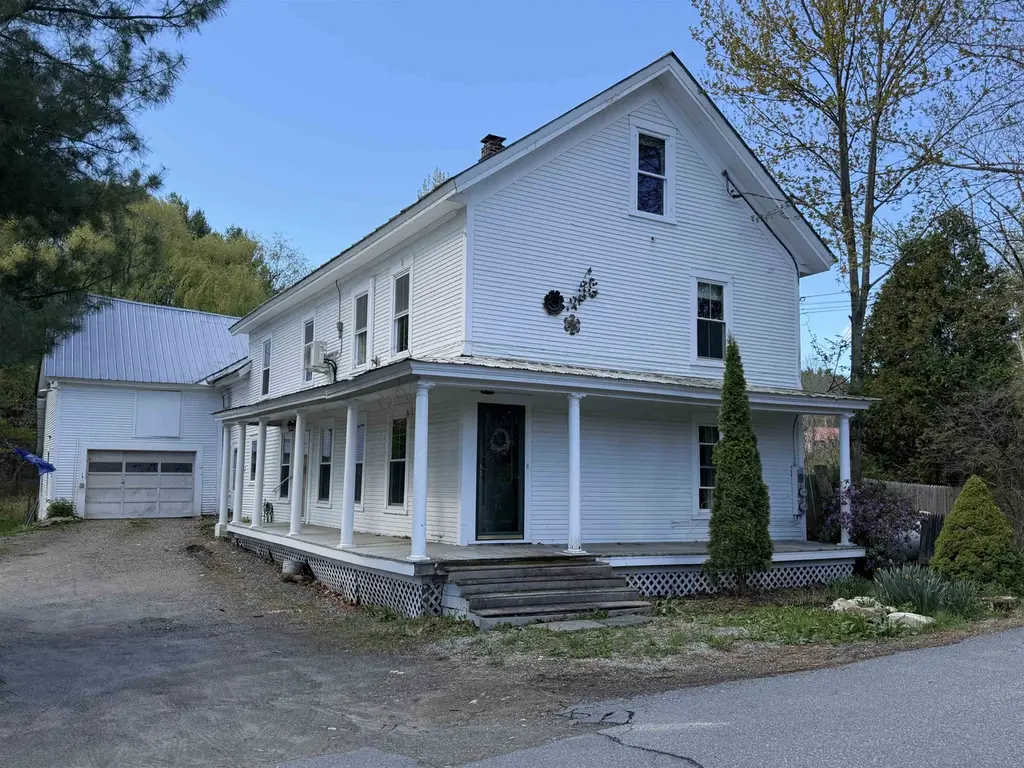
397 River St · Chester, VT
Flood risk 9/10 · Severe
- FEMA flood zone
- X (unshaded)
- Chance of flooding over 30 yrs
- 0.99%
- Est. flood insurance / yr
- $473 – $860
Fire risk 1/10 · Minimal
- Est. fire insurance / yr
- $480 – $892
Heat risk 2/10 · Minimal
- Hot days now (above 92°F)
- 7 days/yr
- Hot days in 30 yrs
- 17 days/yr
Wind risk 3/10 · Minor
- Chance of severe wind over 30 yrs
- 6.0%
Air-quality risk 1/10 · Minimal
- Unhealthy air days now
- 0 days/yr
- Unhealthy air days in 30 yrs
- 0 days/yr
Risk factors via First Street. Map © Google.
Why this score? — see what drove the B grade
The composite is a weighted blend of 9 inputs, each scored 0–100. Each bar is that input's sub-score; the figure is the points it added to the 100-point composite (weight × sub-score).
- Cash flow +20.4/30.0
- ARV discount +15.0/15.0
- Appreciation +10.0/10.0
- DSCR +6.5/10.0
- 1% rule +5.2/10.0
- Schools +5.0/10.0
- Livability +3.6/5.0
- Rent growth +2.5/5.0
- Condition / age +2.5/5.0
$325,000
🖨 Deal sheet (PDF) 📄 Offer letter ✓ Due diligence
Listing remarks
Some properties just radiate a certain warmth, charm and magic and this home is definitely one of them. Imagine sitting on the front porch and listening the soft rustle of the willow tree leaves and the babbling brook trickling by, then you step inside and feel that you have walked into a home that was truly loved. The large kitchen offers nice upgrades including tile floor, granite countertops and appliances. The main level offers a bedroom, dining room, office space and living room. All of the windows have been replaced (except in the attic), updated electric panel, insulation done by Efficiency VT, new stoves in the barn room and living room (see MLS docs for the complete list). This pro
Key facts
- Tile floor
- New stoves
- Front porch
Tags
Property features AI
Exterior
- Parking: 1-car garage
- Utilities: Public water; Public sewer; Circuit breaker electrical panel; High-speed internet available; Cable available
- Home design: Antique farmhouse style; Existing structure; Metal roof; Built in 1854
- Construction: Wood frame construction
- Exterior features: Country setting; Level lot; In-town location; Neighborhood setting; Gravel driveway
Interior
- Kitchen: Dishwasher; Gas range; Refrigerator
- Flooring: Carpet; Hardwood; Tile
- Bathrooms: 1 full bathroom; 2 three-quarter bathrooms
- Heating & cooling: Propane heating; Forced air heating; Mini-split heating and cooling
- Interior features: 10 total rooms; Crawl space basement with dirt floor (unfinished); Carpet, hardwood and tile flooring
Neighborhood map
What this means for you Summary
Snapshot
- This is a 4-bed/3.0-bath single-family listed at $325k.
Deal economics
- At list price, monthly cash flow is $367 ($4k/yr) — positive.
- The deal already cash-flows at list — no discount required.
- Meets the 1% rule at list price ($3k rent vs $325k).
- Recommended offer: $315k (3.0% below list) — sets the bar for market timing.
Location & tenants
- Location reads 72/100 on livability (#30 in VT) — a middle-class / working-renter tenant base. Strengths: crime A+, housing A+, health & safety A+; Watch: amenities F, commute F.
- Zoned schools: Chester Andover Elementary School (math 22% / reading 32%, grade F, #151 of 192 statewide, top 82%, 270 students, 44% FRL); Green Mountain Union High School (math 27% / reading 52%, grade F, #20 of 48 statewide, top 45%, 326 students, 48% FRL).
- Market conditions: 50 active listings in the ZIP; 1 comparable units currently listed for rent nearby; 339 units permitted in Windsor County in 2024 (240 in 5+ unit buildings).
Forward outlook
- In year one you build about $35k of equity ($2k loan paydown + $32k appreciation (10.0% local appreciation)).
- Windsor County population projected at -21% by 2050 — secular population decline; favor cash flow + early exit over multi-decade hold.
- At projected returns (10.0% appreciation + 3.0% rent growth), your $91k cash investment doubles in ~3 years — after that, you're playing with house money.
- By year 2, paydown + projected appreciation supports a ~$56k cash-out refi (75% LTV) — recoverable capital for the next deal without selling this one.
Negotiation context
- It's been on market 43 days — a 3% lower offer ($315k) is reasonable based on typical stale-listing flexibility.
Risks & watch-outs
- Watch-outs: flood insurance adds $56/mo; built in 1854 — expect roof / HVAC / electrical / plumbing capex.
- Climate carrying-cost: severe flood risk — expect insurance premiums to compound above CPI over the hold.
Questions for the listing agent
- It's been on market 43 days. Have you received any prior offers? Is the seller open to a 3% concession, seller financing, or rate buy-down credit?
- Built in 1854 — when were the roof, HVAC, electrical panel, plumbing, and water heater last replaced?
- What's the actual annual flood-insurance premium (NFIP or private), and is the property in a SFHA with mandatory coverage?
- Is there a deadline driving the sale (1031 exchange, divorce, estate, relocation)? That informs how much negotiation room exists.
- What's the average days-on-market for RENTAL listings here right now (not sales)? A rising rental-DOM trend means longer vacancies and softer asking-rent achievability than the comps imply.
- What's the recent tenant-quality profile in this submarket — average credit score on applications, eviction rate, late-payment / NSF rate, and stable-employment percentage? A property-management company in the area should have these aggregated.
- How much new for-sale + rental construction is in the pipeline within 1–3 miles? Heavy new supply typically softens prices + rents 12–24 months out; constrained supply supports both.
Investment metrics
- 1% rule
- 1.02% ✓
- Cap rate
- 7.85%
- Cash-on-cash
- 5.57%
- DSCR
- 1.25
- GRM
- 8.2
CMA / ARV
- ARV (median comp)
- $491,911
- List price
- $325,000
- Delta
- -33.93%
- Verdict
- UNDERPRICED
- Comps
- 18 within 1.0 mi
Show comp detail 3 sales within ~0.75 mi
| Address | Dist | Beds/Ba | Sqft | Sold | Price | $/sf | Match |
|---|---|---|---|---|---|---|---|
| 515 Main St | 0.66mi | 4/4.0 | 3,024 (-1%) | 8mo | $140,000 | $46 | 57 |
| 198 Coach Rd | 0.51mi | 4/2.5 | 2,904 (-5%) | 12mo | $350,000 | $121 | 56 |
| 95 Church St | 0.64mi | 4/3.0 | 2,794 (-8%) | 2mo | $563,000 | $202 | 54 |
Match score weights: distance 35% · size 25% · config 20% · recency 20%. Top-matched comps best support the ARV.
Projected returns pro-forma
10.0% appreciation · 3.0% rent growth · sell at horizon
- IRR
- 27.8%
- Equity multiple
- 3.20×
- Total profit
- $200,400
- Equity at exit
- $292,786
- IRR
- 24.2%
- Equity multiple
- 7.28×
- Total profit
- $571,875
- Equity at exit
- $631,404
Cash invested: $91,000 (down + closing). Projections, not guarantees.
Landlord ↔ Tenant lean methodology
- Overall (STATE)
- 41 Moderately Tenant-Leaning
- State Vermont
- 41 Moderately Tenant-Leaning · D+15
- County
- — inherits STATE
- City
- — inherits STATE
ZIP-level market 05143
- Home prices YoY
- 7.7%
- Active inventory
- 50
- Price-to-rent
- 8.2×
Monthly cashflow live
- Estimated rent
- $3,300 medium interval (Pro) →
- Mortgage (P&I)
- −$1,704
- Tax from tax record
- −$345 /mo · $4,141/yr
- Insurance
- −$135
- Flood insurance flood zone
- −$56 /mo · $666/yr
- HOA
- −$0
- Vacancy / Maint / Mgmt
- −$693
- Net cashflow
- $367
Break-even live
Sensitivity live
| Price | -10% $551 | -5% $459 | +0% $367 | +5% $275 | +10% $183 |
|---|---|---|---|---|---|
| Rent | -10% $106 | -5% $236 | +0% $367 | +5% $497 | +10% $627 |
| Rate | -1.0pp $530 | -0.5pp $449 | base $367 | +0.5pp $282 | +1.0pp $197 |
UW: 25.0% down · 7.5% · 30yr · 1.5% tax · 5.0% vac · 8.0% maint · 8.0% mgmt
Financing live
Cash to close
- Down payment
- $81,250
- Closing costs
- $9,750
- Reserves months
- —
- Total cash needed
- —
Loan-product check · same deal, 3 products live
Conventional
25% down · 7.5% · 30yr
- Down + closing
- —
- Monthly P&I
- —
- Monthly cashflow
- —
- DSCR
- —
- Eligible?
- —
Personal DTI + credit; lowest rate.
DSCR
20% down · 8.5% · 30yr
- Down + closing
- —
- Monthly P&I
- —
- Monthly cashflow
- —
- DSCR
- —
- Eligible?
- —
No personal income docs; deal must DSCR.
Hard money
10% down · 12.0% · 12mo
- Down + closing
- —
- Monthly P&I
- —
- Monthly cashflow
- —
- DSCR
- —
- Eligible?
- —
Short-term bridge; refi at stabilization.
Rent comps 1 comps
| Address | Beds | Baths | Sqft | Rent | $/sqft | DOM | Units | Dist |
|---|---|---|---|---|---|---|---|---|
| 735 Main St Chester, VT | 4.0 | 3.0 | 2200 | $3,300 | $1.50 | 16d | 1 | 0.86mi |
Listing history 18 events
-
2026-06-21days on market $325,000 Active 43 DOM
-
2026-06-21days on market $325,000 Active 42 DOM
-
2026-06-18days on market $325,000 Active 40 DOM
-
2026-06-17days on market $325,000 Active 39 DOM
-
2026-06-16days on market $325,000 Active 38 DOM
-
2026-06-15days on market $325,000 Active 37 DOM
-
2026-06-15pricedays on market $325,000 Active 36 DOM
-
2026-06-13days on market $349,000 Active 35 DOM
-
2026-06-12days on market $349,000 Active 34 DOM
-
2026-06-09days on market $349,000 Active 31 DOM
-
2026-06-08days on market $349,000 Active 30 DOM
-
2026-06-08days on market $349,000 Active 29 DOM
-
2026-06-07days on market $349,000 Active 28 DOM
-
2026-06-03days on market $349,000 Active 25 DOM
-
2026-06-02days on market $349,000 Active 24 DOM
-
2026-06-01days on market $349,000 Active 23 DOM
-
2026-05-31days on market $349,000 Active 22 DOM
-
2026-05-08$349,000 Active 1591-char remark
ⓘ Source: listings_history table (triggers on properties + properties_extension) + one-shot
backfill from property_details.listing_events for pre-trigger history.
Tax reassessment forecast VT · Partial reset (capped growth)
- Current annual tax
- $4,141 · $345/mo
- Projected year-2 tax
- $5,158 · $430/mo
- Expected delta
- +$1,017/yr (+$85/mo · 24.6%)
ⓘ Screening estimate from a state-policy table — verify with the county assessor before closing.
Climate risk First Street
- Flood 9/10 Extreme FEMA zone X (unshaded) · 99% chance over 30 yrs
- Wildfire 1/10 Low
- Heat 2/10 Low 7 d/yr ≥92°F today · 17 d/yr by 30 yrs out
- Wind 3/10 Moderate 6% chance of damaging wind over 30 yrs
- Air quality 1/10 Low 0 unhealthy d/yr today · 0 by 30 yrs out
Nearby sold comps map
Loading sold comps map…
Walkable amenities ~0.75 mi
Loading nearby amenities…
Taxation est. · year 1
- Rental income
- $39,600
- − Mortgage interest
- −$18,205
- − Property taxes
- −$4,141
- − Insurance
- −$2,292
- − Repairs & maintenance
- −$3,168
- − Management
- −$3,168
- − Depreciation
- −$9,455
- Taxable loss
- −$828
- Est. tax savings @ 24.0%
- +$199
- After-tax cash flow
- $4,598/yr
For passive investors: Depreciation is non-cash, so a rental often shows a tax loss while cash-flowing — sheltering income. Rental losses are passive: they offset passive income freely, and up to $25,000/yr can offset ordinary (W-2) income if you actively participate and your MAGI is under $100k (phasing out to $0 by $150k); unused losses carry forward. On sale, claimed depreciation is recaptured at up to 25%, and gains may owe capital-gains tax (a 1031 exchange can defer both). Figures are a year-1 estimate at your 24.0% rate — not tax advice; consult a CPA.
Schools (NCES district)
No district data.
Livability — Chester
- Score
- 72/100
- State rank
- #30
- US rank
- #6451
Category grades
Schools grade is shown separately in the Schools card above.
Census & demographics
- Census place
- Chester, VT
- Population (ZIP)
- 4,916
Population outlook (Windsor County) Hauer SSP2
- Today (2025)
- 53,235 people
- By 2030
- 51,269 · -3.7%
- By 2040
- 46,517 · -12.6%
- By 2050
- 41,859 · -21.4%
- By 2075
- 33,298 · -37.5%
- By 2100
- 24,523 · -53.9%
Race, ethnicity, and origin ACS 2023
- Neighborhood character
- Predominantly White (96%)
- Race & ethnicity
- White 96% Two or more races 2% Black 1%
- Common ancestry
- Romanian 8% Lithuanian 6% Slovak 6%
- Foreign-born
- 4% · Canada
- Languages at home
- 97% English-only · French/Haitian/Cajun 2%
Political lean MEDSL · Windsor
- 2024 margin
- Solid D (+35.6) · D 66.3% · R 30.7% · Other 2.9%
- 2008→2024 swing
- -4.1pp toward R · 2008: 39.7pp · 2024: 35.6pp
- All cycles
- 2024: D+35.6 2020: D+38.9 2016: D+32.1 2012: D+38.1 2008: D+39.7
Not yet ingested
- Civics
- —
Market trends
- HPI YoY
- ▲ 25.13%
- Current HPI
- 352.8055
- Rent YoY
- —
- Metro
- —
- State GDP YoY
- —
- F500 in state
- 0
Price history
-6.9% since first listed2 events — show timeline
- 2026-06-15 Price Changed $325,000 PrimeMLS
- 2026-05-08 Listed $349,000 PrimeMLS
Property tax history
-3.8%/yrLatest (2024): $4,141 · +2.9% YoY. Source: county tax records.
Cash-flow waterfall
monthlySold comps — $/sqft
last 12 mo · ≤1 miLoading sold comps…