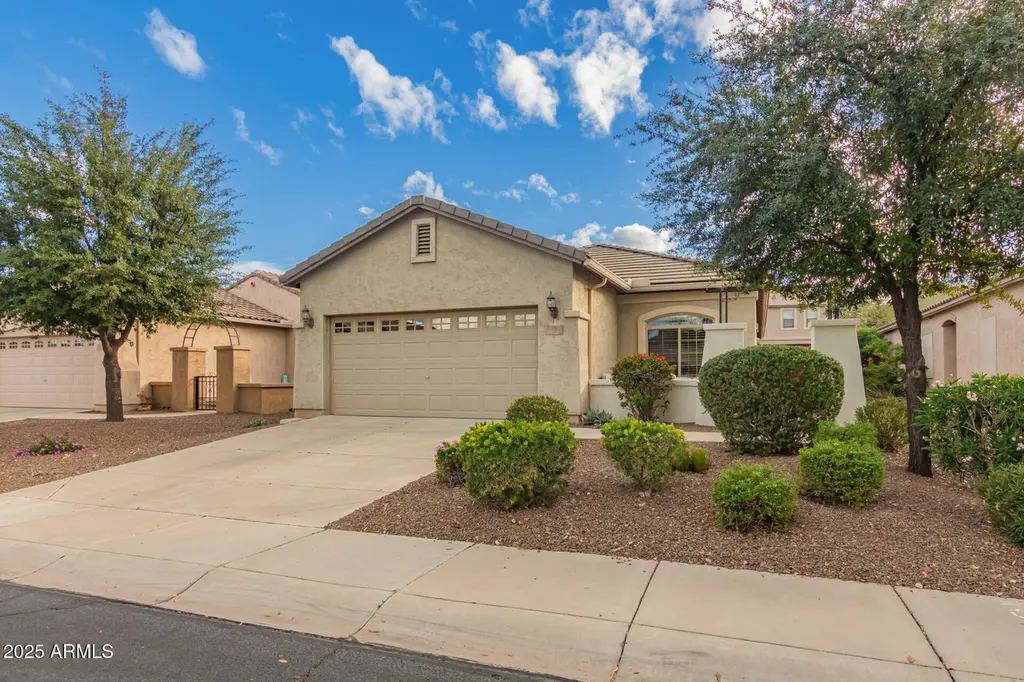
26157 W Runion Dr · Buckeye, AZ
Flood risk 1/10 · Minimal
- FEMA flood zone
- X (shaded)
- Chance of flooding over 30 yrs
- 0.0%
- Est. flood insurance / yr
- $507 – $1,088
Fire risk 5/10 · Moderate
- Est. fire insurance / yr
- $610 – $1,132
Heat risk 8/10 · Major
- Hot days now (above 111°F)
- 6 days/yr
- Hot days in 30 yrs
- 14 days/yr
Wind risk 1/10 · Minimal
- Chance of severe wind over 30 yrs
- —
Air-quality risk 2/10 · Minimal
- Unhealthy air days now
- 0 days/yr
- Unhealthy air days in 30 yrs
- 1 days/yr
Risk factors via First Street. Map © Google.
Why this score? — see what drove the D grade
The composite is a weighted blend of 9 inputs, each scored 0–100. Each bar is that input's sub-score; the figure is the points it added to the 100-point composite (weight × sub-score).
- Cash flow +13.5/30.0
- ARV discount +10.8/15.0
- DSCR +4.1/10.0
- Rent growth +3.4/5.0
- Livability +3.4/5.0
- 1% rule +3.2/10.0
- Schools +2.9/10.0
- Condition / age +2.5/5.0
- Appreciation +0.0/10.0
$325,000
🖨 Deal sheet (PDF) 📄 Offer letter ✓ Due diligence
Listing remarks
Welcome to this charming 3 bed, 2 bath home in the desirable Festival Foothills just minutes from the elementary school! A manicured desert landscape, 2 car garage, and a gated courtyard are just the beginning. The interior features tons of natural light, a freshly painted neutral palette, ALL NEW CARPET & tile flooring throughout. You'll love the spacious formal living room paired with sliding doors to the back! The eat-in kitchen boasts built-in appliances and a cozy dining space. The large main bedroom has an ensuite with dual sinks & a walk-in closet. Tranquility awaits in the backyard! It is perfect for relaxation and gatherings with a covered patio. Enjoy the community par
Key facts
- New carpet
- Natural light
- Tile flooring
Tags
Property features AI
Finance
- HOA & community: HOA with $115 monthly fee covering grounds maintenance; Community amenities: golf, playground, biking/walking path
Exterior
- Parking: 2 covered parking spaces; 2 open parking spaces; 2-car garage with garage door opener and direct access
- Utilities: City water; Public sewer
- Home design: Single family residence; Fee simple ownership; Desert and mountain views
- Construction: Stucco and painted wood frame construction; Tile roof
- Exterior features: Private yard; Desert front and back landscaping; Gravel/stone front and back; Automatic timer irrigation front and back; County-maintained road
Interior
- Kitchen: Built-in microwave; Laminate counters; Pantry; Dishwasher; Garbage disposal; Eat-in kitchen
- Bedrooms: Up to 3 bedrooms
- Flooring: Carpet; Tile
- Bathrooms: 2 full bathrooms
- Heating & cooling: Natural gas heating; Central air; Ceiling fans
- Interior features: High-speed internet; Double vanity; Eat-in kitchen; 9+ foot flat ceilings; Furnished (see remarks); No interior steps; Pantry; 3/4 bath in master bedroom; Laminate counters; Dual-pane windows
- Laundry & utility: Inside laundry
Neighborhood map
What this means for you Summary
Snapshot
- This is a 3-bed/3.0-bath single-family listed at $325k.
Deal economics
- At list price, monthly cash flow is $9 ($108/yr) — positive.
- The deal already cash-flows at list — no discount required.
- To meet the 1% rule (rent ≥ 1% of price), the offer needs to be $267k (17.8% below list).
- Recommended offer: $267k (17.8% below list) — sets the bar for 1% rule.
- Cap rate 6.3% vs local median 3.1% in Buckeye — top-decile yield for the area; either an underpriced asset or a hidden risk that comps aren't pricing in. Stress-test before assuming the spread holds.
Location & tenants
- Location reads 68/100 on livability (#53 in AZ) — a middle-class / working-renter tenant base. Strengths: employment A+, housing A+, crime A; Watch: amenities F, commute F, health & safety F.
- Wickenburg Unified District (4236) (rural): math 33% / reading 35% proficiency, ranked #92 of 249 in AZ (top 37%) — families likely to look elsewhere, expect single-tenant / working-renter base with shorter leases.
- Zoned schools: Festival Foothills Elementary School (math 47% / reading 47%, grade D-, #308 of 1,109 statewide, top 29%, 314 students, 31% FRL); Vulture Peak Middle School (math 27% / reading 32%, grade F, #84 of 218 statewide, top 41%, 162 students, 51% FRL); Wickenburg High School (math 27% / reading 32%, grade F, #120 of 381 statewide, top 34%, 460 students, 40% FRL).
- Market conditions: Rents rising (+3.4%/yr); 951 active listings in the ZIP; 19 comparable units currently listed for rent nearby; rentals leasing fast (median 5d on market — plan ~1-2 weeks tenant-placement turnaround); high-income renter base; 36,011 units permitted in Maricopa County in 2024 (12,801 in 5+ unit buildings).
Forward outlook
- Local home prices are declining (-3.0%/yr); year-one equity from $2k of loan paydown is wiped out by about $10k of value loss. Plan a longer hold.
- Maricopa County population projected at +38% by 2050 — long-run rental-demand tailwind backs the buy-and-hold thesis.
Negotiation context
- It's been on market 26 days — a 2% lower offer ($320k) is reasonable based on typical stale-listing flexibility.
Risks & watch-outs
- Climate carrying-cost: moderate wildfire risk; extreme-heat days projected 6→14/yr by 2055 (HVAC capex compounding) — expect insurance premiums to compound above CPI over the hold.
Questions for the listing agent
- What does the HOA fee cover, when was the last increase, and are there any pending special assessments or reserve-fund shortfalls?
- Is there a deadline driving the sale (1031 exchange, divorce, estate, relocation)? That informs how much negotiation room exists.
- Schools are D-rated, which usually means shorter tenancies and higher turnover. Who's the typical renter profile here, and what's been the actual vacancy rate?
- The area grade is low — what's the realistic commute time and amenity access for the typical tenant pool here? Any planned neighborhood developments (good or bad) we should know about?
- What's the average days-on-market for RENTAL listings here right now (not sales)? A rising rental-DOM trend means longer vacancies and softer asking-rent achievability than the comps imply.
- What's the recent tenant-quality profile in this submarket — average credit score on applications, eviction rate, late-payment / NSF rate, and stable-employment percentage? A property-management company in the area should have these aggregated.
- How much new for-sale + rental construction is in the pipeline within 1–3 miles? Heavy new supply typically softens prices + rents 12–24 months out; constrained supply supports both.
Investment metrics
- 1% rule
- 0.82% ✗
- Cap rate
- 6.33%
- Cash-on-cash
- 0.12%
- DSCR
- 1.01
- GRM
- 10.1
CMA / ARV
- ARV (on-the-fly)
- $350,812
- Comps found
- 12
Show comp detail 12 sales within ~0.75 mi
| Address | Dist | Beds/Ba | Sqft | Sold | Price | $/sf | Match |
|---|---|---|---|---|---|---|---|
| 26320 W Potter Dr | 0.26mi | 2/2.0 (-1) | 1,493 (+1%) | 2mo | $325,700 | $218 | 75 |
| 26109 W Runion Dr | 0.06mi | 3/2.0 | 1,625 (+10%) | 3mo | $300,000 | $185 | 74 |
| 19794 N 264th Ave | 0.50mi | 2/2.0 (-1) | 1,494 (+1%) | 1mo | $340,000 | $228 | 65 |
| 21235 N 262nd Dr | 0.49mi | 2/2.0 (-1) | 1,410 (-4%) | 3mo | $270,000 | $191 | 58 |
| 26485 W Pontiac Dr | 0.44mi | 2/2.0 (-1) | 1,612 (+9%) | 1mo | $445,000 | $276 | 54 |
| 26638 W Irma Ln | 0.62mi | 3/2.0 | 1,375 (-7%) | 2mo | $375,000 | $273 | 54 |
| 26455 W Pontiac Dr | 0.40mi | 2/2.0 (-1) | 1,612 (+9%) | 3mo | $417,000 | $259 | 54 |
| 26494 W Sierra Pinta Dr | 0.46mi | 2/2.0 (-1) | 1,612 (+9%) | 2mo | $370,000 | $230 | 52 |
| 21361 N 262nd Dr | 0.56mi | 2/2.0 (-1) | 1,612 (+9%) | 3mo | $380,000 | $236 | 47 |
| 26679 W Irma Ln | 0.67mi | 2/2.0 (-1) | 1,375 (-7%) | 3mo | $339,500 | $247 | 46 |
| 21489 N 262nd Dr | 0.65mi | 2/2.0 (-1) | 1,612 (+9%) | 2mo | $449,900 | $279 | 43 |
| 26126 W Piute Ave | 0.60mi | 2/2.0 (-1) | 1,261 (-14%) | 2mo | $300,000 | $238 | 38 |
Match score weights: distance 35% · size 25% · config 20% · recency 20%. Top-matched comps best support the ARV.
Projected returns pro-forma
-3.0% appreciation · 3.41% rent growth · sell at horizon
- IRR
- -15.7%
- Equity multiple
- 0.44×
- Total profit
- $-51,032
- Equity at exit
- $48,459
- IRR
- -6.6%
- Equity multiple
- 0.57×
- Total profit
- $-39,314
- Equity at exit
- $28,100
Cash invested: $91,000 (down + closing). Projections, not guarantees.
Landlord ↔ Tenant lean methodology
- Overall (STATE)
- 87 Strongly Landlord-Friendly
- State Arizona
- 87 Strongly Landlord-Friendly · R+3
- County
- — inherits STATE
- City
- — inherits STATE
ZIP-level market 85396
- Home prices YoY
- -18.8%
- Rents YoY
- 3.4%
- Active inventory
- 951
- Price-to-rent
- 10.1×
Monthly cashflow live
- Estimated rent
- $2,673 high interval (Pro) →
- Mortgage (P&I)
- −$1,704
- Tax from tax record
- −$138 /mo · $1,656/yr
- Insurance
- −$135
- HOA
- −$125
- Vacancy / Maint / Mgmt
- −$561
- Net cashflow
- $9
Break-even live
Sensitivity live
| Price | -10% $193 | -5% $101 | +0% $9 | +5% $-83 | +10% $-175 |
|---|---|---|---|---|---|
| Rent | -10% $-202 | -5% $-97 | +0% $9 | +5% $115 | +10% $220 |
| Rate | -1.0pp $173 | -0.5pp $92 | base $9 | +0.5pp $-75 | +1.0pp $-161 |
UW: 25.0% down · 7.5% · 30yr · 1.5% tax · 5.0% vac · 8.0% maint · 8.0% mgmt
Financing live
Cash to close
- Down payment
- $81,250
- Closing costs
- $9,750
- Reserves months
- —
- Total cash needed
- —
Loan-product check · same deal, 3 products live
Conventional
25% down · 7.5% · 30yr
- Down + closing
- —
- Monthly P&I
- —
- Monthly cashflow
- —
- DSCR
- —
- Eligible?
- —
Personal DTI + credit; lowest rate.
DSCR
20% down · 8.5% · 30yr
- Down + closing
- —
- Monthly P&I
- —
- Monthly cashflow
- —
- DSCR
- —
- Eligible?
- —
No personal income docs; deal must DSCR.
Hard money
10% down · 12.0% · 12mo
- Down + closing
- —
- Monthly P&I
- —
- Monthly cashflow
- —
- DSCR
- —
- Eligible?
- —
Short-term bridge; refi at stabilization.
Rent comps 19 comps
| Address | Beds | Baths | Sqft | Rent | $/sqft | DOM | Units | Dist |
|---|---|---|---|---|---|---|---|---|
| 26182 W Tonto Ln Buckeye, AZ | 3.0 | 2.0 | 1625 | $1,695 | $1.04 | 4d | 1 | 0.38mi |
| 26237 W Matthew Dr Buckeye, AZ | 2.0 | 2.0 | 1646 | $3,500 | $2.13 | 0d | 1 | 0.43mi |
| 26477 W Ross Ave Buckeye, AZ | 3.0 | 2.0 | 1375 | $1,500 | $1.09 | 45d | 1 | 0.46mi |
| 26087 W Tonto Ln Buckeye, AZ | 2.0 | 2.0 | 1625 | $2,300 | $1.42 | 45d | 1 | 0.46mi |
| 20669 N 266th Ave Buckeye, AZ | 3.0 | 2.0 | 1612 | $4,200 | $2.61 | 26d | 1 | 0.55mi |
| 26731 W Pontiac Dr Buckeye, AZ | 2.0 | 2.0 | 1373 | $1,475 | $1.07 | 4d | 1 | 0.72mi |
| 21605 N 261st Ave Buckeye, AZ | 2.0 | 2.0 | 1115 | $2,000 | $1.79 | 0d | 1 | 0.72mi |
| 26766 W Mohawk Ln Buckeye, AZ | 2.0 | 2.0 | 1375 | $2,500 | $1.82 | 0d | 1 | 0.77mi |
| 26197 W Vista North Dr Buckeye, AZ | 2.0 | 2.0 | 1375 | $2,900 | $2.11 | 0d | 1 | 0.80mi |
| 26197 W Vista North Dr Buckeye, AZ | 2.0 | 2.0 | 1375 | $2,850 | $2.07 | 12d | 1 | 0.80mi |
| 26170 W Vista North Dr Buckeye, AZ | 2.0 | 2.0 | 1115 | $3,300 | $2.96 | 3d | 1 | 0.84mi |
| 26195 W Via del Sol Dr Buckeye, AZ | 2.0 | 2.0 | 1493 | $3,300 | $2.21 | 0d | 1 | 0.86mi |
| 26208 W Tina Ln Buckeye, AZ | 2.0 | 2.0 | 1612 | $1,999 | $1.24 | 14d | 1 | 0.93mi |
| 26781 W Oraibi Dr Buckeye, AZ | 2.0 | 2.0 | 1561 | $2,000 | $1.28 | 20d | 1 | 0.97mi |
| 27013 W Potter Dr Buckeye, AZ | 2.0 | 2.0 | 1612 | $4,200 | $2.61 | 45d | 1 | 1.08mi |
| 26881 W Utopia Rd Buckeye, AZ | 2.0 | 2.0 | 1705 | $3,500 | $2.05 | 0d | 1 | 1.12mi |
| 20311 N 271st Ave Buckeye, AZ | 2.0 | 2.0 | 1612 | $3,000 | $1.86 | 3d | 1 | 1.20mi |
| 18675 N 268th Ave Buckeye, AZ | 2.0 | 2.0 | 1865 | $1,799 | $0.96 | 45d | 1 | 1.33mi |
| 27244 W Potter Dr Buckeye, AZ | 2.0 | 2.0 | 1612 | $3,500 | $2.17 | 45d | 1 | 1.37mi |
HOA detail
- Monthly dues
- $125 · $1,500/yr
- Likely covers
- security
Listing history 16 events
-
2026-06-21days on market $325,000 Active 26 DOM
-
2026-06-18days on market $325,000 Active 23 DOM
-
2026-06-17days on market $325,000 Active 22 DOM
-
2026-06-16days on market $325,000 Active 21 DOM
-
2026-06-15days on market $325,000 Active 20 DOM
-
2026-06-13days on market $325,000 Active 18 DOM
-
2026-06-13days on market $325,000 Active 17 DOM
-
2026-06-09days on market $325,000 Active 14 DOM
-
2026-06-08days on market $325,000 Active 13 DOM
-
2026-06-07days on market $325,000 Active 12 DOM
-
2026-06-04days on market $325,000 Active 9 DOM
-
2026-06-03days on market $325,000 Active 8 DOM
-
2026-06-02days on market $325,000 Active 7 DOM
-
2026-06-01days on market $325,000 Active 6 DOM
-
2026-05-31days on market $325,000 Active 5 DOM
-
2026-05-26$325,000 Active
ⓘ Source: listings_history table (triggers on properties + properties_extension) + one-shot
backfill from property_details.listing_events for pre-trigger history.
Tax reassessment forecast AZ · Resets to sale price
- Current annual tax
- $1,656 · $138/mo
- Projected year-2 tax
- $2,145 · $179/mo
- Expected delta
- +$489/yr (+$41/mo · 29.6%)
ⓘ Screening estimate from a state-policy table — verify with the county assessor before closing.
Climate risk First Street
- Flood 1/10 Low FEMA zone X (shaded) · 0% chance over 30 yrs
- Wildfire 5/10 Major
- Heat 8/10 Severe 6 d/yr ≥111°F today · 14 d/yr by 30 yrs out
- Wind 1/10 Low
- Air quality 2/10 Low 0 unhealthy d/yr today · 1 by 30 yrs out
Nearby sold comps map
Loading sold comps map…
Walkable amenities ~0.75 mi
Loading nearby amenities…
Taxation est. · year 1
- Rental income
- $32,077
- − Mortgage interest
- −$18,205
- − Property taxes
- −$1,656
- − Insurance
- −$1,625
- − Repairs & maintenance
- −$2,566
- − Management
- −$2,566
- − HOA
- −$1,500
- − Depreciation
- −$9,455
- Taxable loss
- −$5,496
- Est. tax savings @ 24.0%
- +$1,319
- After-tax cash flow
- $1,427/yr
For passive investors: Depreciation is non-cash, so a rental often shows a tax loss while cash-flowing — sheltering income. Rental losses are passive: they offset passive income freely, and up to $25,000/yr can offset ordinary (W-2) income if you actively participate and your MAGI is under $100k (phasing out to $0 by $150k); unused losses carry forward. On sale, claimed depreciation is recaptured at up to 25%, and gains may owe capital-gains tax (a 1031 exchange can defer both). Figures are a year-1 estimate at your 24.0% rate — not tax advice; consult a CPA.
Schools (NCES district)
- District
- Wickenburg Unified District (4236)
- NCES district ID
- 0409190
- Math proficiency
- 33% ▼ -10.00%
- Reading proficiency
- 35% ▼ -7.00%
- Median HH income
- $47,369
- Composite
- 29.27/100
- National rank
- #6560
- State rank
- #92 of 249 in AZ
Livability — Buckeye
- Score
- 68/100
- State rank
- #53
- US rank
- #9428
Category grades
Schools grade is shown separately in the Schools card above.
Census & demographics
- Census place
- Buckeye, AZ
- County
- Maricopa County · 4,537,380 people
- City population
- 117,540
- Metro
- Phoenix-Mesa-Chandler, AZ
- Population (ZIP)
- 42,181
- Household income
- $114,056
- Rent vs Own
- Severe rent burden
- 156.0
Population outlook (Maricopa County) Hauer SSP2
- Today (2025)
- 4,979,203 people
- By 2030
- 5,378,229 · +8.0%
- By 2040
- 6,156,598 · +23.6%
- By 2050
- 6,872,376 · +38.0%
- By 2075
- 8,401,270 · +68.7%
- By 2100
- 9,247,439 · +85.7%
Race, ethnicity, and origin ACS 2023
- Neighborhood character
- Diverse neighborhood (Simpson 0.56)
- Race & ethnicity
- White 59% Hispanic / Latino 31% Two or more races 18% Black 4% Asian 2% Native American 1%
- Hispanic origin (detail)
- Mexican 25%
- Common ancestry
- Slovak 4% Portuguese 2% Italian 2%
- Foreign-born
- 8% · Canada, Vietnam
- Languages at home
- 85% English-only · Spanish 12% German/W. Germanic 1% Other Indo-European 1%
Political lean MEDSL · Maricopa
- 2024 margin
- Toss-up / Even · D 47.7% · R 51.2% · Other 1.1%
- 2008→2024 swing
- +7.1pp toward D · 2008: -10.6pp · 2024: -3.5pp
- All cycles
- 2024: R+3.5 2020: D+2.2 2016: R+3.5 2012: R+12.0 2008: R+10.6
Not yet ingested
- Civics
- —
Market trends
- HPI YoY
- ▼ -56.97%
- Current HPI
- 246.4705
- Rent YoY
- ▲ 3.41%
- Metro
- Phoenix-Mesa-Chandler, AZ
- State GDP YoY
- ▲ 4.54%
- F500 in state
- 20
Industry mix (Fortune 500 HQ in AZ)
| Industry | F500 HQs | Revenue |
|---|---|---|
| Technology | 2 | $13B |
|
||
| Mining / Metals | 1 | $23B |
|
||
| Environmental Services | 1 | $16B |
|
||
| Metals / Steel | 1 | $14B |
|
||
| Technology Distribution | 1 | $9B |
|
||
| Homebuilding | 1 | $8B |
|
||
Price history
1 event — show timeline
- 2026-05-26 Listed $325,000 ARMLS
Property tax history
+1.9%/yrLatest (2025): $1,656 · +1.6% YoY. Source: county tax records.
Cash-flow waterfall
monthlySold comps — $/sqft
last 12 mo · ≤1 miLoading sold comps…