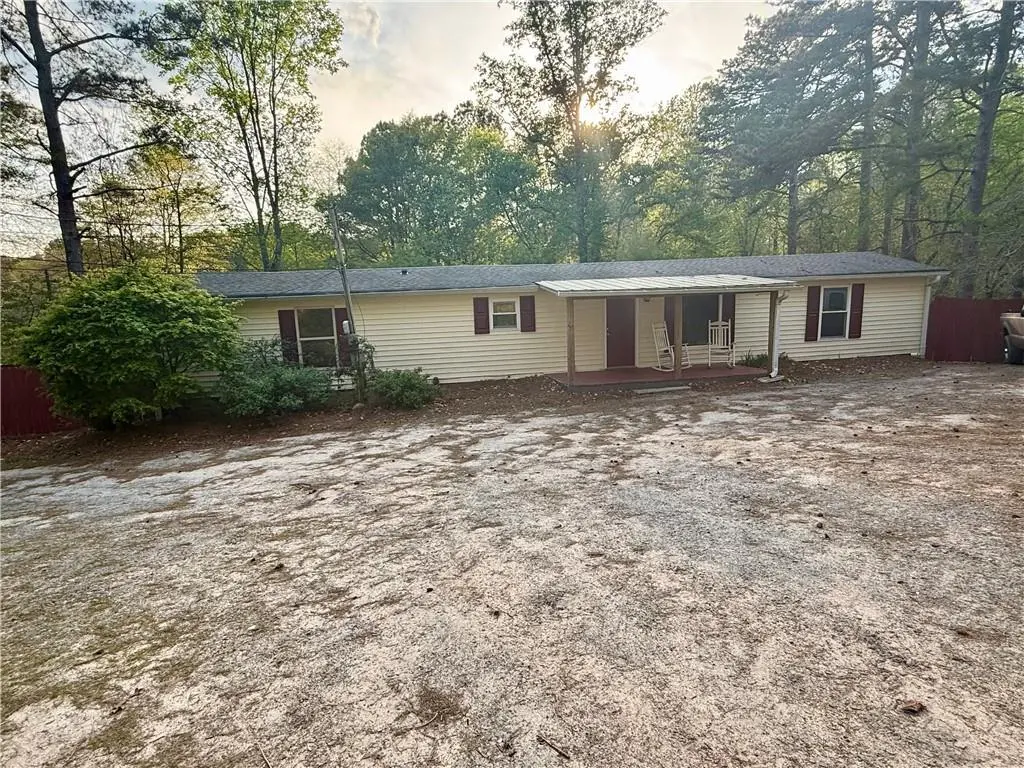
134 Delay St · Woodstock, GA
Flood risk 1/10 · Minimal
- FEMA flood zone
- X (unshaded)
- Chance of flooding over 30 yrs
- 0.0%
- Est. flood insurance / yr
- $507 – $1,088
Fire risk 3/10 · Minor
- Est. fire insurance / yr
- $963 – $1,789
Heat risk 5/10 · Moderate
- Hot days now (above 103°F)
- 7 days/yr
- Hot days in 30 yrs
- 17 days/yr
Wind risk 4/10 · Minor
- Chance of severe wind over 30 yrs
- 16.0%
Air-quality risk 4/10 · Minor
- Unhealthy air days now
- 6 days/yr
- Unhealthy air days in 30 yrs
- 7 days/yr
Risk factors via First Street. Map © Google.
Why this score? — see what drove the D- grade
The composite is a weighted blend of 9 inputs, each scored 0–100. Each bar is that input's sub-score; the figure is the points it added to the 100-point composite (weight × sub-score).
- ARV discount +15.0/15.0
- Cash flow +7.7/30.0
- Schools +4.2/10.0
- Livability +3.7/5.0
- Rent growth +2.8/5.0
- Condition / age +2.5/5.0
- 1% rule +2.3/10.0
- DSCR +1.8/10.0
- Appreciation +0.0/10.0
$230,000
🖨 Deal sheet (PDF) 📄 Offer letter ✓ Due diligence
Listing remarks MLS
Cash only. Mobile home where title is in the real estate. Rental potential in this 3 bedroom ranch. Great location near schools, shopping and I-575 interstate. 3 ton heat pump installed 2016. New electric panel in 2013. Commercial 50 gallon hot water heater installed 2025.
Key facts
- 0.45 acre lot
- Garage
- Pool
Tags
Neighborhood map
What this means for you Summary
Snapshot
- This is a 2-bed/1.0-bath single-family listed at $230k.
Deal economics
- At list price, monthly cash flow is $-266 ($-3k/yr) — negative.
- To cash-flow at today's rent, offer at most $192k (16.7% below list).
- To meet the 1% rule (rent ≥ 1% of price), the offer needs to be $168k (27.2% below list).
- Recommended offer: $168k (27.2% below list) — sets the bar for 1% rule.
- Cap rate 4.9% vs local median 3.3% in Woodstock — top-decile yield for the area; either an underpriced asset or a hidden risk that comps aren't pricing in. Stress-test before assuming the spread holds.
Location & tenants
- Location reads 73/100 on livability (#46 in GA) — a middle-class / working-renter tenant base. Strengths: crime A+, employment A+, housing A+; Watch: amenities F, commute F, health & safety F.
- Cherokee County (suburban): math 46% / reading 48% proficiency, ranked #17 of 174 in GA (top 10%) — families likely to look elsewhere, expect single-tenant / working-renter base with shorter leases.
- Market conditions: Rents rising (+1.1%/yr); 274 active listings in the ZIP; 9 comparable units currently listed for rent nearby; rentals leasing fast (median 0d on market — plan ~1-2 weeks tenant-placement turnaround); high-income renter base; 2,665 units permitted in Cherokee County in 2024 (852 in 5+ unit buildings).
- This rent is only 18% of the median local income ($114k/yr) — well below the 30% rent-burden line; pricing power to push rent on renewal without tenant pushback.
Forward outlook
- Local home prices are declining (-3.0%/yr); year-one equity from $2k of loan paydown is wiped out by about $7k of value loss. Plan a longer hold.
- Cherokee County population projected at +34% by 2050 — long-run rental-demand tailwind backs the buy-and-hold thesis.
Negotiation context
- It's been on market 80 days — a 6% lower offer ($216k) is reasonable based on typical stale-listing flexibility.
- 2 sale attempts; this cycle's ask has dropped $20k (8%) from the opening price — seller is motivated, your offer sets the floor, not the list.
Risks & watch-outs
- Climate carrying-cost: extreme-heat days projected 7→17/yr by 2055 (HVAC capex compounding) — expect insurance premiums to compound above CPI over the hold.
Questions for the listing agent
- What do current leases actually rent for vs. the listed asking? Can we see a recent rent roll and the last 12 months of T-12 income?
- It's been on market 80 days. Have you received any prior offers? Is the seller open to a 27% concession, seller financing, or rate buy-down credit?
- Why hasn't it sold? Are there any deal-killer items the seller is aware of (foundation, flood, title, zoning, code violations)?
- Is there a deadline driving the sale (1031 exchange, divorce, estate, relocation)? That informs how much negotiation room exists.
- Schools are B-rated — typically a magnet for longer-tenancy family renters. What's the average tenant stay here, and is there a school-zone premium baked into asking?
- The area grade is low — what's the realistic commute time and amenity access for the typical tenant pool here? Any planned neighborhood developments (good or bad) we should know about?
- What's the average days-on-market for RENTAL listings here right now (not sales)? A rising rental-DOM trend means longer vacancies and softer asking-rent achievability than the comps imply.
- What's the recent tenant-quality profile in this submarket — average credit score on applications, eviction rate, late-payment / NSF rate, and stable-employment percentage? A property-management company in the area should have these aggregated.
- How much new for-sale + rental construction is in the pipeline within 1–3 miles? Heavy new supply typically softens prices + rents 12–24 months out; constrained supply supports both.
Investment metrics
- 1% rule
- 0.73% ✗
- Cap rate
- 4.90%
- Cash-on-cash
- -4.96%
- DSCR
- 0.78
- GRM
- 11.4
CMA / ARV
- ARV (median comp)
- $334,484
- List price
- $230,000
- Delta
- -31.24%
- Verdict
- UNDERPRICED
- Comps
- 20 within 1.0 mi
Show comp detail 1 sale within ~0.75 mi
| Address | Dist | Beds/Ba | Sqft | Sold | Price | $/sf | Match |
|---|---|---|---|---|---|---|---|
| 150 Delay St | 0.10mi | 3/1.0 (+1) | 888 (-2%) | 8mo | $275,000 | $310 | 80 |
Match score weights: distance 35% · size 25% · config 20% · recency 20%. Top-matched comps best support the ARV.
Projected returns pro-forma
-3.0% appreciation · 1.14% rent growth · sell at horizon
- IRR
- -26.8%
- Equity multiple
- 0.11×
- Total profit
- $-57,266
- Equity at exit
- $34,294
- IRR
- -32.1%
- Equity multiple
- -0.30×
- Total profit
- $-83,749
- Equity at exit
- $19,886
Cash invested: $64,400 (down + closing). Projections, not guarantees.
Landlord ↔ Tenant lean methodology
- Overall (STATE)
- 90 Strongly Landlord-Friendly
- State Georgia
- 90 Strongly Landlord-Friendly · R+3
- County
- — inherits STATE
- City
- — inherits STATE
ZIP-level market 30189
- Rents YoY
- 1.1%
- Active inventory
- 274
- Price-to-rent
- 11.4×
Monthly cashflow live
- Estimated rent
- $1,675 high interval (Pro) →
- Mortgage (P&I)
- −$1,206
- Tax est. 1.5%
- −$288 /mo · $3,450/yr
- Insurance
- −$96
- HOA
- −$0
- Vacancy / Maint / Mgmt
- −$352
- Net cashflow
- $-266
Break-even live
Sensitivity live
| Price | -10% $-107 | -5% $-187 | +0% $-266 | +5% $-345 | +10% $-425 |
|---|---|---|---|---|---|
| Rent | -10% $-398 | -5% $-332 | +0% $-266 | +5% $-200 | +10% $-134 |
| Rate | -1.0pp $-150 | -0.5pp $-208 | base $-266 | +0.5pp $-326 | +1.0pp $-386 |
UW: 25.0% down · 7.5% · 30yr · 1.5% tax · 5.0% vac · 8.0% maint · 8.0% mgmt
Financing live
Cash to close
- Down payment
- $57,500
- Closing costs
- $6,900
- Reserves months
- —
- Total cash needed
- —
Loan-product check · same deal, 3 products live
Conventional
25% down · 7.5% · 30yr
- Down + closing
- —
- Monthly P&I
- —
- Monthly cashflow
- —
- DSCR
- —
- Eligible?
- —
Personal DTI + credit; lowest rate.
DSCR
20% down · 8.5% · 30yr
- Down + closing
- —
- Monthly P&I
- —
- Monthly cashflow
- —
- DSCR
- —
- Eligible?
- —
No personal income docs; deal must DSCR.
Hard money
10% down · 12.0% · 12mo
- Down + closing
- —
- Monthly P&I
- —
- Monthly cashflow
- —
- DSCR
- —
- Eligible?
- —
Short-term bridge; refi at stabilization.
Rent comps 9 comps
| Address | Beds | Baths | Sqft | Rent | $/sqft | DOM | Units | Dist |
|---|---|---|---|---|---|---|---|---|
| 5920 Bells Ferry Rd Acworth, GA | 1.0–3.0 | 1.0–2.0 | 1162 | $1,550 | $1.33 | 0d | 7 | 0.72mi |
| 2055 Township Dr Woodstock, GA | 2.0 | 1.0 | 866 | $1,150 | $1.33 | 25d | 1 | 0.81mi |
| 100 Peaks Rdg Acworth, GA | 1.0–3.0 | 1.0–2.0 | 1131 | $1,736 | $1.53 | 0d | 21 | 0.89mi |
| 1000 Etowah Ferry Dr Acworth, GA | 1.0–3.0 | 1.0–3.0 | 1136 | $2,138 | $1.88 | 0d | 30 | 0.90mi |
| 900 Buice Lake Pkwy Acworth, GA | 1.0–3.0 | 1.0–2.0 | 1054 | $1,884 | $1.79 | 0d | 33 | 1.00mi |
| 466 Gregory Ln Acworth, GA | 2.0 | 2.0 | 976 | $1,340 | $1.37 | 0d | 5 | 1.07mi |
| 1345 Towne Lake Hills South Dr Woodstock, GA | 1.0–3.0 | 1.0–2.0 | 1057 | $1,621 | $1.53 | 0d | 36 | 1.33mi |
| 850 Cherrydale Ln Unit 1 Woodstock, GA | 1.0 | 1.0 | 700 | $1,400 | $2.00 | 44d | 1 | 1.39mi |
| 900 View Dr Woodstock, GA | 1.0–3.0 | 1.0–2.0 | 1156 | $1,995 | $1.73 | 0d | 12 | 1.41mi |
Listing history 18 events
-
2026-06-21days on market $230,000 Active 80 DOM
-
2026-06-18days on market $230,000 Active 77 DOM
-
2026-06-17days on market $230,000 Active 76 DOM
-
2026-06-16days on market $230,000 Active 75 DOM
-
2026-06-15days on market $230,000 Active 74 DOM
-
2026-06-13days on market $230,000 Active 72 DOM
-
2026-06-09days on market $230,000 Active 68 DOM
-
2026-06-08days on market $230,000 Active 67 DOM
-
2026-06-07statusdays on market $230,000 Active 66 DOM
-
2026-06-04days on market $230,000 Active Under Contract 63 DOM
-
2026-06-03days on market $230,000 Active Under Contract 62 DOM
-
2026-06-02statusdays on market $230,000 Active Under Contract 61 DOM
-
2026-06-01days on market $230,000 Active 60 DOM
-
2026-05-31days on market $230,000 Active 59 DOM
-
2026-04-13price $230,000 273-char remark
Show marketing remark (273 chars)
Cash only. Mobile home where title is in the real estate. Rental potential in this 3 bedroom ranch. Great location near schools, shopping and I-575 interstate. 3 ton heat pump installed 2016. New electric panel in 2013. Commercial 50 gallon hot water heater installed 2025.
-
2026-04-02$250,000 New 273-char remark
Show marketing remark (273 chars)
Cash only. Mobile home where title is in the real estate. Rental potential in this 3 bedroom ranch. Great location near schools, shopping and I-575 interstate. 3 ton heat pump installed 2016. New electric panel in 2013. Commercial 50 gallon hot water heater installed 2025.
-
2026-04-02$250,000 Active 273-char remark
Show marketing remark (273 chars)
Cash only. Mobile home where title is in the real estate. Rental potential in this 3 bedroom ranch. Great location near schools, shopping and I-575 interstate. 3 ton heat pump installed 2016. New electric panel in 2013. Commercial 50 gallon hot water heater installed 2025.
ⓘ Source: listings_history table (triggers on properties + properties_extension) + one-shot
backfill from property_details.listing_events for pre-trigger history.
Climate risk First Street
- Flood 1/10 Low FEMA zone X (unshaded) · 0% chance over 30 yrs
- Wildfire 3/10 Moderate
- Heat 5/10 Major 7 d/yr ≥103°F today · 17 d/yr by 30 yrs out
- Wind 4/10 Moderate 16% chance of damaging wind over 30 yrs
- Air quality 4/10 Moderate 6 unhealthy d/yr today · 7 by 30 yrs out
Nearby sold comps map
Loading sold comps map…
Walkable amenities ~0.75 mi
Loading nearby amenities…
Taxation est. · year 1
- Rental income
- $20,103
- − Mortgage interest
- −$12,884
- − Property taxes
- −$3,450
- − Insurance
- −$1,150
- − Repairs & maintenance
- −$1,608
- − Management
- −$1,608
- − Depreciation
- −$6,691
- Taxable loss
- −$7,288
- Est. tax savings @ 24.0%
- +$1,749
- After-tax cash flow
- $-1,443/yr
For passive investors: Depreciation is non-cash, so a rental often shows a tax loss while cash-flowing — sheltering income. Rental losses are passive: they offset passive income freely, and up to $25,000/yr can offset ordinary (W-2) income if you actively participate and your MAGI is under $100k (phasing out to $0 by $150k); unused losses carry forward. On sale, claimed depreciation is recaptured at up to 25%, and gains may owe capital-gains tax (a 1031 exchange can defer both). Figures are a year-1 estimate at your 24.0% rate — not tax advice; consult a CPA.
Schools (NCES district)
- District
- Cherokee County
- NCES district ID
- 1301110
- Math proficiency
- 46% ▼ -11.00%
- Reading proficiency
- 48% ▼ -8.00%
- Median HH income
- $69,295
- Composite
- 42.14/100
- National rank
- #3304
- State rank
- #17 of 174 in GA
Livability — Woodstock
- Score
- 73/100
- State rank
- #46
- US rank
- #5116
Category grades
Schools grade is shown separately in the Schools card above.
Census & demographics
- County
- Cherokee County · 289,977 people
- City population
- 109,446
- Metro
- Atlanta-Sandy Springs-Alpharetta, GA
- Population (ZIP)
- 39,928
- Household income
- $114,130
- Rent vs Own
- Severe rent burden
- 953.0
Population outlook (Cherokee County) Hauer SSP2
- Today (2025)
- 281,923 people
- By 2030
- 303,845 · +7.8%
- By 2040
- 344,738 · +22.3%
- By 2050
- 379,010 · +34.4%
- By 2075
- 449,617 · +59.5%
- By 2100
- 484,103 · +71.7%
Race, ethnicity, and origin ACS 2023
- Neighborhood character
- Predominantly White (73%)
- Race & ethnicity
- White 73% Hispanic / Latino 14% Two or more races 10% Black 8% Asian 1%
- Hispanic origin (detail)
- Mexican 6% Puerto Rican 1%
- Common ancestry
- Italian 3% Slovak 2% Romanian 2%
- Foreign-born
- 13% · Canada, Jamaica
- Languages at home
- 85% English-only · Spanish 10% Other Indo-European 1% French/Haitian/Cajun 1%
Political lean MEDSL · Cherokee
- 2024 margin
- Solid R (+39.0) · D 30.1% · R 69.1%
- 2008→2024 swing
- +12.1pp toward D · 2008: -51.1pp · 2024: -39.0pp
- All cycles
- 2024: R+39.0 2020: R+39.2 2016: R+50.0 2012: R+57.8 2008: R+51.1
Not yet ingested
- Civics
- —
Market trends
- HPI YoY
- ▼ -247.82%
- Current HPI
- 249.6793
- Rent YoY
- ▲ 1.14%
- Metro
- Atlanta-Sandy Springs-Alpharetta, GA
- State GDP YoY
- ▲ 2.66%
- F500 in state
- 28
Industry mix (Fortune 500 HQ in GA)
| Industry | F500 HQs | Revenue |
|---|---|---|
| Paper / Packaging | 2 | $29B |
|
||
| Retail | 1 | $160B |
|
||
| Transportation / Logistics | 1 | $91B |
|
||
| Airlines | 1 | $62B |
|
||
| Consumer Goods | 1 | $47B |
|
||
| Utilities | 1 | $25B |
|
||
Price history
-8.0% since first listed4 events — show timeline
- 2026-04-13 Price Changed $230,000 GAMLS
- 2026-04-13 Price Changed $230,000 FMLS
- 2026-04-02 Listed $250,000 FMLS
- 2026-04-02 Listed $250,000 GAMLS
Property tax history
+3.6%/yrLatest (2025): $400 · +13.1% YoY. Source: county tax records.
Cash-flow waterfall
monthlySold comps — $/sqft
last 12 mo · ≤1 miLoading sold comps…