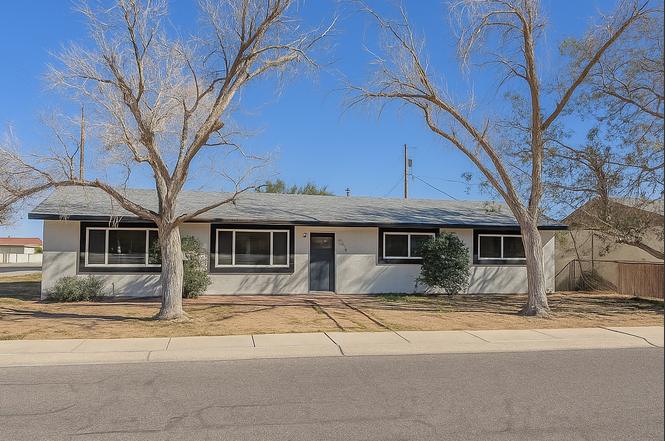
3746 N Wells St · Kingman, AZ
Flood risk 1/10 · Minimal
- FEMA flood zone
- X (shaded)
- Chance of flooding over 30 yrs
- 0.0%
- Est. flood insurance / yr
- $507 – $1,088
Fire risk 7/10 · Major
- Est. fire insurance / yr
- $610 – $1,132
Heat risk 6/10 · Moderate
- Hot days now (above 100°F)
- 8 days/yr
- Hot days in 30 yrs
- 20 days/yr
Wind risk 1/10 · Minimal
- Chance of severe wind over 30 yrs
- —
Air-quality risk 1/10 · Minimal
- Unhealthy air days now
- 0 days/yr
- Unhealthy air days in 30 yrs
- 0 days/yr
Risk factors via First Street. Map © Google.
Why this score? — see what drove the D+ grade
The composite is a weighted blend of 9 inputs, each scored 0–100. Each bar is that input's sub-score; the figure is the points it added to the 100-point composite (weight × sub-score).
- Cash flow +15.5/30.0
- ARV discount +15.0/15.0
- DSCR +4.8/10.0
- Livability +4.0/5.0
- 1% rule +3.0/10.0
- Rent growth +2.6/5.0
- Condition / age +2.5/5.0
- Schools +1.8/10.0
- Appreciation +0.0/10.0
$225,000
🖨 Deal sheet 📄 Offer letter ✓ Due diligence
Listing remarks MLS
Fully remodeled home on large 75x100 foot lot. New Windows, New AC heater unit. New Cabinets, Granite countertops. Vinyl and Carpet flooring. RV Parking. Centrally located.
Key facts
- Large corner lot
- Open layout
- Granite countertops
Tags
Neighborhood map
What this means for you Summary
Snapshot
- This is a 3-bed/2.0-bath single-family listed at $225k.
Deal economics
- At list price, monthly cash flow is $92 ($1k/yr) — positive.
- The deal already cash-flows at list — no discount required.
- To meet the 1% rule (rent ≥ 1% of price), the offer needs to be $179k (20.5% below list).
- Recommended offer: $179k (20.5% below list) — sets the bar for 1% rule.
- Cap rate 6.8% vs local median 3.6% in Kingman — top-decile yield for the area; either an underpriced asset or a hidden risk that comps aren't pricing in. Stress-test before assuming the spread holds.
Location & tenants
- Location reads 79/100 on livability (#5 in AZ, #2,014 nationally) — a middle-class / working-renter tenant base. Strengths: commute A+, cost of living A+, housing A+; Watch: crime C-, employment C-, schools D+.
- Kingman Unified School District (79598) (town): math 19% / reading 24% proficiency, ranked #179 of 249 in AZ (top 72%) — low school quality limits family demand, transient renter base, plan for 1-2y turnover.
- Market conditions: Rents flat; 643 active listings in the ZIP; 21 comparable units currently listed for rent nearby; rentals lingering (median 44d on market — plan ~5-8 weeks vacancy on turnover, expect pricing pressure); 62% of comp listings sitting > 30 days — soft ceiling on asking rent; 2,543 units permitted in Mohave County in 2024 (33 in 5+ unit buildings).
- This rent runs 42% of the median local income ($51k/yr) — at the standard rent-burdened threshold; future hikes will face affordability resistance.
Forward outlook
- Local home prices are declining (-3.0%/yr); year-one equity from $2k of loan paydown is wiped out by about $7k of value loss. Plan a longer hold.
- Mohave County population projected to shrink 6% by 2050 — rents likely to lag national; underwrite the cash flow, not the appreciation.
Negotiation context
- It's been on market 63 days — a 6% lower offer ($212k) is reasonable based on typical stale-listing flexibility.
- 4 sale attempts since 4y ago; this cycle's ask has dropped $25k (10%) from the opening price — seller is motivated, your offer sets the floor, not the list.
Risks & watch-outs
- Climate carrying-cost: major wildfire risk; extreme-heat days projected 8→20/yr by 2055 (HVAC capex compounding) — expect insurance premiums to compound above CPI over the hold.
Questions for the listing agent
- It's been on market 63 days. Have you received any prior offers? Is the seller open to a 20% concession, seller financing, or rate buy-down credit?
- Built in 1972 — when were the roof, HVAC, electrical panel, plumbing, and water heater last replaced?
- Why hasn't it sold? Are there any deal-killer items the seller is aware of (foundation, flood, title, zoning, code violations)?
- Is there a deadline driving the sale (1031 exchange, divorce, estate, relocation)? That informs how much negotiation room exists.
- Schools are D-rated, which usually means shorter tenancies and higher turnover. Who's the typical renter profile here, and what's been the actual vacancy rate?
- The area grade is low — what's the realistic commute time and amenity access for the typical tenant pool here? Any planned neighborhood developments (good or bad) we should know about?
- What's the average days-on-market for RENTAL listings here right now (not sales)? A rising rental-DOM trend means longer vacancies and softer asking-rent achievability than the comps imply.
- What's the recent tenant-quality profile in this submarket — average credit score on applications, eviction rate, late-payment / NSF rate, and stable-employment percentage? A property-management company in the area should have these aggregated.
- How much new for-sale + rental construction is in the pipeline within 1–3 miles? Heavy new supply typically softens prices + rents 12–24 months out; constrained supply supports both.
Investment metrics
- 1% rule
- 0.80% ✗
- Cap rate
- 6.78%
- Cash-on-cash
- 1.76%
- DSCR
- 1.08
- GRM
- 10.5
CMA / ARV
- ARV (on-the-fly)
- $306,525
- Comps found
- 12
Show comp detail 12 sales within ~0.75 mi
| Address | Dist | Beds/Ba | Sqft | Sold | Price | $/sf | Match |
|---|---|---|---|---|---|---|---|
| 3640 N Kenneth Rd | 0.28mi | 3/2.0 | 1,595 (+5%) | 2mo | $287,000 | $180 | 78 |
| 2078 Roy Rogers Way | 0.22mi | 3/2.0 | 1,420 (-7%) | 2mo | $310,000 | $218 | 77 |
| 3730 N Miller St | 0.29mi | 3/2.0 | 1,596 (+5%) | 2mo | $294,999 | $185 | 77 |
| 3953 Rex Allen Ct | 0.44mi | 3/2.0 | 1,440 (-6%) | 1mo | $318,000 | $221 | 70 |
| 2156 Alan Ladd Dr | 0.51mi | 3/2.0 | 1,472 (-4%) | 2mo | $329,000 | $224 | 69 |
| 2200 Alan Ladd Dr | 0.48mi | 3/2.0 | 1,593 (+4%) | 3mo | $344,000 | $216 | 68 |
| 3645 N Verdugo Rd | 0.20mi | 3/2.0 | 1,317 (-14%) | 0mo | $232,900 | $177 | 68 |
| 2085 Alan Ladd Dr | 0.54mi | 4/2.0 (+1) | 1,559 (+2%) | 0mo | $277,000 | $178 | 66 |
| 3615 N Verdugo Rd | 0.26mi | 3/2.0 | 1,323 (-13%) | 1mo | $247,500 | $187 | 65 |
| 3561 N Lomita St | 0.38mi | 3/2.0 | 1,341 (-12%) | 0mo | $280,000 | $209 | 62 |
| 3636 N Irving St | 0.40mi | 3/2.0 | 1,325 (-13%) | 2mo | $266,900 | $201 | 58 |
| 3632 N Irving St | 0.40mi | 3/2.0 | 1,325 (-13%) | 2mo | $266,900 | $201 | 58 |
Match score weights: distance 35% · size 25% · config 20% · recency 20%. Top-matched comps best support the ARV.
Projected returns pro-forma
-3.0% appreciation · 0.33% rent growth · sell at horizon
- IRR
- -16.2%
- Equity multiple
- 0.44×
- Total profit
- $-35,389
- Equity at exit
- $33,548
- IRR
- -12.6%
- Equity multiple
- 0.33×
- Total profit
- $-41,947
- Equity at exit
- $19,454
Cash invested: $63,000 (down + closing). Projections, not guarantees.
Landlord ↔ Tenant lean methodology
- Overall (STATE)
- 87 Strongly Landlord-Friendly
- State Arizona
- 87 Strongly Landlord-Friendly · R+3
- County
- — inherits STATE
- City
- — inherits STATE
ZIP-level market 86409
- Rents YoY
- 0.3%
- Active inventory
- 643
- Price-to-rent
- 10.5×
Monthly cashflow live
- Estimated rent
- $1,790 high interval (Pro) →
- Mortgage (P&I)
- −$1,180
- Tax from tax record
- −$48 /mo · $578/yr
- Insurance
- −$94
- HOA
- −$0
- Vacancy / Maint / Mgmt
- −$376
- Net cashflow
- $92
Break-even live
UW: 25.0% down · 7.5% · 30yr · 1.5% tax · 5.0% vac · 8.0% maint · 8.0% mgmt
Financing live
Cash to close
- Down payment
- $56,250
- Closing costs
- $6,750
- Reserves months
- —
- Total cash needed
- —
Loan-product check · same deal, 3 products live
Conventional
25% down · 7.5% · 30yr
- Down + closing
- —
- Monthly P&I
- —
- Monthly cashflow
- —
- DSCR
- —
- Eligible?
- —
Personal DTI + credit; lowest rate.
DSCR
20% down · 8.5% · 30yr
- Down + closing
- —
- Monthly P&I
- —
- Monthly cashflow
- —
- DSCR
- —
- Eligible?
- —
No personal income docs; deal must DSCR.
Hard money
10% down · 12.0% · 12mo
- Down + closing
- —
- Monthly P&I
- —
- Monthly cashflow
- —
- DSCR
- —
- Eligible?
- —
Short-term bridge; refi at stabilization.
Rent comps 21 comps
| Address | Beds | Baths | Sqft | Rent | $/sqft | DOM | Units | Dist |
|---|---|---|---|---|---|---|---|---|
| 3838 Heritage Ln Kingman, AZ | 2.0 | 2.0 | 1285 | $1,650 | $1.28 | 43d | 1 | 0.19mi |
| 3695 N Adams St Kingman, AZ | 3.0 | 2.0 | 1331 | $1,600 | $1.20 | 43d | 1 | 0.25mi |
| 3644 N Lomita St Kingman, AZ | 4.0 | 2.0 | 1717 | $1,700 | $0.99 | 43d | 1 | 0.26mi |
| 2244 Dollarhide Dr Kingman, AZ | 3.0 | 2.0 | 1628 | $1,948 | $1.20 | 13d | 1 | 0.29mi |
| 3595 N Skylark Rd Kingman, AZ | 3.0 | 2.0 | 1138 | $1,475 | $1.30 | 43d | 1 | 0.33mi |
| 2118 Gene Autry Dr Kingman, AZ | 3.0 | 2.0 | 1494 | $1,850 | $1.24 | 43d | 1 | 0.34mi |
| 3838 Meadowbrook Ln Kingman, AZ | 3.0 | 2.0 | 1602 | $1,800 | $1.12 | 21d | 1 | 0.35mi |
| 3631 N Miller St Kingman, AZ | 3.0 | 2.0 | 1593 | $2,450 | $1.54 | 21d | 1 | 0.36mi |
| 3571 N Moore St Kingman, AZ | 3.0 | 2.0 | 1288 | $2,450 | $1.90 | 43d | 1 | 0.36mi |
| 3953 Rex Allen Ct Kingman, AZ | 3.0 | 2.0 | 1440 | $1,750 | $1.22 | 13d | 1 | 0.43mi |
| 3736 N Roosevelt St Kingman, AZ | 3.0 | 2.0 | 1093 | $1,425 | $1.30 | 43d | 1 | 0.45mi |
| 3932 Lindsey Ave Kingman, AZ | 3.0 | 2.0 | 1335 | $1,500 | $1.12 | 43d | 1 | 0.84mi |
| 969 Shadow Crest Cir Kingman, AZ | 2.0 | 2.0 | 1239 | $1,450 | $1.17 | 43d | 1 | 1.14mi |
| 980 Astor Ave Unit 2 Kingman, AZ | 2.0 | 2.0 | 1100 | $1,350 | $1.23 | 13d | 1 | 1.24mi |
| 3423 N Fairfax St Kingman, AZ | 3.0 | 2.0 | 1397 | $1,700 | $1.22 | 13d | 1 | 1.25mi |
| 936 Astor Ave Unit 1 Kingman, AZ | 2.0 | 2.0 | 1100 | $1,400 | $1.27 | 43d | 1 | 1.27mi |
| 3418 Mulberry Ln Kingman, AZ | 3.0 | 2.0 | 1397 | $1,695 | $1.21 | 13d | 1 | 1.27mi |
| 924 Astor Ave Unit 2 Kingman, AZ | 2.0 | 2.0 | 1100 | $1,650 | $1.50 | 21d | 1 | 1.28mi |
| 733 Pala Mesa Dr Kingman, AZ | 3.0 | 2.0 | 1355 | $1,650 | $1.22 | 43d | 1 | 1.46mi |
| 915 E Berk Ave Kingman, AZ | 3.0 | 2.0 | 1175 | $1,495 | $1.27 | 43d | 1 | 1.46mi |
| 732 Vista Grande Dr Kingman, AZ | 3.0 | 2.0 | 1212 | $1,600 | $1.32 | 43d | 1 | 1.50mi |
Listing history 18 events
-
2026-03-23status Pending
-
2026-03-11status Active
-
2025-12-26status Pending
-
2025-12-26price $225,000
-
2025-12-26price $214,900
-
2025-12-18price $199,900
-
2025-12-16price $209,900
-
2025-12-11price $214,900
-
2025-12-06price $219,900
-
2025-12-01price $224,900
-
2025-11-25price $229,900
-
2025-11-20price $234,900
-
2025-11-15price $239,900
-
2025-11-05$249,900 Active
-
2025-09-13price $249,900
-
2025-05-13$254,900 Active
-
2022-04-08soldstatus $250,000 172-char remark
Show marketing remark (172 chars)
Fully remodeled home on large 75x100 foot lot. New Windows, New AC heater unit. New Cabinets, Granite countertops. Vinyl and Carpet flooring. RV Parking. Centrally located.
-
2022-03-07$249,900 172-char remark
Show marketing remark (172 chars)
Fully remodeled home on large 75x100 foot lot. New Windows, New AC heater unit. New Cabinets, Granite countertops. Vinyl and Carpet flooring. RV Parking. Centrally located.
ⓘ Source: listings_history table (triggers on properties + properties_extension) + one-shot
backfill from property_details.listing_events for pre-trigger history.
Tax reassessment forecast AZ · Resets to sale price
- Current annual tax
- $578 · $48/mo
- Projected year-2 tax
- $1,485 · $124/mo
- Expected delta
- +$907/yr (+$76/mo · 157.0%)
ⓘ Screening estimate from a state-policy table — verify with the county assessor before closing.
Climate risk First Street
- Flood 1/10 Low FEMA zone X (shaded) · 0% chance over 30 yrs
- Wildfire 7/10 Severe
- Heat 6/10 Major 8 d/yr ≥100°F today · 20 d/yr by 30 yrs out
- Wind 1/10 Low
- Air quality 1/10 Low 0 unhealthy d/yr today · 0 by 30 yrs out
Nearby sold comps map
Loading sold comps map…
Walkable amenities ~0.75 mi
Loading nearby amenities…
Taxation est. · year 1
- Rental income
- $21,478
- − Mortgage interest
- −$12,603
- − Property taxes
- −$578
- − Insurance
- −$1,125
- − Repairs & maintenance
- −$1,718
- − Management
- −$1,718
- − Depreciation
- −$6,545
- Taxable loss
- −$2,810
- Est. tax savings @ 24.0%
- +$674
- After-tax cash flow
- $1,780/yr
For passive investors: Depreciation is non-cash, so a rental often shows a tax loss while cash-flowing — sheltering income. Rental losses are passive: they offset passive income freely, and up to $25,000/yr can offset ordinary (W-2) income if you actively participate and your MAGI is under $100k (phasing out to $0 by $150k); unused losses carry forward. On sale, claimed depreciation is recaptured at up to 25%, and gains may owe capital-gains tax (a 1031 exchange can defer both). Figures are a year-1 estimate at your 24.0% rate — not tax advice; consult a CPA.
Schools (NCES district)
- District
- Kingman Unified School District (79598)
- NCES district ID
- 0400295
- Math proficiency
- 19% ▼ -11.00%
- Reading proficiency
- 24% ▼ -9.00%
- Median HH income
- $36,760
- Composite
- 17.87/100
- National rank
- #9002
- State rank
- #179 of 249 in AZ
Livability — Kingman
- Score
- 79/100
- State rank
- #5
- US rank
- #2014
Category grades
Schools grade is shown separately in the Schools card above.
Census & demographics
- Census place
- Kingman, AZ
- County
- Mohave County · 181,906 people
- City population
- 60,489
- Metro
- Lake Havasu City-Kingman, AZ
- Population (ZIP)
- 30,365
- Household income
- $50,852
- Rent vs Own
- Severe rent burden
- 688.0
Population outlook (Mohave County) Hauer SSP2
- Today (2025)
- 209,184 people
- By 2030
- 209,674 · +0.2%
- By 2040
- 205,897 · -1.6%
- By 2050
- 196,810 · -5.9%
- By 2075
- 169,454 · -19.0%
- By 2100
- 136,630 · -34.7%
Race, ethnicity, and origin ACS 2023
- Neighborhood character
- Predominantly White (76%)
- Race & ethnicity
- White 76% Hispanic / Latino 16% Two or more races 10% Native American 1%
- Hispanic origin (detail)
- Mexican 12%
- Common ancestry
- Lithuanian 3% Slovak 2% Portuguese 2%
- Foreign-born
- 6% · Canada
- Languages at home
- 92% English-only · Spanish 7%
Political lean MEDSL · Mohave
- 2024 margin
- Solid R (+55.8) · D 21.8% · R 77.6%
- 2008→2024 swing
- -22.9pp toward R · 2008: -32.9pp · 2024: -55.8pp
- All cycles
- 2024: R+55.8 2020: R+51.3 2016: R+51.5 2012: R+42.6 2008: R+32.9
Not yet ingested
- Civics
- —
Market trends
- HPI YoY
- ▼ -158.90%
- Current HPI
- 280.1884
- Rent YoY
- ▲ 0.33%
- Metro
- Lake Havasu City-Kingman, AZ
- State GDP YoY
- ▲ 4.54%
- F500 in state
- 20
Industry mix (Fortune 500 HQ in AZ)
| Industry | F500 HQs | Revenue |
|---|---|---|
| Technology | 2 | $13B |
|
||
| Mining / Metals | 1 | $23B |
|
||
| Environmental Services | 1 | $16B |
|
||
| Metals / Steel | 1 | $14B |
|
||
| Technology Distribution | 1 | $9B |
|
||
| Homebuilding | 1 | $8B |
|
||
Price history
-14.0% since first listed18 events — show timeline
- 2026-03-23 Pending — WARDEX
- 2026-03-11 Relisted — WARDEX
- 2025-12-26 Pending — WARDEX
- 2025-12-26 Price Changed $214,900 WARDEX
- 2025-12-26 Price Changed $225,000 WARDEX
- 2025-12-18 Price Changed $199,900 WARDEX
- 2025-12-16 Price Changed $209,900 WARDEX
- 2025-12-11 Price Changed $214,900 WARDEX
- 2025-12-06 Price Changed $219,900 WARDEX
- 2025-12-01 Price Changed $224,900 WARDEX
- 2025-11-25 Price Changed $229,900 WARDEX
- 2025-11-20 Price Changed $234,900 WARDEX
- 2025-11-15 Price Changed $239,900 WARDEX
- 2025-11-05 Listed $249,900 WARDEX
- 2025-09-13 Price Changed $249,900 WARDEX
- 2025-05-13 Listed $254,900 WARDEX
- 2022-04-08 Sold (MLS) $250,000 WARDEX
- 2022-03-07 Listed $249,900 WARDEX
Property tax history
+36.3%/yrLatest (2025): $578 · -0.2% YoY. Source: county tax records.
Cash-flow waterfall
monthlySold comps — $/sqft
last 12 mo · ≤1 miLoading sold comps…