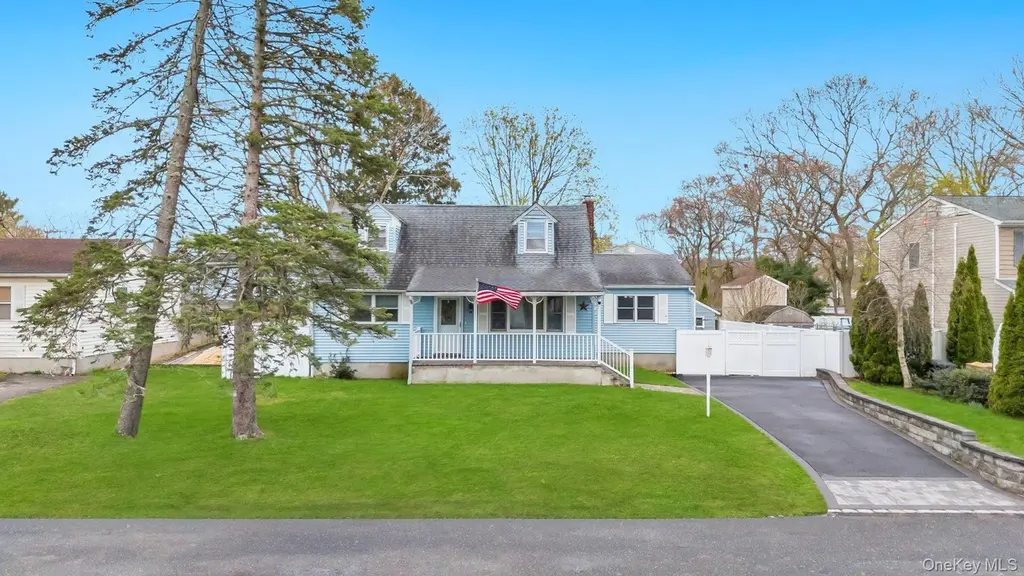
8 Lama Dr · Shirley, NY
Flood risk 1/10 · Minimal
- FEMA flood zone
- X (unshaded)
- Chance of flooding over 30 yrs
- 0.0%
- Est. flood insurance / yr
- $473 – $860
Fire risk 3/10 · Minor
- Est. fire insurance / yr
- $691 – $1,283
Heat risk 4/10 · Minor
- Hot days now (above 92°F)
- 7 days/yr
- Hot days in 30 yrs
- 19 days/yr
Wind risk 8/10 · Major
- Chance of severe wind over 30 yrs
- 80.0%
Air-quality risk 4/10 · Minor
- Unhealthy air days now
- 3 days/yr
- Unhealthy air days in 30 yrs
- 5 days/yr
Risk factors via First Street. Map © Google.
Why this score? — see what drove the C- grade
The composite is a weighted blend of 9 inputs, each scored 0–100. Each bar is that input's sub-score; the figure is the points it added to the 100-point composite (weight × sub-score).
- Cash flow +17.4/30.0
- ARV discount +13.0/15.0
- DSCR +5.4/10.0
- 1% rule +5.1/10.0
- Schools +4.7/10.0
- Livability +3.1/5.0
- Rent growth +2.5/5.0
- Condition / age +2.5/5.0
- Appreciation +0.0/10.0
$524,999
🖨 Deal sheet (PDF) 📄 Offer letter ✓ Due diligence
Listing remarks
Welcome to this inviting 4-bedroom, 2-bathroom expanded Cape, perfectly blending classic charm with modern conveniences. Situated in a desirable area, this home features a welcoming porch and lovely curb appeal with vinyl fencing. Step inside to discover hardwood floors and elegant oak trim throughout. The galley kitchen is efficiently designed, while the expanded living room and family room offer ample space for relaxation. This home boasts significant updates less than five years old, including roof, siding, boiler, and Andersen windows, providing peace of mind and energy efficiency for years to come. The partially finished basement offers plenty of storage space, and a convenient laundry
Key facts
- Oak trim
- Galley kitchen
- Expanded living room
Tags
Property features AI
Exterior
- Parking: Driveway
- Utilities: Cesspool sewer; Electricity connected; Public trash collection; Water connected
- Home design: Single-family residence; Property updated/remodeled
- Construction: Vinyl siding; Block foundation
- Exterior features: Vinyl fencing; Deck; Porch; Not waterfront
Interior
- Kitchen: Eat-in kitchen; Microwave; Oven; Refrigerator; Stainless steel appliances
- Bedrooms: Includes a first-floor bedroom
- Flooring: Hardwood floors; Tile floors
- Bathrooms: Two full bathrooms
- Heating & cooling: Oil heating; Wall/window air conditioning units
- Interior features: First-floor bedroom; First-floor full bathroom; Eat-in kitchen; Formal dining room; Natural woodwork; Storage space; Washer/dryer hookup; Partially finished basement; Has fireplace; Deck and porch
- Laundry & utility: Washer hookup; Electric dryer hookup; Washer and dryer included; Laundry located in basement
Neighborhood map
What this means for you Summary
Snapshot
- This is a 4-bed/2.0-bath single-family listed at $525k.
Deal economics
- At list price, monthly cash flow is $390 ($5k/yr) — positive.
- The deal already cash-flows at list — no discount required.
- Meets the 1% rule at list price ($5k rent vs $525k).
- Recommended offer: $517k (1.5% below list) — sets the bar for market timing.
- Cap rate 7.2% vs local median 4.8% in Shirley — top-decile yield for the area; either an underpriced asset or a hidden risk that comps aren't pricing in. Stress-test before assuming the spread holds.
Location & tenants
- Location reads 62/100 on livability (#886 in NY) — a middle-class / working-renter tenant base. Strengths: employment A+, housing A+; Watch: crime D+, amenities F, commute F.
- William Floyd Union Free School District (suburban): math 48% / reading 57% proficiency, ranked #309 of 590 in NY (top 52%) — acceptable for families but not a draw, mixed tenant base, ~2y average lease.
- Zoned schools: Nathaniel Woodhull Elementary School (math 45% / reading 50%, grade D, #1,191 of 2,108 statewide, top 57%, 703 students, 54% FRL); William Paca Middle School (math 31% / reading 37%, grade F, #497 of 729 statewide, top 69%, 1,009 students, 59% FRL); William Floyd High School (math 65% / reading 87%, grade A-, #616 of 1,100 statewide, top 57%, 3,013 students, 54% FRL).
- Market conditions: 185 active listings in the ZIP; 2 comparable units currently listed for rent nearby; 1,366 units permitted in Suffolk County in 2024 (216 in 5+ unit buildings).
Forward outlook
- Local home prices are declining (-3.0%/yr); year-one equity from $4k of loan paydown is wiped out by about $16k of value loss. Plan a longer hold.
- Suffolk County population projected to shrink 5% by 2050 — rents likely to lag national; underwrite the cash flow, not the appreciation.
Negotiation context
- It's been on market 17 days — a 2% lower offer ($517k) is reasonable based on typical stale-listing flexibility.
- Current owner paid $316k; list at $525k implies a 66% gain — meaningful room to come down on a strong offer.
Risks & watch-outs
- Watch-outs: built in 1957 — expect roof / HVAC / electrical / plumbing capex.
- Climate carrying-cost: severe wind risk, 80% chance of damaging wind over 30y — expect insurance premiums to compound above CPI over the hold.
Questions for the listing agent
- Built in 1957 — when were the roof, HVAC, electrical panel, plumbing, and water heater last replaced?
- Is there a deadline driving the sale (1031 exchange, divorce, estate, relocation)? That informs how much negotiation room exists.
- Schools are F-rated, which usually means shorter tenancies and higher turnover. Who's the typical renter profile here, and what's been the actual vacancy rate?
- Crime grade is D in this area — have there been break-ins, vandalism, or insurance claims at this property in the last 3 years? What carrier currently insures it and at what premium?
- What's the average days-on-market for RENTAL listings here right now (not sales)? A rising rental-DOM trend means longer vacancies and softer asking-rent achievability than the comps imply.
- What's the recent tenant-quality profile in this submarket — average credit score on applications, eviction rate, late-payment / NSF rate, and stable-employment percentage? A property-management company in the area should have these aggregated.
- How much new for-sale + rental construction is in the pipeline within 1–3 miles? Heavy new supply typically softens prices + rents 12–24 months out; constrained supply supports both.
Investment metrics
- 1% rule
- 1.01% ✓
- Cap rate
- 7.19%
- Cash-on-cash
- 3.19%
- DSCR
- 1.14
- GRM
- 8.3
CMA / ARV
- ARV (median comp)
- $598,557
- List price
- $524,999
- Delta
- -12.29%
- Verdict
- UNDERPRICED
- Comps
- 20 within 1.0 mi
Show comp detail 12 sales within ~0.75 mi
| Address | Dist | Beds/Ba | Sqft | Sold | Price | $/sf | Match |
|---|---|---|---|---|---|---|---|
| 7 Tipton Dr W | 0.19mi | 3/1.5 (-1) | 1,808 (+2%) | 0mo | $620,000 | $343 | 81 |
| 41 Lama Dr | 0.26mi | 3/2.0 (-1) | 1,798 (+1%) | 1mo | $630,000 | $350 | 80 |
| 34 Propose Rd | 0.22mi | 5/2.0 (+1) | 1,728 (-3%) | 2mo | $550,000 | $318 | 79 |
| 32 Rockledge Dr | 0.45mi | 3/2.0 (-1) | 1,736 (-2%) | 3mo | $520,000 | $300 | 68 |
| 15 Loughlin Dr | 0.08mi | 3/1.5 (-1) | 1,518 (-14%) | 0mo | $625,000 | $412 | 65 |
| 33 Breston Dr W | 0.33mi | 4/2.0 | 1,600 (-10%) | 6mo | $589,000 | $368 | 63 |
| 16 Flintlock Dr | 0.32mi | 3/2.0 (-1) | 1,593 (-10%) | 5mo | $535,000 | $336 | 59 |
| 36 Maple Ln | 0.25mi | 3/2.0 (-1) | 1,510 (-15%) | 2mo | $600,000 | $397 | 57 |
| 55 Lama Dr | 0.36mi | 4/2.5 | 1,998 (+13%) | 8mo | $615,000 | $308 | 54 |
| 39 Appel Dr E | 0.71mi | 3/2.0 (-1) | 1,950 (+10%) | 0mo | $665,000 | $341 | 45 |
| 18 Windus Dr | 0.53mi | 5/3.0 (+1) | 1,990 (+12%) | 2mo | $537,000 | $270 | 44 |
| 70 Breston Dr E | 0.62mi | 4/3.0 | 2,041 (+15%) | 0mo | $628,000 | $308 | 42 |
Match score weights: distance 35% · size 25% · config 20% · recency 20%. Top-matched comps best support the ARV.
Projected returns pro-forma
-3.0% appreciation · 3.0% rent growth · sell at horizon
- IRR
- -11.2%
- Equity multiple
- 0.59×
- Total profit
- $-60,029
- Equity at exit
- $78,279
- IRR
- -2.0%
- Equity multiple
- 0.87×
- Total profit
- $-19,543
- Equity at exit
- $45,392
Cash invested: $147,000 (down + closing). Projections, not guarantees.
Landlord ↔ Tenant lean methodology
- Overall (STATE)
- 15 Strongly Tenant-Friendly
- State New York
- 15 Strongly Tenant-Friendly · D+10
- County
- — inherits STATE
- City
- — inherits STATE
ZIP-level market 11967
- Home prices YoY
- -33.1%
- Active inventory
- 185
- Price-to-rent
- 8.3×
Monthly cashflow live
- Estimated rent
- $5,280 medium interval (Pro) →
- Mortgage (P&I)
- −$2,753
- Tax from tax record
- −$809 /mo · $9,705/yr
- Insurance
- −$219
- HOA
- −$0
- Vacancy / Maint / Mgmt
- −$1,109
- Net cashflow
- $390
Break-even live
Sensitivity live
| Price | -10% $688 | -5% $539 | +0% $390 | +5% $242 | +10% $93 |
|---|---|---|---|---|---|
| Rent | -10% $-27 | -5% $182 | +0% $390 | +5% $599 | +10% $808 |
| Rate | -1.0pp $655 | -0.5pp $524 | base $390 | +0.5pp $254 | +1.0pp $116 |
UW: 25.0% down · 7.5% · 30yr · 1.5% tax · 5.0% vac · 8.0% maint · 8.0% mgmt
Financing live
Cash to close
- Down payment
- $131,250
- Closing costs
- $15,750
- Reserves months
- —
- Total cash needed
- —
Loan-product check · same deal, 3 products live
Conventional
25% down · 7.5% · 30yr
- Down + closing
- —
- Monthly P&I
- —
- Monthly cashflow
- —
- DSCR
- —
- Eligible?
- —
Personal DTI + credit; lowest rate.
DSCR
20% down · 8.5% · 30yr
- Down + closing
- —
- Monthly P&I
- —
- Monthly cashflow
- —
- DSCR
- —
- Eligible?
- —
No personal income docs; deal must DSCR.
Hard money
10% down · 12.0% · 12mo
- Down + closing
- —
- Monthly P&I
- —
- Monthly cashflow
- —
- DSCR
- —
- Eligible?
- —
Short-term bridge; refi at stabilization.
Rent comps 2 comps
| Address | Beds | Baths | Sqft | Rent | $/sqft | DOM | Units | Dist |
|---|---|---|---|---|---|---|---|---|
| 357 Smith Rd Shirley, NY | 3.0 | 2.0 | 2000 | $6,500 | $3.25 | 3d | 1 | 1.15mi |
| 126 Flower Rd Shirley, NY | 4.0 | 1.0 | 1756 | $4,100 | $2.33 | 0d | 1 | 1.24mi |
Listing history 4 events
-
2026-05-14status Pending 959-char remark
-
2026-03-10$524,999 Active 959-char remark
-
2005-10-21soldstatus $315,990
-
2005-10-21soldstatus $315,990
ⓘ Source: listings_history table (triggers on properties + properties_extension) + one-shot
backfill from property_details.listing_events for pre-trigger history.
Tax reassessment forecast NY · Partial reset (capped growth)
- Current annual tax
- $9,705 · $809/mo
- Projected year-2 tax
- $9,705 · $809/mo
- Expected delta
- $0/yr ($0/mo · 0.0%)
ⓘ Screening estimate from a state-policy table — verify with the county assessor before closing.
Climate risk First Street
- Flood 1/10 Low FEMA zone X (unshaded) · 0% chance over 30 yrs
- Wildfire 3/10 Moderate
- Heat 4/10 Moderate 7 d/yr ≥92°F today · 19 d/yr by 30 yrs out
- Wind 8/10 Severe 80% chance of damaging wind over 30 yrs
- Air quality 4/10 Moderate 3 unhealthy d/yr today · 5 by 30 yrs out
Nearby sold comps map
Loading sold comps map…
Walkable amenities ~0.75 mi
Loading nearby amenities…
Taxation est. · year 1
- Rental income
- $63,360
- − Mortgage interest
- −$29,408
- − Property taxes
- −$9,705
- − Insurance
- −$2,625
- − Repairs & maintenance
- −$5,069
- − Management
- −$5,069
- − Depreciation
- −$15,273
- Taxable loss
- −$3,789
- Est. tax savings @ 24.0%
- +$909
- After-tax cash flow
- $5,595/yr
For passive investors: Depreciation is non-cash, so a rental often shows a tax loss while cash-flowing — sheltering income. Rental losses are passive: they offset passive income freely, and up to $25,000/yr can offset ordinary (W-2) income if you actively participate and your MAGI is under $100k (phasing out to $0 by $150k); unused losses carry forward. On sale, claimed depreciation is recaptured at up to 25%, and gains may owe capital-gains tax (a 1031 exchange can defer both). Figures are a year-1 estimate at your 24.0% rate — not tax advice; consult a CPA.
Schools (NCES district)
- District
- William Floyd Union Free School District
- NCES district ID
- 3618690
- Math proficiency
- 48% ▲ 3.00%
- Reading proficiency
- 57% ▲ 11.00%
- Median HH income
- $70,564
- Composite
- 46.79/100
- National rank
- #2383
- State rank
- #309 of 590 in NY
Livability — Shirley
- Score
- 62/100
- State rank
- #886
- US rank
- #17184
Category grades
Schools grade is shown separately in the Schools card above.
Census & demographics
- Census place
- Shirley, NY
- City population
- 27,266
- Population (ZIP)
- 27,266
Population outlook (Suffolk County) Hauer SSP2
- Today (2025)
- 1,505,262 people
- By 2030
- 1,498,318 · -0.5%
- By 2040
- 1,471,101 · -2.3%
- By 2050
- 1,424,848 · -5.3%
- By 2075
- 1,337,157 · -11.2%
- By 2100
- 1,217,720 · -19.1%
Race, ethnicity, and origin ACS 2023
- Neighborhood character
- Diverse neighborhood (Simpson 0.57)
- Race & ethnicity
- White 59% Hispanic / Latino 25% Black 9% Two or more races 8% Asian 4%
- Hispanic origin (detail)
- Puerto Rican 10% Dominican 2%
- Common ancestry
- Romanian 3% Lithuanian 2% Scotch-Irish 1%
- Foreign-born
- 12% · Canada, China, Jamaica
- Languages at home
- 76% English-only · Spanish 17% Other Indo-European 4% Chinese 1%
Political lean MEDSL · Suffolk
- 2024 margin
- Lean R (+10.0) · D 45.0% · R 55.0%
- 2008→2024 swing
- -16.0pp toward R · 2008: 6.0pp · 2024: -10.0pp
- All cycles
- 2024: R+10.0 2020: R+0.0 2016: R+8.2 2012: D+2.9 2008: D+6.0
Not yet ingested
- Civics
- —
Market trends
- HPI YoY
- ▼ -212.21%
- Current HPI
- 428.8362
- Rent YoY
- —
- Metro
- —
- State GDP YoY
- ▲ 2.60%
- F500 in state
- 92
Industry mix (Fortune 500 HQ in NY)
| Industry | F500 HQs | Revenue |
|---|---|---|
| Financial Services | 10 | $950B |
|
||
| Consumer Goods | 9 | $162B |
|
||
| Insurance | 4 | $225B |
|
||
| Telecommunications | 2 | $144B |
|
||
| Pharmaceuticals | 2 | $112B |
|
||
| Media / Entertainment | 2 | $69B |
|
||
Price history
+66.1% since first listed4 events — show timeline
- 2026-05-14 Pending — OneKey® MLS as Distributed by MLS Grid
- 2026-03-10 Listed $524,999 OneKey® MLS as Distributed by MLS Grid
- 2005-10-21 Sold (Public Records) $315,990 Public Records
- 2005-10-21 Sold (Public Records) $315,990 Public Records
Property tax history
+1.4%/yrLatest (2025): $9,705 · +0.0% YoY. Source: county tax records.
Cash-flow waterfall
monthlySold comps — $/sqft
last 12 mo · ≤1 miLoading sold comps…