140 Weeks Ave · Goose Creek, SC
Flood risk 6/10 · Moderate
- FEMA flood zone
- X (unshaded)
- Chance of flooding over 30 yrs
- 0.74%
- Est. flood insurance / yr
- $507 – $1,088
Fire risk 3/10 · Minor
- Est. fire insurance / yr
- $783 – $1,453
Heat risk 9/10 · Severe
- Hot days now (above 107°F)
- 7 days/yr
- Hot days in 30 yrs
- 17 days/yr
Wind risk 8/10 · Major
- Chance of severe wind over 30 yrs
- 99.0%
Air-quality risk 2/10 · Minimal
- Unhealthy air days now
- 2 days/yr
- Unhealthy air days in 30 yrs
- 2 days/yr
Risk factors via First Street. Map © Google.
Why this score? — see what drove the D+ grade
The composite is a weighted blend of 9 inputs, each scored 0–100. Each bar is that input's sub-score; the figure is the points it added to the 100-point composite (weight × sub-score).
- ARV discount +15.0/15.0
- Cash flow +14.2/30.0
- DSCR +4.3/10.0
- Rent growth +3.6/5.0
- Schools +3.6/10.0
- Livability +3.4/5.0
- 1% rule +3.3/10.0
- Condition / age +2.5/5.0
- Appreciation +0.0/10.0
$250,000
🖨 Deal sheet (PDF) 📄 Offer letter ✓ Due diligence
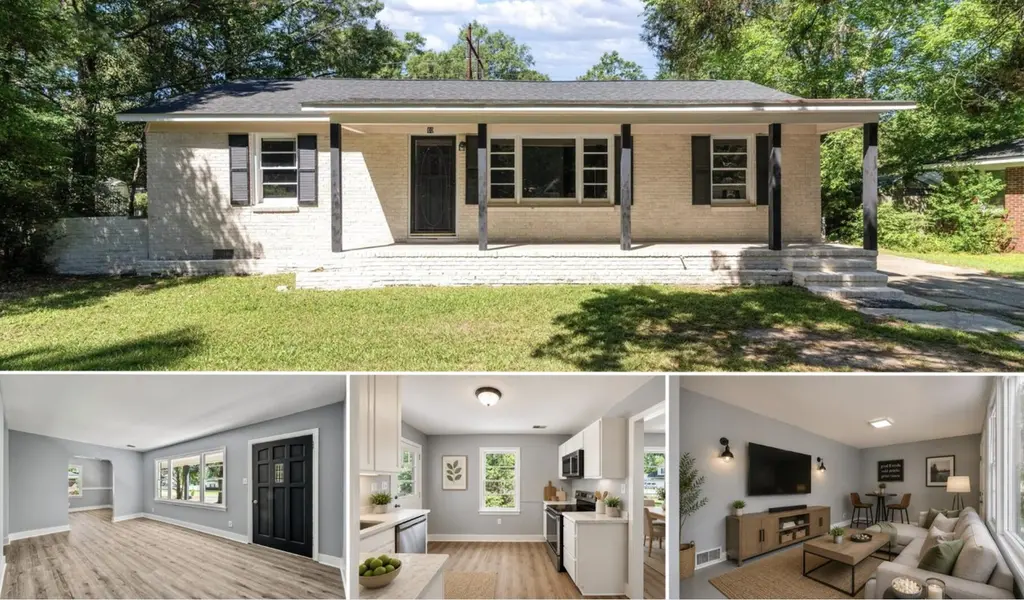
Listing remarks
Welcome to 140 Weeks Avenue, a fully renovated home in established Goose Creek offering stylish updates, flexible living space, and move-in-ready convenience. From the moment you arrive, you'll notice the fresh curb appeal and inviting charm that make this property feel like home. Inside, the home features beautifully updated flooring, fresh neutral paint, and abundant natural light throughout. The spacious living room creates a warm and comfortable gathering space, while the separate dining area is perfect for hosting dinners, entertaining guests, or everyday family living. The renovated kitchen showcases modern finishes, updated cabinetry, sleek countertops, and stainless steel appliances
Key facts
- Spacious yard
- Fully renovated home
- Renovated kitchen
Tags
Property features AI
Finance
- HOA & community: No association fee
Exterior
- Parking: Off-street parking
- Utilities: Public sewer
- Home design: Single-family detached home; One story; Ground-level entry
- Construction: Architectural asphalt roof
- Exterior features: Chain link fencing; Interior, level lot (0–0.5 acre); Shed(s) and storage
Interior
- Bedrooms: 3 bedrooms; Primary bedroom on lower level
- Flooring: Carpet; Luxury vinyl
- Bathrooms: 1 bathroom
- Heating & cooling: Central air conditioning
- Interior features: Smooth ceilings; Bonus room; Formal living room; Game room; Separate dining room
- Laundry & utility: Dedicated laundry room
Neighborhood map
What this means for you Summary
Snapshot
- This is a 3-bed/1.0-bath single-family listed at $250k.
Deal economics
- At list price, monthly cash flow is $41 ($496/yr) — positive.
- The deal already cash-flows at list — no discount required.
- To meet the 1% rule (rent ≥ 1% of price), the offer needs to be $208k (16.8% below list).
- Recommended offer: $208k (16.8% below list) — sets the bar for 1% rule.
- Cap rate 6.5% vs local median 4.0% in Goose Creek — top-decile yield for the area; either an underpriced asset or a hidden risk that comps aren't pricing in. Stress-test before assuming the spread holds.
Location & tenants
- Location reads 67/100 on livability (#103 in SC) — a middle-class / working-renter tenant base. Strengths: housing A+, employment A, cost of living B+; Watch: amenities F, commute F, health & safety F.
- Berkeley 01 (suburban): math 35% / reading 48% proficiency, ranked #30 of 80 in SC (top 38%) — families likely to look elsewhere, expect single-tenant / working-renter base with shorter leases.
- Zoned schools: Goose Creek Elementary (math 12% / reading 21%, grade F, #535 of 597 statewide, top 90%, 945 students, 100% FRL); Sedgefield Middle (math 13% / reading 26%, grade F, #182 of 229 statewide, top 80%, 986 students, 100% FRL); Goose Creek High (math 33% / reading 68%, grade D+, #150 of 196 statewide, top 76%, 1,981 students, 52% FRL) — zoned schools average 84% FRL vs 48% district-wide (36 pts higher); higher-poverty schools than district average — tighter screening recommended.
- Zoned-school proficiency averages 29% at this address vs 42% district-wide (-13 pts) — the specific schools serving this property underperform the Berkeley 01 average; the district grade overstates school quality for this exact location.
- Market conditions: Rents rising fast (+4.5%/yr); 266 active listings in the ZIP; 22 comparable units currently listed for rent nearby; rentals at typical pace (median 23d on market — plan ~3-4 weeks tenant-placement turnaround); solid renter incomes; 3,183 units permitted in Berkeley County in 2024 (580 in 5+ unit buildings).
Forward outlook
- Local home prices are declining (-3.0%/yr); year-one equity from $2k of loan paydown is wiped out by about $8k of value loss. Plan a longer hold.
- Berkeley County population projected at +48% by 2050 — long-run rental-demand tailwind backs the buy-and-hold thesis.
Negotiation context
- It's been on market 26 days — a 2% lower offer ($246k) is reasonable based on typical stale-listing flexibility.
- 5 sale attempts with the ask held roughly flat each time — persistent listings suggest the price (not the market) is what's stuck; bring a comps-based counter.
- Current owner paid $34k; list at $250k implies a 635% gain — meaningful room to come down on a strong offer.
Risks & watch-outs
- Watch-outs: built in 1956 — expect roof / HVAC / electrical / plumbing capex.
- Climate carrying-cost: major flood risk; severe wind risk, 99% chance of damaging wind over 30y; extreme-heat days projected 7→17/yr by 2055 (HVAC capex compounding) — expect insurance premiums to compound above CPI over the hold.
Questions for the listing agent
- Built in 1956 — when were the roof, HVAC, electrical panel, plumbing, and water heater last replaced?
- Is there a deadline driving the sale (1031 exchange, divorce, estate, relocation)? That informs how much negotiation room exists.
- The area grade is low — what's the realistic commute time and amenity access for the typical tenant pool here? Any planned neighborhood developments (good or bad) we should know about?
- What's the average days-on-market for RENTAL listings here right now (not sales)? A rising rental-DOM trend means longer vacancies and softer asking-rent achievability than the comps imply.
- What's the recent tenant-quality profile in this submarket — average credit score on applications, eviction rate, late-payment / NSF rate, and stable-employment percentage? A property-management company in the area should have these aggregated.
- How much new for-sale + rental construction is in the pipeline within 1–3 miles? Heavy new supply typically softens prices + rents 12–24 months out; constrained supply supports both.
Investment metrics
- 1% rule
- 0.83% ✗
- Cap rate
- 6.49%
- Cash-on-cash
- 0.71%
- DSCR
- 1.03
- GRM
- 10.0
CMA / ARV
- ARV (on-the-fly)
- $349,370
- Comps found
- 12
Show comp detail 12 sales within ~0.75 mi
| Address | Dist | Beds/Ba | Sqft | Sold | Price | $/sf | Match |
|---|---|---|---|---|---|---|---|
| 36 Guerry Cir | 0.25mi | 3/2.0 | 1,500 (-1%) | 10mo | $257,000 | $171 | 74 |
| 38 Guerry Cir | 0.23mi | 3/1.0 | 1,344 (-12%) | 2mo | $275,000 | $205 | 68 |
| 105 River Hill Rd | 0.40mi | 3/2.5 | 1,518 (-0%) | 13mo | $356,900 | $235 | 65 |
| 107 River Hill Rd | 0.40mi | 3/2.5 | 1,518 (-0%) | 13mo | $356,900 | $235 | 64 |
| 131 Harvey Ave | 0.07mi | 3/3.0 | 1,300 (-14%) | 1mo | $299,000 | $230 | 64 |
| 138 Cannon Ave | 0.21mi | 3/2.0 | 1,300 (-14%) | 6mo | $257,770 | $198 | 58 |
| 104 River Hill Rd | 0.40mi | 4/2.0 (+1) | 1,482 (-2%) | 13mo | $368,900 | $249 | 57 |
| 301 Morrison Dr | 0.71mi | 3/1.5 | 1,485 (-2%) | 5mo | $385,000 | $259 | 57 |
| 109 Old Creek Ct | 0.35mi | 3/2.5 | 1,709 (+12%) | 1mo | $389,000 | $228 | 56 |
| 109 Lyle Rd | 0.59mi | 4/2.0 (+1) | 1,485 (-2%) | 4mo | $320,000 | $215 | 56 |
| 429 Rubyridge Ln | 0.72mi | 3/1.0 | 1,372 (-10%) | 7mo | $175,000 | $128 | 44 |
| 337 Price St | 0.26mi | 4/3.0 (+1) | 1,302 (-14%) | 11mo | $350,000 | $269 | 42 |
Match score weights: distance 35% · size 25% · config 20% · recency 20%. Top-matched comps best support the ARV.
Projected returns pro-forma
-3.0% appreciation · 4.52% rent growth · sell at horizon
- IRR
- -13.6%
- Equity multiple
- 0.50×
- Total profit
- $-34,699
- Equity at exit
- $37,276
- IRR
- -2.7%
- Equity multiple
- 0.81×
- Total profit
- $-13,352
- Equity at exit
- $21,615
Cash invested: $70,000 (down + closing). Projections, not guarantees.
Landlord ↔ Tenant lean methodology
- Overall (STATE)
- 90 Strongly Landlord-Friendly
- State South Carolina
- 90 Strongly Landlord-Friendly · R+6
- County
- — inherits STATE
- City
- — inherits STATE
ZIP-level market 29445
- Home prices YoY
- -18.0%
- Rents YoY
- 4.5%
- Active inventory
- 266
- Price-to-rent
- 10.0×
Monthly cashflow live
- Estimated rent
- $2,079 high interval (Pro) →
- Mortgage (P&I)
- −$1,311
- Tax from tax record
- −$186 /mo · $2,235/yr
- Insurance
- −$104
- HOA
- −$0
- Vacancy / Maint / Mgmt
- −$437
- Net cashflow
- $41
Break-even live
Sensitivity live
| Price | -10% $183 | -5% $112 | +0% $41 | +5% $-29 | +10% $-100 |
|---|---|---|---|---|---|
| Rent | -10% $-123 | -5% $-41 | +0% $41 | +5% $123 | +10% $206 |
| Rate | -1.0pp $167 | -0.5pp $105 | base $41 | +0.5pp $-23 | +1.0pp $-89 |
UW: 25.0% down · 7.5% · 30yr · 1.5% tax · 5.0% vac · 8.0% maint · 8.0% mgmt
Financing live
Cash to close
- Down payment
- $62,500
- Closing costs
- $7,500
- Reserves months
- —
- Total cash needed
- —
Loan-product check · same deal, 3 products live
Conventional
25% down · 7.5% · 30yr
- Down + closing
- —
- Monthly P&I
- —
- Monthly cashflow
- —
- DSCR
- —
- Eligible?
- —
Personal DTI + credit; lowest rate.
DSCR
20% down · 8.5% · 30yr
- Down + closing
- —
- Monthly P&I
- —
- Monthly cashflow
- —
- DSCR
- —
- Eligible?
- —
No personal income docs; deal must DSCR.
Hard money
10% down · 12.0% · 12mo
- Down + closing
- —
- Monthly P&I
- —
- Monthly cashflow
- —
- DSCR
- —
- Eligible?
- —
Short-term bridge; refi at stabilization.
Rent comps 22 comps
| Address | Beds | Baths | Sqft | Rent | $/sqft | DOM | Units | Dist |
|---|---|---|---|---|---|---|---|---|
| 114 Old Back River Rd Goose Creek, SC | 4.0 | 2.0 | 1300 | $2,400 | $1.85 | 25d | 1 | 0.37mi |
| 601 Old State Rd Goose Creek, SC | 3.0 | 2.0 | 1370 | $1,750 | $1.28 | 16d | 1 | 0.46mi |
| 601 Old State Rd Goose Creek, SC | 2.0 | 2.0 | 1217 | $1,550 | $1.27 | 5d | 1 | 0.46mi |
| 601 Old State Rd Goose Creek, SC | 2.0 | 2.0 | 1217 | $1,750 | $1.44 | 25d | 1 | 0.46mi |
| 467 Truman Dr Goose Creek, SC | 4.0 | 3.5 | 1421 | $2,200 | $1.55 | 5d | 1 | 0.55mi |
| 484 Truman Dr Goose Creek, SC | 3.0 | 2.5 | 1320 | $1,950 | $1.48 | 5d | 1 | 0.58mi |
| 205 Jackson St Goose Creek, SC | 2.0 | 2.5 | 1468 | $1,850 | $1.26 | 25d | 1 | 0.65mi |
| 230 Buchanan Cir Goose Creek, SC | 3.0 | 2.5 | 1512 | $1,900 | $1.26 | 5d | 1 | 0.76mi |
| 139 Rosedale Ave Goose Creek, SC | 3.0 | 2.0 | 1829 | $2,206 | $1.21 | 5d | 1 | 0.99mi |
| 169 Pine Shadow Dr Goose Creek, SC | 3.0 | 2.5 | 1200 | $1,800 | $1.50 | 25d | 1 | 1.12mi |
| 3019 Woodington Pl Goose Creek, SC | 4.0 | 2.5 | 1804 | $2,350 | $1.30 | 5d | 1 | 1.17mi |
| 112 Rachel St Goose Creek, SC | 3.0 | 2.0 | 1973 | $1,800 | $0.91 | 13d | 1 | 1.17mi |
| 112 Rachel St Goose Creek, SC | 3.0 | 2.0 | 1973 | $1,800 | $0.91 | 5d | 1 | 1.17mi |
| 2168 Spoleto Ln E North Charleston, SC | 3.0 | 2.0 | 1300 | $1,900 | $1.46 | 25d | 1 | 1.28mi |
| 138 Thistle Rd Goose Creek, SC | 3.0 | 2.5 | 1617 | $2,095 | $1.30 | 23d | 1 | 1.28mi |
| 222 Maypop Dr Goose Creek, SC | 3.0 | 2.5 | 1320 | $1,950 | $1.48 | 25d | 1 | 1.32mi |
| 285 Brookshire Rd Goose Creek, SC | 3.0 | 3.0 | 1450 | $1,900 | $1.31 | 23d | 1 | 1.37mi |
| 285 Brookshire Rd Goose Creek, SC | 3.0 | 3.0 | 1450 | $1,900 | $1.31 | 25d | 1 | 1.37mi |
| 203 Brookshire Rd Goose Creek, SC | 3.0 | 3.0 | 1550 | $2,500 | $1.61 | 16d | 1 | 1.38mi |
| 1841 Sundancer Ln Goose Creek, SC | 3.0 | 2.0 | 1204 | $2,200 | $1.83 | 25d | 1 | 1.41mi |
| 147 Pinewind Way Goose Creek, SC | 2.0–3.0 | 2.0–2.5 | 1336 | $2,345 | $1.76 | 13d | 1 | 1.44mi |
| 163 Woodward Rd Goose Creek, SC | 3.0 | 3.0 | 1475 | $2,300 | $1.56 | 25d | 1 | 1.45mi |
Listing history 27 events
-
2026-06-17status $250,000 Pending 26 DOM
-
2026-06-16days on market $250,000 Active 26 DOM
-
2026-06-15days on market $250,000 Active 25 DOM
-
2026-06-13days on market $250,000 Active 23 DOM
-
2026-06-13days on market $250,000 Active 22 DOM
-
2026-06-10days on market $250,000 Active 20 DOM
-
2026-06-09days on market $250,000 Active 19 DOM
-
2026-06-08days on market $250,000 Active 18 DOM
-
2026-06-07days on market $250,000 Active 17 DOM
-
2026-06-05days on market $250,000 Active 14 DOM
-
2026-06-03days on market $250,000 Active 13 DOM
-
2026-06-03days on market $250,000 Active 12 DOM
-
2026-06-01days on market $250,000 Active 11 DOM
-
2026-05-31days on market $250,000 Active 10 DOM
-
2026-05-21$250,000 Active
-
2026-05-11historical
-
2026-03-23historical Active Under Contract
-
2026-03-10status Active
-
2026-03-06historical Active Under Contract
-
2026-01-09status Active
-
2025-12-29historical Active Under Contract
-
2025-12-16price $260,000
-
2025-11-18status Active
-
2025-11-12historical Active Under Contract
-
2025-10-08price $270,000
-
2025-09-26$280,000 Active
-
1978-04-27soldstatus $34,000
ⓘ Source: listings_history table (triggers on properties + properties_extension) + one-shot
backfill from property_details.listing_events for pre-trigger history.
Tax reassessment forecast SC · Resets to sale price
- Current annual tax
- $2,235 · $186/mo
- Projected year-2 tax
- $2,235 · $186/mo
- Expected delta
- $0/yr ($0/mo · 0.0%)
ⓘ Screening estimate from a state-policy table — verify with the county assessor before closing.
Climate risk First Street
- Flood 6/10 Major FEMA zone X (unshaded) · 74% chance over 30 yrs
- Wildfire 3/10 Moderate
- Heat 9/10 Extreme 7 d/yr ≥107°F today · 17 d/yr by 30 yrs out
- Wind 8/10 Severe 99% chance of damaging wind over 30 yrs
- Air quality 2/10 Low 2 unhealthy d/yr today · 2 by 30 yrs out
Nearby sold comps map
Loading sold comps map…
Walkable amenities ~0.75 mi
Loading nearby amenities…
Taxation est. · year 1
- Rental income
- $24,952
- − Mortgage interest
- −$14,004
- − Property taxes
- −$2,235
- − Insurance
- −$1,250
- − Repairs & maintenance
- −$1,996
- − Management
- −$1,996
- − Depreciation
- −$7,273
- Taxable loss
- −$3,801
- Est. tax savings @ 24.0%
- +$912
- After-tax cash flow
- $1,408/yr
For passive investors: Depreciation is non-cash, so a rental often shows a tax loss while cash-flowing — sheltering income. Rental losses are passive: they offset passive income freely, and up to $25,000/yr can offset ordinary (W-2) income if you actively participate and your MAGI is under $100k (phasing out to $0 by $150k); unused losses carry forward. On sale, claimed depreciation is recaptured at up to 25%, and gains may owe capital-gains tax (a 1031 exchange can defer both). Figures are a year-1 estimate at your 24.0% rate — not tax advice; consult a CPA.
Schools (NCES district)
- District
- Berkeley 01
- NCES district ID
- 4501170
- Math proficiency
- 35% ▼ -8.00%
- Reading proficiency
- 48% ▼ -2.00%
- Median HH income
- $52,724
- Composite
- 35.95/100
- National rank
- #4799
- State rank
- #30 of 80 in SC
Livability — Goose Creek
- Score
- 67/100
- State rank
- #103
- US rank
- #10912
Category grades
Schools grade is shown separately in the Schools card above.
Census & demographics
- County
- Berkeley County · 198,768 people
- City population
- 59,227
- Metro
- Charleston-North Charleston, SC
- Population (ZIP)
- 59,227
- Household income
- $81,594
- Rent vs Own
- Severe rent burden
- 1308.0
Population outlook (Berkeley County) Hauer SSP2
- Today (2025)
- 254,184 people
- By 2030
- 279,677 · +10.0%
- By 2040
- 329,379 · +29.6%
- By 2050
- 375,557 · +47.8%
- By 2075
- 476,740 · +87.6%
- By 2100
- 535,945 · +110.8%
Race, ethnicity, and origin ACS 2023
- Neighborhood character
- Diverse neighborhood (Simpson 0.63)
- Race & ethnicity
- White 55% Black 23% Hispanic / Latino 11% Two or more races 9% Asian 3%
- Hispanic origin (detail)
- Mexican 4% Puerto Rican 3%
- Common ancestry
- Slovak 2% Lithuanian 2% Italian 1%
- Foreign-born
- 9% · Canada, Jamaica, Vietnam
- Languages at home
- 86% English-only · Spanish 8% Other Indo-European 2% Tagalog/Filipino 2%
Political lean MEDSL · Berkeley
- 2024 margin
- R (+16.3) · D 41.1% · R 57.4% · Other 1.4%
- 2008→2024 swing
- -3.2pp toward R · 2008: -13.1pp · 2024: -16.3pp
- All cycles
- 2024: R+16.3 2020: R+11.7 2016: R+17.4 2012: R+18.9 2008: R+13.1
Not yet ingested
- Civics
- —
Market trends
- HPI YoY
- ▼ -66.40%
- Current HPI
- 301.8653
- Rent YoY
- ▲ 4.52%
- Metro
- Charleston-North Charleston, SC
- State GDP YoY
- ▲ 4.51%
- F500 in state
- 2
Industry mix (Fortune 500 HQ in SC)
| Industry | F500 HQs | Revenue |
|---|---|---|
| Packaging | 1 | $7B |
|
||
Price history
+635.3% since first listed13 events — show timeline
- 2026-05-21 Listed $250,000 Charleston Trident MLS
- 2026-05-11 Listing Removed — Charleston Trident MLS
- 2026-03-23 Contingent — Charleston Trident MLS
- 2026-03-10 Relisted — Charleston Trident MLS
- 2026-03-06 Contingent — Charleston Trident MLS
- 2026-01-09 Relisted — Charleston Trident MLS
- 2025-12-29 Contingent — Charleston Trident MLS
- 2025-12-16 Price Changed $260,000 Charleston Trident MLS
- 2025-11-18 Relisted — Charleston Trident MLS
- 2025-11-12 Contingent — Charleston Trident MLS
- 2025-10-08 Price Changed $270,000 Charleston Trident MLS
- 2025-09-26 Listed $280,000 Charleston Trident MLS
- 1978-04-27 Sold (Public Records) $34,000 Public Records
Property tax history
+2.2%/yrLatest (2025): $2,235 · +1.7% YoY. Source: county tax records.
Cash-flow waterfall
monthlySold comps — $/sqft
last 12 mo · ≤1 miLoading sold comps…