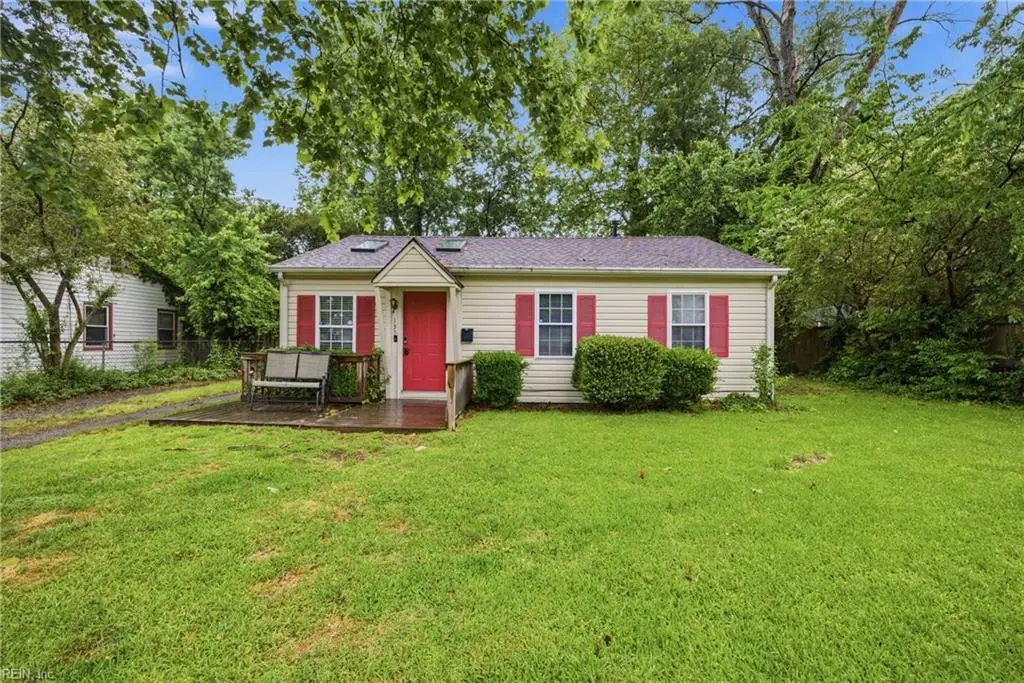
135 Peachtree Ln · Hampton, VA
Flood risk 5/10 · Moderate
- FEMA flood zone
- X (unshaded)
- Chance of flooding over 30 yrs
- 0.41%
- Est. flood insurance / yr
- $507 – $1,088
Fire risk 1/10 · Minimal
- Est. fire insurance / yr
- $666 – $1,236
Heat risk 9/10 · Severe
- Hot days now (above 104°F)
- 7 days/yr
- Hot days in 30 yrs
- 16 days/yr
Wind risk 8/10 · Major
- Chance of severe wind over 30 yrs
- 80.0%
Air-quality risk 2/10 · Minimal
- Unhealthy air days now
- 1 days/yr
- Unhealthy air days in 30 yrs
- 2 days/yr
Risk factors via First Street. Map © Google.
Why this score? — see what drove the D- grade
The composite is a weighted blend of 9 inputs, each scored 0–100. Each bar is that input's sub-score; the figure is the points it added to the 100-point composite (weight × sub-score).
- Cash flow +10.8/30.0
- ARV discount +7.7/15.0
- Schools +5.5/10.0
- Rent growth +3.9/5.0
- Livability +3.8/5.0
- DSCR +3.1/10.0
- 1% rule +2.6/10.0
- Condition / age +2.5/5.0
- Appreciation +0.0/10.0
$220,000
🖨 Deal sheet 📄 Offer letter ✓ Due diligence
Listing remarks
Charming 2-bedroom, 1-bath home featuring updated kitchen with granite countertops and stainless steel appliances. All 3 TV's in the home and 1 on the back patio to convey. Perfect property for a new family or first time homebuyer. Conveniently located near major interstates and military bases, offering easy access for commuting, shopping, and dining.
Key facts
- Updated kitchen
- Granite countertops
- Built 1953
Tags
Property features AI
Finance
- HOA & community: No HOA fees indicated
Exterior
- Parking: Driveway parking spaces; Street parking
- Utilities: City/County water; City/County sewer; Gas water heater; Electric power (implied)
- Home design: Detached ranch; Single-story home with one living level; Crawl space foundation
- Construction: Vinyl exterior; Asphalt shingle roof; Crawl space foundation
- Exterior features: Vinyl siding; Asphalt shingle roof
Interior
- Kitchen: Range; Refrigerator; Dishwasher
- Bedrooms: Master bedroom; Additional bedroom; Bedroom and full bathroom on the first floor
- Flooring: Vinyl flooring; Wood flooring
- Bathrooms: 1 full bathroom
- Heating & cooling: Heat pump heating; Central air conditioning
- Interior features: Vinyl and wood flooring; Bedroom and full bathroom on the first floor; 6 total rooms (living room, great room, dining room, family room, kitchen, utility room)
- Laundry & utility: Washer hookup; Dryer hookup; Utility room
Neighborhood map
What this means for you Summary
Snapshot
- This is a 3-bed/1.0-bath single-family listed at $220k.
Deal economics
- At list price, monthly cash flow is $-99 ($-1k/yr) — negative.
- To cash-flow at today's rent, offer at most $202k (8.0% below list).
- To meet the 1% rule (rent ≥ 1% of price), the offer needs to be $168k (23.6% below list).
- Recommended offer: $168k (23.6% below list) — sets the bar for 1% rule.
- Cap rate 5.8% vs local median 4.5% in Hampton — meaningfully above typical; check what's discounted (condition, days-on-market, listing class) to confirm the premium yield is real.
Location & tenants
- Location reads 75/100 on livability (#133 in VA, #4,302 nationally) — a middle-class / working-renter tenant base. Strengths: housing A+, health & safety A+, cost of living A; Watch: crime C-, amenities D+, commute F.
- Hampton City Public School District (urban): math 60% / reading 70% proficiency, ranked #40 of 131 in VA (top 30%) — acceptable for families but not a draw, mixed tenant base, ~2y average lease.
- Zoned schools: Barron Elementary (math 62% / reading 77%, grade A-, #313 of 1,108 statewide, top 32%, 368 students, 87% FRL); Kecoughtan High (math 68% / reading 87%, grade A-, #83 of 319 statewide, top 28%, 1,564 students, 86% FRL) — zoned schools average 86% FRL vs 49% district-wide (38 pts higher); higher-poverty schools than district average — tighter screening recommended.
- Market conditions: Rents rising fast (+5.4%/yr); 232 active listings in the ZIP; 19 comparable units currently listed for rent nearby; rentals at typical pace (median 15d on market — plan ~3-4 weeks tenant-placement turnaround); 68 units permitted in Hampton city in 2024 (0 in 5+ unit buildings).
Forward outlook
- Local home prices are declining (-3.0%/yr); year-one equity from $2k of loan paydown is wiped out by about $7k of value loss. Plan a longer hold.
- Hampton County population projected at -13% by 2050 — secular population decline; favor cash flow + early exit over multi-decade hold.
Negotiation context
- It's been on market 33 days — a 3% lower offer ($213k) is reasonable based on typical stale-listing flexibility.
- 3 sale attempts with the ask held roughly flat each time — persistent listings suggest the price (not the market) is what's stuck; bring a comps-based counter.
Risks & watch-outs
- Watch-outs: built in 1953 — expect roof / HVAC / electrical / plumbing capex.
- Climate carrying-cost: moderate flood risk; severe wind risk, 80% chance of damaging wind over 30y; extreme-heat days projected 7→16/yr by 2055 (HVAC capex compounding) — expect insurance premiums to compound above CPI over the hold.
Questions for the listing agent
- What do current leases actually rent for vs. the listed asking? Can we see a recent rent roll and the last 12 months of T-12 income?
- It's been on market 33 days. Have you received any prior offers? Is the seller open to a 24% concession, seller financing, or rate buy-down credit?
- Built in 1953 — when were the roof, HVAC, electrical panel, plumbing, and water heater last replaced?
- Is there a deadline driving the sale (1031 exchange, divorce, estate, relocation)? That informs how much negotiation room exists.
- Schools are B-rated — typically a magnet for longer-tenancy family renters. What's the average tenant stay here, and is there a school-zone premium baked into asking?
- The area grade is low — what's the realistic commute time and amenity access for the typical tenant pool here? Any planned neighborhood developments (good or bad) we should know about?
- What's the average days-on-market for RENTAL listings here right now (not sales)? A rising rental-DOM trend means longer vacancies and softer asking-rent achievability than the comps imply.
- What's the recent tenant-quality profile in this submarket — average credit score on applications, eviction rate, late-payment / NSF rate, and stable-employment percentage? A property-management company in the area should have these aggregated.
- How much new for-sale + rental construction is in the pipeline within 1–3 miles? Heavy new supply typically softens prices + rents 12–24 months out; constrained supply supports both.
Investment metrics
- 1% rule
- 0.76% ✗
- Cap rate
- 5.75%
- Cash-on-cash
- -1.93%
- DSCR
- 0.91
- GRM
- 10.9
CMA / ARV
- ARV (median comp)
- $221,047
- List price
- $220,000
- Delta
- -0.47%
- Verdict
- FAIR
- Comps
- 20 within 1.0 mi
Show comp detail 12 sales within ~0.75 mi
| Address | Dist | Beds/Ba | Sqft | Sold | Price | $/sf | Match |
|---|---|---|---|---|---|---|---|
| 312 Shawen Dr | 0.25mi | 3/1.0 | 864 (+1%) | 3mo | $234,200 | $271 | 84 |
| 430 Cedar Dr | 0.19mi | 3/1.0 | 828 (-3%) | 4mo | $209,999 | $254 | 83 |
| 400 Cedar Dr | 0.09mi | 3/1.0 | 788 (-8%) | 2mo | $202,000 | $256 | 82 |
| 66 Cavalier Rd | 0.23mi | 3/1.0 | 902 (+6%) | 0mo | $179,900 | $199 | 79 |
| 218 Pine Grove Ave | 0.36mi | 3/1.0 | 909 (+7%) | 0mo | $250,000 | $275 | 72 |
| 213 Shawen Dr | 0.37mi | 2/1.0 (-1) | 864 (+1%) | 5mo | $135,000 | $156 | 71 |
| 100 Lexington St | 0.54mi | 3/1.0 | 892 (+5%) | 1mo | $244,000 | $274 | 66 |
| 54 Cavalier Rd | 0.27mi | 2/1.0 (-1) | 744 (-13%) | 3mo | $91,000 | $122 | 58 |
| 37 Cavalier Rd | 0.35mi | 2/1.0 (-1) | 744 (-13%) | 1mo | $199,000 | $267 | 57 |
| 405 Pine Grove Ave | 0.46mi | 3/2.0 | 963 (+13%) | 7mo | $230,000 | $239 | 47 |
| 18 Clemwood Pkwy | 0.66mi | 3/1.0 | 952 (+12%) | 6mo | $244,700 | $257 | 45 |
| 107 Roland Dr | 0.66mi | 2/1.0 (-1) | 731 (-14%) | 2mo | $176,000 | $241 | 39 |
Match score weights: distance 35% · size 25% · config 20% · recency 20%. Top-matched comps best support the ARV.
Projected returns pro-forma
-3.0% appreciation · 5.44% rent growth · sell at horizon
- IRR
- -17.0%
- Equity multiple
- 0.39×
- Total profit
- $-37,777
- Equity at exit
- $32,803
- IRR
- -5.2%
- Equity multiple
- 0.63×
- Total profit
- $-22,925
- Equity at exit
- $19,022
Cash invested: $61,600 (down + closing). Projections, not guarantees.
Landlord ↔ Tenant lean methodology
- Overall (STATE)
- 55 Moderately Landlord-Leaning
- State Virginia
- 55 Moderately Landlord-Leaning · D+2
- County
- — inherits STATE
- City
- — inherits STATE
ZIP-level market 23669
- Rents YoY
- 5.4%
- Active inventory
- 232
- Price-to-rent
- 10.9×
Monthly cashflow live
- Estimated rent
- $1,682 high interval (Pro) →
- Mortgage (P&I)
- −$1,154
- Tax from tax record
- −$182 /mo · $2,189/yr
- Insurance
- −$92
- HOA
- −$0
- Vacancy / Maint / Mgmt
- −$353
- Net cashflow
- $-99
Break-even live
UW: 25.0% down · 7.5% · 30yr · 1.5% tax · 5.0% vac · 8.0% maint · 8.0% mgmt
Financing live
Cash to close
- Down payment
- $55,000
- Closing costs
- $6,600
- Reserves months
- —
- Total cash needed
- —
Loan-product check · same deal, 3 products live
Conventional
25% down · 7.5% · 30yr
- Down + closing
- —
- Monthly P&I
- —
- Monthly cashflow
- —
- DSCR
- —
- Eligible?
- —
Personal DTI + credit; lowest rate.
DSCR
20% down · 8.5% · 30yr
- Down + closing
- —
- Monthly P&I
- —
- Monthly cashflow
- —
- DSCR
- —
- Eligible?
- —
No personal income docs; deal must DSCR.
Hard money
10% down · 12.0% · 12mo
- Down + closing
- —
- Monthly P&I
- —
- Monthly cashflow
- —
- DSCR
- —
- Eligible?
- —
Short-term bridge; refi at stabilization.
Rent comps 19 comps
| Address | Beds | Baths | Sqft | Rent | $/sqft | DOM | Units | Dist |
|---|---|---|---|---|---|---|---|---|
| 109 Peachtree Ln Hampton, VA | 3.0 | 2.0 | 984 | $1,795 | $1.82 | 14d | 1 | 0.15mi |
| 450 Cedar Dr Hampton, VA | 3.0 | 1.0 | 912 | $1,500 | $1.64 | 12d | 1 | 0.22mi |
| 212 Pine Grove Ave Hampton, VA | 2.0 | 1.0 | 720 | $1,500 | $2.08 | 23d | 1 | 0.32mi |
| 24 Cavalier Rd Hampton, VA | 3.0 | 2.0 | 1014 | $1,850 | $1.82 | 4d | 1 | 0.44mi |
| 28 Monroe Dr Hampton, VA | 3.0 | 1.0 | 1110 | $1,600 | $1.44 | 43d | 1 | 0.56mi |
| 13 Beverly St Hampton, VA | 3.0 | 1.0 | 1050 | $1,800 | $1.71 | 4d | 1 | 0.65mi |
| 105 Roland Dr Hampton, VA | 2.0 | 1.0 | 750 | $1,250 | $1.67 | 14d | 1 | 0.65mi |
| 232 W Gilbert St Hampton, VA | 1.0–2.0 | 1.0 | 767 | $1,371 | $1.79 | 1d | 1 | 0.84mi |
| 19 Bernard Ave Hampton, VA | 2.0 | 1.0 | 906 | $995 | $1.10 | 21d | 1 | 0.92mi |
| 1568 N King St Hampton, VA | 1.0–2.0 | 1.0 | 634 | $1,425 | $2.25 | 1d | 17 | 0.93mi |
| 1563 N King St Hampton, VA | 2.0 | 2.0 | 1087 | $1,612 | $1.48 | 23d | 2 | 0.95mi |
| 1563 N King St Unit 105 Hampton, VA | 2.0 | 2.0 | 1087 | $1,675 | $1.54 | 43d | 1 | 0.96mi |
| 323 Roane Dr Hampton, VA | 3.0 | 1.0 | 974 | $1,495 | $1.53 | 4d | 1 | 0.98mi |
| 8 Rip Rap Rd Hampton, VA | 2.0 | 1.0 | 1000 | $1,200 | $1.20 | 21d | 1 | 1.04mi |
| 1711 N King St Unit 18 Hampton, VA | 2.0 | 1.0 | 815 | $1,425 | $1.75 | 43d | 1 | 1.08mi |
| 100 Spanish Trl Hampton, VA | 1.0–2.0 | 1.0–1.5 | 812 | $1,450 | $1.79 | 1d | 12 | 1.16mi |
| 1802 Moger Dr Hampton, VA | 3.0 | 1.0 | 900 | $1,700 | $1.89 | 12d | 1 | 1.21mi |
| 1115 E Pembroke Ave Hampton, VA | 2.0 | 1.0 | 850 | $1,275 | $1.50 | 1d | 1 | 1.31mi |
| 2000 Neville Cir Hampton, VA | 3.0 | 1.0 | 1100 | $1,750 | $1.59 | 43d | 1 | 1.40mi |
Listing history 17 events
-
2026-06-13statusdays on market $220,000 Under Contract 33 DOM
-
2026-06-09days on market $220,000 Active Under Contract 32 DOM
-
2026-06-08days on market $220,000 Active Under Contract 31 DOM
-
2026-06-07days on market $220,000 Active Under Contract 30 DOM
-
2026-06-03days on market $220,000 Active Under Contract 26 DOM
-
2026-06-02days on market $220,000 Active Under Contract 25 DOM
-
2026-06-02status $220,000 Active Under Contract 24 DOM
-
2026-06-01days on market $220,000 Active 24 DOM
-
2026-05-31days on market $220,000 Active 23 DOM
-
2026-05-18price $220,000 353-char remark
-
2026-05-08$223,000 Active 353-char remark
-
2026-05-08historical
-
2026-04-10$225,000 Active
-
2023-06-02soldstatus $200,000
-
2021-06-11soldstatus $105,000
-
2006-09-25soldstatus $131,500
-
2004-05-07soldstatus $42,000
ⓘ Source: listings_history table (triggers on properties + properties_extension) + one-shot
backfill from property_details.listing_events for pre-trigger history.
Tax reassessment forecast VA · Resets to sale price
- Current annual tax
- $2,189 · $182/mo
- Projected year-2 tax
- $2,189 · $182/mo
- Expected delta
- $0/yr ($0/mo · 0.0%)
ⓘ Screening estimate from a state-policy table — verify with the county assessor before closing.
Climate risk First Street
- Flood 5/10 Major FEMA zone X (unshaded) · 41% chance over 30 yrs
- Wildfire 1/10 Low
- Heat 9/10 Extreme 7 d/yr ≥104°F today · 16 d/yr by 30 yrs out
- Wind 8/10 Severe 80% chance of damaging wind over 30 yrs
- Air quality 2/10 Low 1 unhealthy d/yr today · 2 by 30 yrs out
Nearby sold comps map
Loading sold comps map…
Walkable amenities ~0.75 mi
Loading nearby amenities…
Taxation est. · year 1
- Rental income
- $20,179
- − Mortgage interest
- −$12,323
- − Property taxes
- −$2,189
- − Insurance
- −$1,100
- − Repairs & maintenance
- −$1,614
- − Management
- −$1,614
- − Depreciation
- −$6,400
- Taxable loss
- −$5,062
- Est. tax savings @ 24.0%
- +$1,215
- After-tax cash flow
- $23/yr
For passive investors: Depreciation is non-cash, so a rental often shows a tax loss while cash-flowing — sheltering income. Rental losses are passive: they offset passive income freely, and up to $25,000/yr can offset ordinary (W-2) income if you actively participate and your MAGI is under $100k (phasing out to $0 by $150k); unused losses carry forward. On sale, claimed depreciation is recaptured at up to 25%, and gains may owe capital-gains tax (a 1031 exchange can defer both). Figures are a year-1 estimate at your 24.0% rate — not tax advice; consult a CPA.
Schools (NCES district)
- District
- Hampton City Public School District
- NCES district ID
- 5101800
- Math proficiency
- 60% ▼ -21.00%
- Reading proficiency
- 70% ▼ -4.00%
- Median HH income
- $50,089
- Composite
- 55.19/100
- National rank
- #1272
- State rank
- #40 of 131 in VA
Livability — Hampton
- Score
- 75/100
- State rank
- #133
- US rank
- #4302
Category grades
Schools grade is shown separately in the Schools card above.
Census & demographics
- Census place
- Hampton, VA
- County
- Hampton City · 132,421 people
- City population
- 132,421
- Metro
- Virginia Beach-Norfolk-Newport News, VA-NC
- Population (ZIP)
- 39,884
- Household income
- $71,222
- Rent vs Own
- Severe rent burden
- 2130.0
Population outlook (Hampton County) Hauer SSP2
- Today (2025)
- 134,055 people
- By 2030
- 131,753 · -1.7%
- By 2040
- 125,017 · -6.7%
- By 2050
- 116,825 · -12.9%
- By 2075
- 97,033 · -27.6%
- By 2100
- 76,188 · -43.2%
Race, ethnicity, and origin ACS 2023
- Neighborhood character
- Diverse neighborhood (Simpson 0.63)
- Race & ethnicity
- Black 46% White 39% Two or more races 9% Hispanic / Latino 6% Asian 2%
- Hispanic origin (detail)
- Mexican 1% Puerto Rican 2%
- Common ancestry
- Slovak 2% Italian 1% Romanian 1%
- Foreign-born
- 4% · Canada
- Languages at home
- 95% English-only · Spanish 3% Other Asian/Pacific 1%
Political lean MEDSL · Hampton
- 2024 margin
- Solid D (+39.9) · D 69.2% · R 29.4% · Other 1.4%
- 2008→2024 swing
- +1.0pp no change · 2008: 38.9pp · 2024: 39.9pp
- All cycles
- 2024: D+39.9 2020: D+42.2 2016: D+37.8 2012: D+45.4 2008: D+38.9
Not yet ingested
- Civics
- —
Market trends
- HPI YoY
- ▼ -150.40%
- Current HPI
- 276.4636
- Rent YoY
- ▲ 5.44%
- Metro
- Virginia Beach-Norfolk-Newport News, VA-NC
- State GDP YoY
- ▲ 2.40%
- F500 in state
- 50
Industry mix (Fortune 500 HQ in VA)
| Industry | F500 HQs | Revenue |
|---|---|---|
| Aerospace / Defense | 4 | $236B |
|
||
| Technology / Defense | 3 | $32B |
|
||
| Financial Services | 2 | $176B |
|
||
| Utilities | 2 | $27B |
|
||
| Insurance | 2 | $25B |
|
||
| Technology | 2 | $15B |
|
||
Price history
+423.8% since first listed12 events — show timeline
- 2026-06-10 Pending — REINMLS
- 2026-06-01 Contingent — REINMLS
- 2026-05-30 Relisted — REINMLS
- 2026-05-25 Contingent — REINMLS
- 2026-05-18 Price Changed $220,000 REINMLS
- 2026-05-08 Listing Removed — REINMLS
- 2026-05-08 Listed $223,000 REINMLS
- 2026-04-10 Listed $225,000 REINMLS
- 2023-06-02 Sold (Public Records) $200,000 Public Records
- 2021-06-11 Sold (Public Records) $105,000 Public Records
- 2006-09-25 Sold (Public Records) $131,500 Public Records
- 2004-05-07 Sold (Public Records) $42,000 Public Records
Property tax history
+9.7%/yrLatest (2025): $2,189 · +6.2% YoY. Source: county tax records.
Cash-flow waterfall
monthlySold comps — $/sqft
last 12 mo · ≤1 miLoading sold comps…