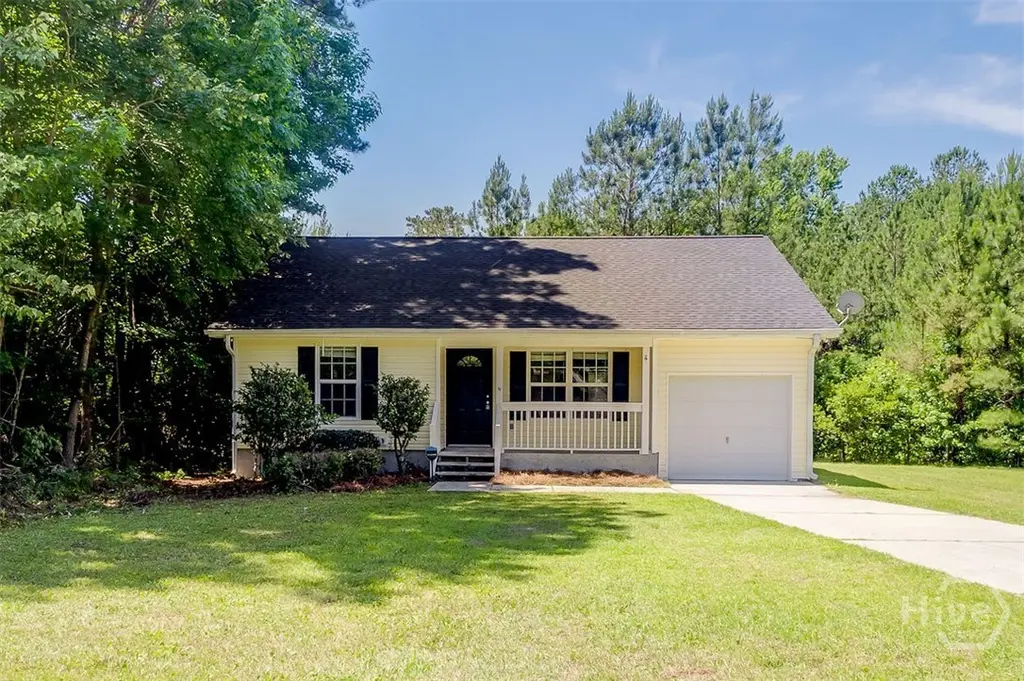
2 Talmadge Dr · Rincon, GA
Flood risk 1/10 · Minimal
- FEMA flood zone
- X (unshaded)
- Chance of flooding over 30 yrs
- 0.0%
- Est. flood insurance / yr
- $507 – $1,088
Fire risk 4/10 · Minor
- Est. fire insurance / yr
- $963 – $1,789
Heat risk 9/10 · Severe
- Hot days now (above 109°F)
- 7 days/yr
- Hot days in 30 yrs
- 17 days/yr
Wind risk 8/10 · Major
- Chance of severe wind over 30 yrs
- 98.0%
Air-quality risk 3/10 · Minor
- Unhealthy air days now
- 3 days/yr
- Unhealthy air days in 30 yrs
- 3 days/yr
Risk factors via First Street. Map © Google.
Why this score? — see what drove the D grade
The composite is a weighted blend of 9 inputs, each scored 0–100. Each bar is that input's sub-score; the figure is the points it added to the 100-point composite (weight × sub-score).
- Cash flow +14.0/30.0
- ARV discount +7.5/15.0
- DSCR +4.3/10.0
- Schools +4.3/10.0
- Livability +3.5/5.0
- Rent growth +2.9/5.0
- 1% rule +2.6/10.0
- Condition / age +2.5/5.0
- Appreciation +0.0/10.0
$249,900
🖨 Deal sheet (PDF) 📄 Offer letter ✓ Due diligence
Listing remarks MLS
Enjoy the perfect blend of space and convenience in this beautifully updated home on over an acre! Freshly painted throughout with brand-new vinyl plank flooring, this open floor plan offers soaring ceilings in the kitchen and living room. The kitchen shines with new countertops, a brand-new stove and dishwasher, and modern light fixtures. Relax on the covered front or back porch and take in the peaceful surroundings of more than an acre of land—all with no HOA restrictions
Key facts
- Country living
- Acre of land
- Soaring ceilings
Tags
Property features AI
Exterior
- Parking: Attached 1-car garage
- Utilities: Public water; Public sewer
- Home design: Single-family residence; One story
- Construction: Vinyl siding
- Exterior features: Asphalt road access; Has a view
Interior
- Kitchen: Dishwasher; Oven; Range; Range hood; Refrigerator
- Bathrooms: 2 full bathrooms
- Heating & cooling: Central heating (electric); Central air conditioning (electric)
- Interior features: Breakfast bar; Ceiling fan(s)
- Laundry & utility: Washer hookup; Electric water heater
Neighborhood map
What this means for you Summary
Snapshot
- This is a 3-bed/2.0-bath other listed at $250k.
Deal economics
- At list price, monthly cash flow is $33 ($395/yr) — positive.
- The deal already cash-flows at list — no discount required.
- To meet the 1% rule (rent ≥ 1% of price), the offer needs to be $190k (24.0% below list).
- Recommended offer: $190k (24.0% below list) — sets the bar for 1% rule.
- Cap rate 6.5% vs local median 4.4% in Rincon — top-decile yield for the area; either an underpriced asset or a hidden risk that comps aren't pricing in. Stress-test before assuming the spread holds.
Location & tenants
- Location reads 69/100 on livability (#109 in GA) — a middle-class / working-renter tenant base. Strengths: crime A+, cost of living A+, housing A+; Watch: amenities F, commute F, health & safety F.
- Effingham County (rural): math 49% / reading 48% proficiency, ranked #16 of 174 in GA (top 9%) — families likely to look elsewhere, expect single-tenant / working-renter base with shorter leases.
- Zoned schools: Rincon Elementary School (math 64% / reading 55%, grade B-, #130 of 1,228 statewide, top 11%, 1,047 students, 49% FRL); Ebenezer Middle School (math 50% / reading 55%, grade C+, #58 of 470 statewide, top 12%, 934 students, 37% FRL); Effingham County High School (math 28% / reading 27%, grade F, #158 of 424 statewide, top 37%, 2,108 students, 37% FRL).
- Market conditions: Rents rising (+1.5%/yr); 264 active listings in the ZIP; 15 comparable units currently listed for rent nearby; rentals at typical pace (median 25d on market — plan ~3-4 weeks tenant-placement turnaround); 47% of comp listings sitting > 30 days — soft ceiling on asking rent; solid renter incomes; 836 units permitted in Effingham County in 2024 (46 in 5+ unit buildings).
Forward outlook
- Local home prices are declining (-3.0%/yr); year-one equity from $2k of loan paydown is wiped out by about $7k of value loss. Plan a longer hold.
- Effingham County population projected at +33% by 2050 — long-run rental-demand tailwind backs the buy-and-hold thesis.
Negotiation context
- Only 10 days on market — expect competitive offers; lowballing is unlikely to land.
- 2 sale attempts with the ask held roughly flat each time — persistent listings suggest the price (not the market) is what's stuck; bring a comps-based counter.
Risks & watch-outs
- Climate carrying-cost: severe wind risk, 98% chance of damaging wind over 30y; extreme-heat days projected 7→17/yr by 2055 (HVAC capex compounding) — expect insurance premiums to compound above CPI over the hold.
Questions for the listing agent
- Is there a deadline driving the sale (1031 exchange, divorce, estate, relocation)? That informs how much negotiation room exists.
- The area grade is low — what's the realistic commute time and amenity access for the typical tenant pool here? Any planned neighborhood developments (good or bad) we should know about?
- What's the average days-on-market for RENTAL listings here right now (not sales)? A rising rental-DOM trend means longer vacancies and softer asking-rent achievability than the comps imply.
- What's the recent tenant-quality profile in this submarket — average credit score on applications, eviction rate, late-payment / NSF rate, and stable-employment percentage? A property-management company in the area should have these aggregated.
- How much new for-sale + rental construction is in the pipeline within 1–3 miles? Heavy new supply typically softens prices + rents 12–24 months out; constrained supply supports both.
Investment metrics
- 1% rule
- 0.76% ✗
- Cap rate
- 6.45%
- Cash-on-cash
- 0.56%
- DSCR
- 1.03
- GRM
- 11.0
CMA / ARV
No comps found within radius.
Projected returns pro-forma
-3.0% appreciation · 1.52% rent growth · sell at horizon
- IRR
- -16.9%
- Equity multiple
- 0.41×
- Total profit
- $-41,318
- Equity at exit
- $37,261
- IRR
- -11.4%
- Equity multiple
- 0.36×
- Total profit
- $-44,912
- Equity at exit
- $21,607
Cash invested: $69,972 (down + closing). Projections, not guarantees.
Landlord ↔ Tenant lean methodology
- Overall (STATE)
- 90 Strongly Landlord-Friendly
- State Georgia
- 90 Strongly Landlord-Friendly · R+3
- County
- — inherits STATE
- City
- — inherits STATE
ZIP-level market 31326
- Home prices YoY
- -31.5%
- Rents YoY
- 1.5%
- Active inventory
- 264
- Price-to-rent
- 11.0×
Monthly cashflow live
- Estimated rent
- $1,898 high interval (Pro) →
- Mortgage (P&I)
- −$1,311
- Tax from tax record
- −$52 /mo · $628/yr
- Insurance
- −$104
- HOA
- −$0
- Vacancy / Maint / Mgmt
- −$399
- Net cashflow
- $33
Break-even live
Sensitivity live
| Price | -10% $174 | -5% $104 | +0% $33 | +5% $-38 | +10% $-109 |
|---|---|---|---|---|---|
| Rent | -10% $-117 | -5% $-42 | +0% $33 | +5% $108 | +10% $183 |
| Rate | -1.0pp $159 | -0.5pp $96 | base $33 | +0.5pp $-32 | +1.0pp $-98 |
UW: 25.0% down · 7.5% · 30yr · 1.5% tax · 5.0% vac · 8.0% maint · 8.0% mgmt
Financing live
Cash to close
- Down payment
- $62,475
- Closing costs
- $7,497
- Reserves months
- —
- Total cash needed
- —
Loan-product check · same deal, 3 products live
Conventional
25% down · 7.5% · 30yr
- Down + closing
- —
- Monthly P&I
- —
- Monthly cashflow
- —
- DSCR
- —
- Eligible?
- —
Personal DTI + credit; lowest rate.
DSCR
20% down · 8.5% · 30yr
- Down + closing
- —
- Monthly P&I
- —
- Monthly cashflow
- —
- DSCR
- —
- Eligible?
- —
No personal income docs; deal must DSCR.
Hard money
10% down · 12.0% · 12mo
- Down + closing
- —
- Monthly P&I
- —
- Monthly cashflow
- —
- DSCR
- —
- Eligible?
- —
Short-term bridge; refi at stabilization.
Rent comps 15 comps
| Address | Beds | Baths | Sqft | Rent | $/sqft | DOM | Units | Dist |
|---|---|---|---|---|---|---|---|---|
| 108 Tyler St Rincon, GA | 3.0 | 1.0 | 1138 | $1,700 | $1.49 | 25d | 1 | 0.15mi |
| 126 Smithfield Dr Rincon, GA | 3.0 | 2.0 | 1298 | $1,850 | $1.43 | 45d | 1 | 0.30mi |
| 122 Smithfield Dr Unit A Rincon, GA | 3.0 | 2.0 | 1298 | $1,700 | $1.31 | 45d | 1 | 0.31mi |
| 122 Smithfield Dr Rincon, GA | 3.0 | 2.0 | 1298 | $1,700 | $1.31 | 15d | 1 | 0.31mi |
| 122 Smithfield Dr Unit B Rincon, GA | 3.0 | 2.0 | 1298 | $1,850 | $1.43 | 45d | 1 | 0.31mi |
| 135 Smithfield Dr Unit B Rincon, GA | 3.0 | 2.0 | 1298 | $1,850 | $1.43 | 45d | 1 | 0.34mi |
| 129 Smithfield Dr Unit A Rincon, GA | 3.0 | 2.0 | 1172 | $1,600 | $1.37 | 15d | 1 | 0.38mi |
| 101 Smithfield Dr Rincon, GA | 3.0 | 2.0 | 1200 | $1,700 | $1.42 | 45d | 5 | 0.42mi |
| 407 Savannah Ave Rincon, GA | 2.0 | 2.0 | 934 | $1,400 | $1.50 | 25d | 1 | 0.65mi |
| 403 Savannah Ave Rincon, GA | 2.0 | 2.0 | 934 | $1,500 | $1.61 | 45d | 1 | 0.66mi |
| 501 W 9th St Unit 1369214P Rincon, GA | 3.0 | 1.0 | 1291 | $2,504 | $1.94 | 23d | 1 | 0.97mi |
| 128 Karima Cir Rincon, GA | 2.0 | 2.0 | 1092 | $1,600 | $1.47 | 45d | 1 | 1.05mi |
| 123 Susan Dr Rincon, GA | 3.0 | 2.0 | 1360 | $1,800 | $1.32 | 23d | 1 | 1.06mi |
| 302 Parade Ct Unit 310 Rincon, GA | 2.0 | 2.0 | 1100 | $1,550 | $1.41 | 25d | 1 | 1.07mi |
| 103 W 15th St Rincon, GA | 3.0 | 1.0 | 1248 | $1,700 | $1.36 | 25d | 1 | 1.29mi |
Listing history 10 events
-
2026-06-05status $249,900 Pending 10 DOM
-
2026-06-03days on market $249,900 Active 10 DOM
-
2026-06-02days on market $249,900 Active 9 DOM
-
2026-06-01days on market $249,900 Active 8 DOM
-
2026-05-31days on market $249,900 Active 7 DOM
-
2026-05-30days on market $249,900 Active 6 DOM
-
2026-05-24$249,900 Active
-
2025-11-24soldstatus $249,400 484-char remark
Show marketing remark (484 chars)
Enjoy the perfect blend of space and convenience in this beautifully updated home on over an acre! Freshly painted throughout with brand-new vinyl plank flooring, this open floor plan offers soaring ceilings in the kitchen and living room. The kitchen shines with new countertops, a brand-new stove and dishwasher, and modern light fixtures. Relax on the covered front or back porch and take in the peaceful surroundings of more than an acre of land—all with no HOA restrictions
-
2025-09-25$239,900 484-char remark
Show marketing remark (484 chars)
Enjoy the perfect blend of space and convenience in this beautifully updated home on over an acre! Freshly painted throughout with brand-new vinyl plank flooring, this open floor plan offers soaring ceilings in the kitchen and living room. The kitchen shines with new countertops, a brand-new stove and dishwasher, and modern light fixtures. Relax on the covered front or back porch and take in the peaceful surroundings of more than an acre of land—all with no HOA restrictions
-
2005-07-12soldstatus $25,000
ⓘ Source: listings_history table (triggers on properties + properties_extension) + one-shot
backfill from property_details.listing_events for pre-trigger history.
Tax reassessment forecast GA · Resets to sale price
- Current annual tax
- $628 · $52/mo
- Projected year-2 tax
- $2,299 · $192/mo
- Expected delta
- +$1,671/yr (+$139/mo · 266.3%)
ⓘ Screening estimate from a state-policy table — verify with the county assessor before closing.
Climate risk First Street
- Flood 1/10 Low FEMA zone X (unshaded) · 0% chance over 30 yrs
- Wildfire 4/10 Moderate
- Heat 9/10 Extreme 7 d/yr ≥109°F today · 17 d/yr by 30 yrs out
- Wind 8/10 Severe 98% chance of damaging wind over 30 yrs
- Air quality 3/10 Moderate 3 unhealthy d/yr today · 3 by 30 yrs out
Nearby sold comps map
Loading sold comps map…
Walkable amenities ~0.75 mi
Loading nearby amenities…
Taxation est. · year 1
- Rental income
- $22,782
- − Mortgage interest
- −$13,998
- − Property taxes
- −$628
- − Insurance
- −$1,250
- − Repairs & maintenance
- −$1,823
- − Management
- −$1,823
- − Depreciation
- −$7,270
- Taxable loss
- −$4,008
- Est. tax savings @ 24.0%
- +$962
- After-tax cash flow
- $1,357/yr
For passive investors: Depreciation is non-cash, so a rental often shows a tax loss while cash-flowing — sheltering income. Rental losses are passive: they offset passive income freely, and up to $25,000/yr can offset ordinary (W-2) income if you actively participate and your MAGI is under $100k (phasing out to $0 by $150k); unused losses carry forward. On sale, claimed depreciation is recaptured at up to 25%, and gains may owe capital-gains tax (a 1031 exchange can defer both). Figures are a year-1 estimate at your 24.0% rate — not tax advice; consult a CPA.
Schools (NCES district)
- District
- Effingham County
- NCES district ID
- 1301980
- Math proficiency
- 49% ▼ -6.00%
- Reading proficiency
- 48% ▼ -5.00%
- Median HH income
- $60,503
- Composite
- 42.56/100
- National rank
- #3195
- State rank
- #16 of 174 in GA
Livability — Rincon
- Score
- 69/100
- State rank
- #109
- US rank
- #8380
Category grades
Schools grade is shown separately in the Schools card above.
Census & demographics
- Census place
- Rincon, GA
- County
- Effingham County · 68,439 people
- City population
- 23,940
- Metro
- Savannah, GA
- Population (ZIP)
- 23,940
- Household income
- $83,145
- Rent vs Own
- Severe rent burden
- 503.0
Population outlook (Effingham County) Hauer SSP2
- Today (2025)
- 67,399 people
- By 2030
- 72,297 · +7.3%
- By 2040
- 81,602 · +21.1%
- By 2050
- 89,494 · +32.8%
- By 2075
- 105,976 · +57.2%
- By 2100
- 111,943 · +66.1%
Race, ethnicity, and origin ACS 2023
- Neighborhood character
- Predominantly White (70%)
- Race & ethnicity
- White 70% Black 18% Hispanic / Latino 6% Two or more races 5% Asian 2%
- Hispanic origin (detail)
- Mexican 3% Puerto Rican 1%
- Common ancestry
- Italian 2% Slovak 2% Lithuanian 1%
- Foreign-born
- 5% · Canada
- Languages at home
- 95% English-only · Spanish 3% Other Indo-European 1%
Political lean MEDSL · Effingham
- 2024 margin
- Solid R (+49.1) · D 25.2% · R 74.3%
- 2008→2024 swing
- +1.6pp toward D · 2008: -50.7pp · 2024: -49.1pp
- All cycles
- 2024: R+49.1 2020: R+49.5 2016: R+55.6 2012: R+51.2 2008: R+50.7
Not yet ingested
- Civics
- —
Market trends
- HPI YoY
- ▼ -100.63%
- Current HPI
- 219.0064
- Rent YoY
- ▲ 1.52%
- Metro
- Savannah, GA
- State GDP YoY
- ▲ 2.66%
- F500 in state
- 28
Industry mix (Fortune 500 HQ in GA)
| Industry | F500 HQs | Revenue |
|---|---|---|
| Paper / Packaging | 2 | $29B |
|
||
| Retail | 1 | $160B |
|
||
| Transportation / Logistics | 1 | $91B |
|
||
| Airlines | 1 | $62B |
|
||
| Consumer Goods | 1 | $47B |
|
||
| Utilities | 1 | $25B |
|
||
Price history
+899.6% since first listed4 events — show timeline
- 2026-05-24 Listed $249,900 Hive MLS
- 2025-11-24 Sold (MLS) $249,400 Hive MLS
- 2025-09-25 Listed $239,900 Hive MLS
- 2005-07-12 Sold (Public Records) $25,000 Public Records
Property tax history
+14.7%/yrLatest (2025): $628 · +7.6% YoY. Source: county tax records.
Cash-flow waterfall
monthlySold comps — $/sqft
last 12 mo · ≤1 miLoading sold comps…