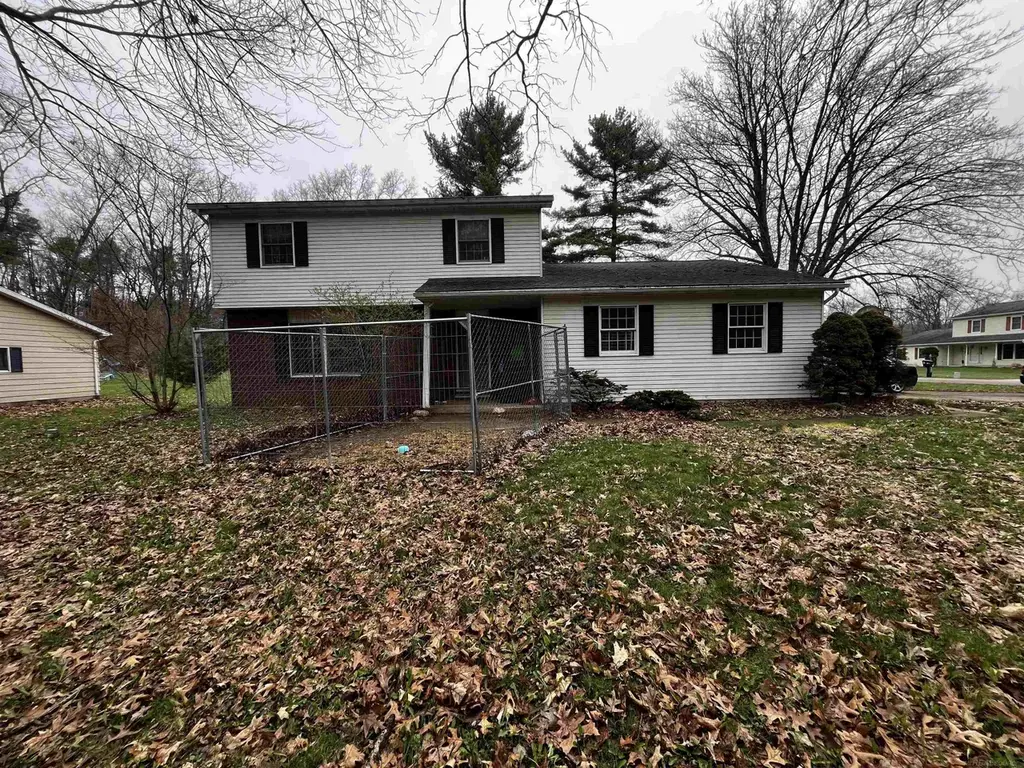
4600 Horton Rd · Jackson, MI
Flood risk 1/10 · Minimal
- FEMA flood zone
- X (unshaded)
- Chance of flooding over 30 yrs
- 0.0%
- Est. flood insurance / yr
- $473 – $860
Fire risk 3/10 · Minor
- Est. fire insurance / yr
- $784 – $1,456
Heat risk 2/10 · Minimal
- Hot days now (above 98°F)
- 7 days/yr
- Hot days in 30 yrs
- 15 days/yr
Wind risk 2/10 · Minimal
- Chance of severe wind over 30 yrs
- —
Air-quality risk 2/10 · Minimal
- Unhealthy air days now
- 1 days/yr
- Unhealthy air days in 30 yrs
- 1 days/yr
Risk factors via First Street. Map © Google.
Why this score? — see what drove the D grade
The composite is a weighted blend of 9 inputs, each scored 0–100. Each bar is that input's sub-score; the figure is the points it added to the 100-point composite (weight × sub-score).
- ARV discount +15.0/15.0
- Cash flow +7.9/30.0
- Rent growth +5.0/5.0
- Livability +3.7/5.0
- 1% rule +3.1/10.0
- Condition / age +2.5/5.0
- DSCR +2.0/10.0
- Schools +1.8/10.0
- Appreciation +0.0/10.0
$199,990
🖨 Deal sheet 📄 Offer letter ✓ Due diligence
Listing remarks MLS
This charming 4 bedroom, 1.5 bath home in Jackson offers 1,528 sq. ft. of comfortable living space on a spacious corner lot. Enjoy the peace of mind that comes with a solid foundation and a reliable roof, complemented by a newer well pump and water heater. The interior features a functional layout with essential appliances included: refrigerator, stove, microwave, and dishwasher. With no HOA to limit your lifestyle, this property provides a wonderful canvas for your personal touch.
Key facts
- Solid foundation
- Reliable roof
- Newer water heater
Tags
Neighborhood map
What this means for you Summary
Snapshot
- This is a 4-bed/1.5-bath single-family listed at $200k.
Deal economics
- At list price, monthly cash flow is $-210 ($-3k/yr) — negative.
- To cash-flow at today's rent, offer at most $163k (18.6% below list).
- To meet the 1% rule (rent ≥ 1% of price), the offer needs to be $163k (18.5% below list).
- Recommended offer: $163k (18.6% below list) — sets the bar for cash-flow.
Location & tenants
- Location reads 74/100 on livability (#197 in MI, #4,970 nationally) — a middle-class / working-renter tenant base. Strengths: cost of living A+, housing A+, health & safety A+; Watch: schools D, crime F, employment F.
- Jackson Public Schools (urban): math 15% / reading 28% proficiency, ranked #458 of 540 in MI (top 85%) — low school quality limits family demand, transient renter base, plan for 1-2y turnover; 63% free/reduced lunch — lower-income household profile, screen leases tightly.
- Market conditions: Rents rising fast (+10.3%/yr); 362 active listings in the ZIP; 317 units permitted in Jackson County in 2024 (103 in 5+ unit buildings).
Forward outlook
- Local home prices are declining (-3.0%/yr); year-one equity from $1k of loan paydown is wiped out by about $6k of value loss. Plan a longer hold.
- Jackson County population projected at -13% by 2050 — secular population decline; favor cash flow + early exit over multi-decade hold.
Negotiation context
- It's been on market 66 days — a 6% lower offer ($188k) is reasonable based on typical stale-listing flexibility.
- 14 sale attempts since 19y ago; this cycle's ask has dropped $39k (16%) from the opening price — seller is motivated, your offer sets the floor, not the list.
Questions for the listing agent
- What do current leases actually rent for vs. the listed asking? Can we see a recent rent roll and the last 12 months of T-12 income?
- It's been on market 66 days. Have you received any prior offers? Is the seller open to a 19% concession, seller financing, or rate buy-down credit?
- Built in 1978 — when were the roof, HVAC, electrical panel, plumbing, and water heater last replaced?
- Why hasn't it sold? Are there any deal-killer items the seller is aware of (foundation, flood, title, zoning, code violations)?
- Is there a deadline driving the sale (1031 exchange, divorce, estate, relocation)? That informs how much negotiation room exists.
- Schools are D-rated, which usually means shorter tenancies and higher turnover. Who's the typical renter profile here, and what's been the actual vacancy rate?
- Crime grade is F in this area — have there been break-ins, vandalism, or insurance claims at this property in the last 3 years? What carrier currently insures it and at what premium?
- The area grade is low — what's the realistic commute time and amenity access for the typical tenant pool here? Any planned neighborhood developments (good or bad) we should know about?
- What's the average days-on-market for RENTAL listings here right now (not sales)? A rising rental-DOM trend means longer vacancies and softer asking-rent achievability than the comps imply.
- What's the recent tenant-quality profile in this submarket — average credit score on applications, eviction rate, late-payment / NSF rate, and stable-employment percentage? A property-management company in the area should have these aggregated.
- How much new for-sale + rental construction is in the pipeline within 1–3 miles? Heavy new supply typically softens prices + rents 12–24 months out; constrained supply supports both.
Investment metrics
- 1% rule
- 0.81% ✗
- Cap rate
- 5.03%
- Cash-on-cash
- -4.51%
- DSCR
- 0.80
- GRM
- 10.2
CMA / ARV
- ARV (median comp)
- $268,213
- List price
- $199,990
- Delta
- -25.44%
- Verdict
- UNDERPRICED
- Comps
- 7 within 1.0 mi
Show comp detail 2 sales within ~0.75 mi
| Address | Dist | Beds/Ba | Sqft | Sold | Price | $/sf | Match |
|---|---|---|---|---|---|---|---|
| 3408 Hathaway Ln | 0.59mi | 3/1.5 (-1) | 1,617 (+6%) | 2mo | $285,000 | $176 | 56 |
| 5647 Maple Dale Rd | 0.27mi | 3/2.0 (-1) | 1,343 (-12%) | 13mo | $210,000 | $156 | 49 |
Match score weights: distance 35% · size 25% · config 20% · recency 20%. Top-matched comps best support the ARV.
Projected returns pro-forma
-3.0% appreciation · 8.0% rent growth · sell at horizon
- IRR
- -18.0%
- Equity multiple
- 0.34×
- Total profit
- $-37,099
- Equity at exit
- $29,819
- IRR
- -2.1%
- Equity multiple
- 0.82×
- Total profit
- $-9,985
- Equity at exit
- $17,291
Cash invested: $55,997 (down + closing). Projections, not guarantees.
Landlord ↔ Tenant lean methodology
- Overall (STATE)
- 62 Landlord-Friendly
- State Michigan
- 62 Landlord-Friendly · EVEN
- County
- — inherits STATE
- City
- — inherits STATE
ZIP-level market 49201
- Rents YoY
- 10.3%
- Active inventory
- 362
- Price-to-rent
- 10.2×
Monthly cashflow live
- Estimated rent
- $1,629 medium interval (Pro) →
- Mortgage (P&I)
- −$1,049
- Tax from tax record
- −$365 /mo · $4,382/yr
- Insurance
- −$83
- HOA
- −$0
- Vacancy / Maint / Mgmt
- −$342
- Net cashflow
- $-210
Break-even live
UW: 25.0% down · 7.5% · 30yr · 1.5% tax · 5.0% vac · 8.0% maint · 8.0% mgmt
Financing live
Cash to close
- Down payment
- $49,998
- Closing costs
- $6,000
- Reserves months
- —
- Total cash needed
- —
Loan-product check · same deal, 3 products live
Conventional
25% down · 7.5% · 30yr
- Down + closing
- —
- Monthly P&I
- —
- Monthly cashflow
- —
- DSCR
- —
- Eligible?
- —
Personal DTI + credit; lowest rate.
DSCR
20% down · 8.5% · 30yr
- Down + closing
- —
- Monthly P&I
- —
- Monthly cashflow
- —
- DSCR
- —
- Eligible?
- —
No personal income docs; deal must DSCR.
Hard money
10% down · 12.0% · 12mo
- Down + closing
- —
- Monthly P&I
- —
- Monthly cashflow
- —
- DSCR
- —
- Eligible?
- —
Short-term bridge; refi at stabilization.
Listing history 50 events
-
2026-06-19days on market $199,990 Active 66 DOM
-
2026-06-18days on market $199,990 Active 65 DOM
-
2026-06-17days on market $199,990 Active 64 DOM
-
2026-06-16days on market $199,990 Active 63 DOM
-
2026-06-15days on market $199,990 Active 62 DOM
-
2026-06-14days on market $199,990 Active 60 DOM
-
2026-06-13pricedays on market $199,990 Active 59 DOM
-
2026-06-10days on market $209,000 Active 57 DOM
-
2026-06-09days on market $209,000 Active 56 DOM
-
2026-06-08days on market $209,000 Active 55 DOM
-
2026-06-07days on market $209,000 Active 54 DOM
-
2026-06-03days on market $209,000 Active 50 DOM
-
2026-06-02days on market $209,000 Active 49 DOM
-
2026-06-01days on market $209,000 Active 48 DOM
-
2026-05-31days on market $209,000 Active 47 DOM
-
2026-05-30days on market $209,000 Active 46 DOM
-
2026-05-05price $219,900 486-char remark
Show marketing remark (486 chars)
This charming 4 bedroom, 1.5 bath home in Jackson offers 1,528 sq. ft. of comfortable living space on a spacious corner lot. Enjoy the peace of mind that comes with a solid foundation and a reliable roof, complemented by a newer well pump and water heater. The interior features a functional layout with essential appliances included: refrigerator, stove, microwave, and dishwasher. With no HOA to limit your lifestyle, this property provides a wonderful canvas for your personal touch.
-
2026-05-04price $219,900 486-char remark
Show marketing remark (486 chars)
This charming 4 bedroom, 1.5 bath home in Jackson offers 1,528 sq. ft. of comfortable living space on a spacious corner lot. Enjoy the peace of mind that comes with a solid foundation and a reliable roof, complemented by a newer well pump and water heater. The interior features a functional layout with essential appliances included: refrigerator, stove, microwave, and dishwasher. With no HOA to limit your lifestyle, this property provides a wonderful canvas for your personal touch.
-
2026-04-27price $229,000 486-char remark
Show marketing remark (486 chars)
This charming 4 bedroom, 1.5 bath home in Jackson offers 1,528 sq. ft. of comfortable living space on a spacious corner lot. Enjoy the peace of mind that comes with a solid foundation and a reliable roof, complemented by a newer well pump and water heater. The interior features a functional layout with essential appliances included: refrigerator, stove, microwave, and dishwasher. With no HOA to limit your lifestyle, this property provides a wonderful canvas for your personal touch.
-
2026-04-14$238,900 Active 486-char remark
Show marketing remark (486 chars)
This charming 4 bedroom, 1.5 bath home in Jackson offers 1,528 sq. ft. of comfortable living space on a spacious corner lot. Enjoy the peace of mind that comes with a solid foundation and a reliable roof, complemented by a newer well pump and water heater. The interior features a functional layout with essential appliances included: refrigerator, stove, microwave, and dishwasher. With no HOA to limit your lifestyle, this property provides a wonderful canvas for your personal touch.
-
2021-07-23historical
-
2021-07-23historical
-
2020-09-02soldstatus $187,000
-
2020-08-27soldstatus $187,000 Sold
-
2020-08-27soldstatus $187,000 Closed
-
2020-07-17historical Keep Showing-Contgcy Appl
-
2020-07-17historical Contingent - Continue To Show
-
2020-06-28$184,900 Active
-
2020-06-28$184,900 Active
-
2020-01-13historical
-
2020-01-13historical
-
2019-12-12historical
-
2019-12-12$169,900 Active
-
2019-12-12$169,900
-
2019-12-12$169,900 Active
-
2019-12-12historical
-
2019-11-24price $174,900
-
2019-11-23price $174,900
-
2019-09-30price $180,000
-
2019-09-30price $180,000
-
2019-08-26$187,500 Active
-
2019-08-26$174,900
-
2019-08-26$187,500 Active
-
2007-03-30soldstatus $169,900
-
2007-03-30$169,900
-
2007-03-13soldstatus $169,900
-
2007-03-13soldstatus $169,900
-
2007-03-13soldstatus $169,900
ⓘ Source: listings_history table (triggers on properties + properties_extension) + one-shot
backfill from property_details.listing_events for pre-trigger history.
Tax reassessment forecast MI · Partial reset (capped growth)
- Current annual tax
- $4,382 · $365/mo
- Projected year-2 tax
- $4,382 · $365/mo
- Expected delta
- $0/yr ($0/mo · 0.0%)
ⓘ Screening estimate from a state-policy table — verify with the county assessor before closing.
Climate risk First Street
- Flood 1/10 Low FEMA zone X (unshaded) · 0% chance over 30 yrs
- Wildfire 3/10 Moderate
- Heat 2/10 Low 7 d/yr ≥98°F today · 15 d/yr by 30 yrs out
- Wind 2/10 Low
- Air quality 2/10 Low 1 unhealthy d/yr today · 1 by 30 yrs out
Nearby sold comps map
Loading sold comps map…
Walkable amenities ~0.75 mi
Loading nearby amenities…
Taxation est. · year 1
- Rental income
- $19,548
- − Mortgage interest
- −$11,203
- − Property taxes
- −$4,382
- − Insurance
- −$1,000
- − Repairs & maintenance
- −$1,564
- − Management
- −$1,564
- − Depreciation
- −$5,818
- Taxable loss
- −$5,982
- Est. tax savings @ 24.0%
- +$1,436
- After-tax cash flow
- $-1,088/yr
For passive investors: Depreciation is non-cash, so a rental often shows a tax loss while cash-flowing — sheltering income. Rental losses are passive: they offset passive income freely, and up to $25,000/yr can offset ordinary (W-2) income if you actively participate and your MAGI is under $100k (phasing out to $0 by $150k); unused losses carry forward. On sale, claimed depreciation is recaptured at up to 25%, and gains may owe capital-gains tax (a 1031 exchange can defer both). Figures are a year-1 estimate at your 24.0% rate — not tax advice; consult a CPA.
Schools (NCES district)
- District
- Jackson Public Schools
- NCES district ID
- 2619620
- Math proficiency
- 15% ▼ -6.00%
- Reading proficiency
- 28% ▼ -3.00%
- Median HH income
- $38,344
- Composite
- 17.99/100
- National rank
- #8986
- State rank
- #458 of 540 in MI
Livability — Jackson
- Score
- 74/100
- State rank
- #197
- US rank
- #4970
Category grades
Schools grade is shown separately in the Schools card above.
Census & demographics
- County
- Jackson County · 85,581 people
- City population
- 85,581
- Metro
- Jackson, MI
- Population (ZIP)
- 49,107
- Household income
- $74,484
- Rent vs Own
- Severe rent burden
- 840.0
Population outlook (Jackson County) Hauer SSP2
- Today (2025)
- 156,365 people
- By 2030
- 153,123 · -2.1%
- By 2040
- 144,981 · -7.3%
- By 2050
- 135,671 · -13.2%
- By 2075
- 113,833 · -27.2%
- By 2100
- 86,592 · -44.6%
Race, ethnicity, and origin ACS 2023
- Neighborhood character
- Predominantly White (80%)
- Race & ethnicity
- White 80% Black 9% Two or more races 6% Hispanic / Latino 5%
- Hispanic origin (detail)
- Mexican 4%
- Common ancestry
- Romanian 7% Lithuanian 3% Slovak 2%
- Foreign-born
- 3% · Canada
- Languages at home
- 96% English-only · Spanish 2% Other Indo-European 1% Russian/Polish/Slavic 1%
Political lean MEDSL · Jackson
- 2024 margin
- Strong R (+21.3) · D 38.6% · R 59.9% · Other 1.5%
- 2008→2024 swing
- -23.7pp toward R · 2008: 2.4pp · 2024: -21.3pp
- All cycles
- 2024: R+21.3 2020: R+19.0 2016: R+20.1 2012: R+5.8 2008: D+2.4
Not yet ingested
- Civics
- —
Market trends
- HPI YoY
- ▼ -198.89%
- Current HPI
- 185.3773
- Rent YoY
- ▲ 10.32%
- Metro
- Jackson, MI
- State GDP YoY
- ▲ 1.37%
- F500 in state
- 28
Industry mix (Fortune 500 HQ in MI)
| Industry | F500 HQs | Revenue |
|---|---|---|
| Automotive Parts | 3 | $48B |
|
||
| Automotive | 2 | $372B |
|
||
| Chemicals | 1 | $45B |
|
||
| Automotive Retail | 1 | $29B |
|
||
| Healthcare / Medical Devices | 1 | $23B |
|
||
| Automotive Technology | 1 | $20B |
|
||
Price history
+29.4% since first listed37 events — show timeline
- 2026-05-05 Price Changed $219,900 MiRealSource-MiMLS
- 2026-05-04 Price Changed $219,900 REALCOMP
- 2026-04-27 Price Changed $229,000 MiRealSource-MiMLS
- 2026-04-27 Price Changed $229,000 REALCOMP
- 2026-04-14 Listed $238,900 REALCOMP
- 2026-04-14 Listed $238,900 MiRealSource-MiMLS
- 2021-07-23 Listing Removed — SW Michigan MLS
- 2021-07-23 Listing Removed — SW Michigan MLS
- 2020-09-02 Sold (Public Records) $187,000 Public Records
- 2020-08-27 Sold (MLS) $187,000 MiRealSource-MiMLS
- 2020-08-27 Sold (MLS) $187,000 REALCOMP
- 2020-07-17 Contingent — MiRealSource-MiMLS
- 2020-07-17 Contingent — REALCOMP
- 2020-06-28 Listed $184,900 MiRealSource-MiMLS
- 2020-06-28 Listed $184,900 REALCOMP
- 2020-01-13 Listing Removed — REALCOMP
- 2020-01-13 Listing Removed — MiRealSource-MiMLS
- 2019-12-12 Listing Removed — REALCOMP
- 2019-12-12 Listing Removed — MiRealSource-MiMLS
- 2019-12-12 Listed $169,900 MiRealSource-MiMLS
- 2019-12-12 Listed $169,900 SW Michigan MLS
- 2019-12-12 Listed $169,900 REALCOMP
- 2019-11-24 Price Changed $174,900 MiRealSource-MiMLS
- 2019-11-23 Price Changed $174,900 REALCOMP
- 2019-09-30 Price Changed $180,000 MiRealSource-MiMLS
- 2019-09-30 Price Changed $180,000 REALCOMP
- 2019-08-26 Listed $187,500 MiRealSource-MiMLS
- 2019-08-26 Listed $174,900 SW Michigan MLS
- 2019-08-26 Listed $187,500 REALCOMP
- 2007-03-30 Listed $169,900 Greater Lansing AoR
- 2007-03-30 Sold (MLS) $169,900 Greater Lansing AoR
- 2007-03-13 Sold (MLS) $169,900 REALCOMP
- 2007-03-13 Sold (MLS) $169,900 MiRealSource-MiMLS
- 2007-03-13 Sold (MLS) $169,900 SW Michigan MLS
- 2007-02-01 Listed $169,900 REALCOMP
- 2007-02-01 Listed $169,900 MiRealSource-MiMLS
- 2007-02-01 Listed $169,900 SW Michigan MLS
Property tax history
+8.1%/yrLatest (2025): $4,382 · +5.6% YoY. Source: county tax records.
Cash-flow waterfall
monthlySold comps — $/sqft
last 12 mo · ≤1 miLoading sold comps…