 Multi-family
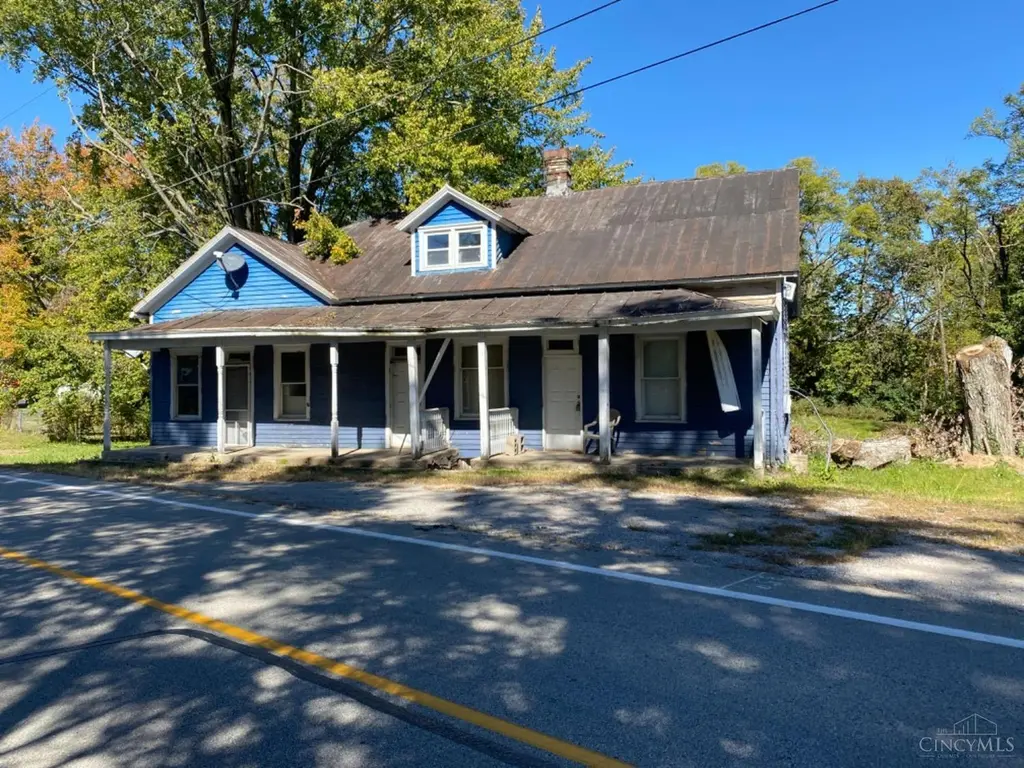
3591 St Rt 131 · Fayetteville, OH
Flood risk 1/10 · Minimal
- FEMA flood zone
- X (unshaded)
- Chance of flooding over 30 yrs
- 0.0%
- Est. flood insurance / yr
- $507 – $1,088
Fire risk 1/10 · Minimal
- Est. fire insurance / yr
- $713 – $1,323
Heat risk 4/10 · Minor
- Hot days now (above 100°F)
- 7 days/yr
- Hot days in 30 yrs
- 19 days/yr
Wind risk 2/10 · Minimal
- Chance of severe wind over 30 yrs
- 1.0%
Air-quality risk 2/10 · Minimal
- Unhealthy air days now
- 2 days/yr
- Unhealthy air days in 30 yrs
- 2 days/yr
Risk factors via First Street. Map © Google.
Why this score? — see what drove the B grade
The composite is a weighted blend of 9 inputs, each scored 0–100. Each bar is that input's sub-score; the figure is the points it added to the 100-point composite (weight × sub-score).
- Cash flow +30.0/30.0
- 1% rule +10.0/10.0
- DSCR +10.0/10.0
- ARV discount +7.5/15.0
- Schools +5.1/10.0
- Livability +3.4/5.0
- Rent growth +2.5/5.0
- Condition / age +2.5/5.0
- Appreciation +0.0/10.0
$72,500
🖨 Deal sheet (PDF) 📄 Offer letter ✓ Due diligence
Multi-family units
County records classify this as Multi-Family (2-4 Unit). Listing-text estimate: 1 unit. estimate disagrees with records
Listing remarks MLS
Calling all investors! This property is ready for your next renovation project with potential to be converted into a 3-4 bedroom home. Located in Fayetteville-Perry LSD with easy access to St. Rt. 32. Great opportunity to add value and customize to your vision.
Key facts
- 0.81 acre lot
- Listed 205 days
Neighborhood map
What this means for you Summary
Snapshot
- This is a 4-bed/1.0-bath multifamily listed at $72k.
Deal economics
- At list price, monthly cash flow is $852 ($10k/yr) — positive.
- The deal already cash-flows at list — no discount required.
- Meets the 1% rule at list price ($2k rent vs $72k).
- Recommended offer: $64k (12.0% below list) — sets the bar for market timing.
Location & tenants
- Location reads 68/100 on livability (#561 in OH) — a middle-class / working-renter tenant base. Strengths: cost of living A+, health & safety A+, housing A; Watch: employment C-, amenities F, commute F.
- Fayetteville-Perry Local (rural): math 56% / reading 62% proficiency, ranked #293 of 656 in OH (top 45%) — acceptable for families but not a draw, mixed tenant base, ~2y average lease.
- Market conditions: 34 active listings in the ZIP; solid renter incomes; 147 units permitted in Brown County in 2024 (0 in 5+ unit buildings).
Forward outlook
- Local home prices are declining (-3.0%/yr); year-one equity from $501 of loan paydown is wiped out by about $2k of value loss. Plan a longer hold.
- Brown County population projected at -26% by 2050 — secular population decline; favor cash flow + early exit over multi-decade hold.
- At projected returns (-3.0% appreciation + 3.0% rent growth), your $20k cash investment doubles in ~3 years — after that, you're playing with house money.
Negotiation context
- It's been on market 205 days — a 12% lower offer ($64k) is reasonable based on typical stale-listing flexibility.
- 2 sale attempts since 4y ago with the ask held roughly flat each time — persistent listings suggest the price (not the market) is what's stuck; bring a comps-based counter.
- Current owner paid $45k; list at $72k implies a 61% gain — meaningful room to come down on a strong offer.
Questions for the listing agent
- It's been on market 205 days. Have you received any prior offers? Is the seller open to a 12% concession, seller financing, or rate buy-down credit?
- Why hasn't it sold? Are there any deal-killer items the seller is aware of (foundation, flood, title, zoning, code violations)?
- Is there a deadline driving the sale (1031 exchange, divorce, estate, relocation)? That informs how much negotiation room exists.
- Schools are B-rated — typically a magnet for longer-tenancy family renters. What's the average tenant stay here, and is there a school-zone premium baked into asking?
- What's the average days-on-market for RENTAL listings here right now (not sales)? A rising rental-DOM trend means longer vacancies and softer asking-rent achievability than the comps imply.
- What's the recent tenant-quality profile in this submarket — average credit score on applications, eviction rate, late-payment / NSF rate, and stable-employment percentage? A property-management company in the area should have these aggregated.
- How much new apartment / multifamily construction is in the pipeline within 1–3 miles? Heavy new supply (>2% of stock underway) typically softens rents 12–24 months out; light construction supports rent growth.
Investment metrics
- 1% rule
- 2.27% ✓
- Cap rate
- 20.40%
- Cash-on-cash
- 50.38%
- DSCR
- 3.24
- GRM
- 3.7
CMA / ARV
- ARV (median comp)
- $367,915
- List price
- $72,500
- Delta
- -80.29%
- Verdict
- UNDERPRICED
- Comps
- 8 within 2.0 mi
Projected returns pro-forma
-3.0% appreciation · 3.0% rent growth · sell at horizon
- IRR
- 48.1%
- Equity multiple
- 3.09×
- Total profit
- $42,524
- Equity at exit
- $10,810
- IRR
- 53.7%
- Equity multiple
- 6.27×
- Total profit
- $106,887
- Equity at exit
- $6,268
Cash invested: $20,300 (down + closing). Projections, not guarantees.
Landlord ↔ Tenant lean methodology
- Overall (STATE)
- 73 Landlord-Friendly
- State Ohio
- 73 Landlord-Friendly · R+6
- County
- — inherits STATE
- City
- — inherits STATE
ZIP-level market 45118
- Home prices YoY
- -28.9%
- Active inventory
- 34
- Price-to-rent
- 3.7×
Monthly cashflow live
- Estimated rent
- $1,643 medium interval (Pro) →
- Mortgage (P&I)
- −$380
- Tax from tax record
- −$35 /mo · $424/yr
- Insurance
- −$30
- HOA
- −$0
- Vacancy / Maint / Mgmt
- −$345
- Net cashflow
- $852
Break-even live
Sensitivity live
| Price | -10% $893 | -5% $873 | +0% $852 | +5% $832 | +10% $811 |
|---|---|---|---|---|---|
| Rent | -10% $722 | -5% $787 | +0% $852 | +5% $917 | +10% $982 |
| Rate | -1.0pp $889 | -0.5pp $871 | base $852 | +0.5pp $833 | +1.0pp $814 |
UW: 25.0% down · 7.5% · 30yr · 1.5% tax · 5.0% vac · 8.0% maint · 8.0% mgmt
Financing live
Cash to close
- Down payment
- $18,125
- Closing costs
- $2,175
- Reserves months
- —
- Total cash needed
- —
Loan-product check · same deal, 3 products live
Conventional
25% down · 7.5% · 30yr
- Down + closing
- —
- Monthly P&I
- —
- Monthly cashflow
- —
- DSCR
- —
- Eligible?
- —
Personal DTI + credit; lowest rate.
DSCR
20% down · 8.5% · 30yr
- Down + closing
- —
- Monthly P&I
- —
- Monthly cashflow
- —
- DSCR
- —
- Eligible?
- —
No personal income docs; deal must DSCR.
Hard money
10% down · 12.0% · 12mo
- Down + closing
- —
- Monthly P&I
- —
- Monthly cashflow
- —
- DSCR
- —
- Eligible?
- —
Short-term bridge; refi at stabilization.
Listing history 20 events
-
2026-06-18days on market $72,500 Active 205 DOM
-
2026-06-17days on market $72,500 Active 204 DOM
-
2026-06-16days on market $72,500 Active 203 DOM
-
2026-06-15days on market $72,500 Active 202 DOM
-
2026-06-13days on market $72,500 Active 200 DOM
-
2026-06-12days on market $72,500 Active 199 DOM
-
2026-06-09days on market $72,500 Active 196 DOM
-
2026-06-08days on market $72,500 Active 195 DOM
-
2026-06-08days on market $72,500 Active 194 DOM
-
2026-06-05days on market $72,500 Active 192 DOM
-
2026-06-04days on market $72,500 Active 190 DOM
-
2026-06-02days on market $72,500 Active 189 DOM
-
2026-06-01days on market $72,500 Active 188 DOM
-
2026-05-31days on market $72,500 Active 187 DOM
-
2026-01-20price $72,500 261-char remark
Show marketing remark (261 chars)
Calling all investors! This property is ready for your next renovation project with potential to be converted into a 3-4 bedroom home. Located in Fayetteville-Perry LSD with easy access to St. Rt. 32. Great opportunity to add value and customize to your vision.
-
2025-11-25$75,000 Active 261-char remark
Show marketing remark (261 chars)
Calling all investors! This property is ready for your next renovation project with potential to be converted into a 3-4 bedroom home. Located in Fayetteville-Perry LSD with easy access to St. Rt. 32. Great opportunity to add value and customize to your vision.
-
2023-10-04historical 70-char remark
Show marketing remark (70 chars)
Great fixer upper, needs tlc, Reasonable cash offers, Motivated seller
-
2022-10-05$75,000 Active 70-char remark
Show marketing remark (70 chars)
Great fixer upper, needs tlc, Reasonable cash offers, Motivated seller
-
2011-02-14soldstatus $45,000
-
1999-09-10soldstatus $45,000
ⓘ Source: listings_history table (triggers on properties + properties_extension) + one-shot
backfill from property_details.listing_events for pre-trigger history.
Tax reassessment forecast OH · Partial reset (capped growth)
- Current annual tax
- $424 · $35/mo
- Projected year-2 tax
- $778 · $65/mo
- Expected delta
- +$353/yr (+$29/mo · 83.3%)
ⓘ Screening estimate from a state-policy table — verify with the county assessor before closing.
Climate risk First Street
- Flood 1/10 Low FEMA zone X (unshaded) · 0% chance over 30 yrs
- Wildfire 1/10 Low
- Heat 4/10 Moderate 7 d/yr ≥100°F today · 19 d/yr by 30 yrs out
- Wind 2/10 Low 100% chance of damaging wind over 30 yrs
- Air quality 2/10 Low 2 unhealthy d/yr today · 2 by 30 yrs out
Nearby sold comps map
Loading sold comps map…
Walkable amenities ~0.75 mi
Loading nearby amenities…
Taxation est. · year 1
- Rental income
- $19,717
- − Mortgage interest
- −$4,061
- − Property taxes
- −$424
- − Insurance
- −$362
- − Repairs & maintenance
- −$1,577
- − Management
- −$1,577
- − Depreciation
- −$2,109
- Taxable income
- $9,605
- Est. tax owed @ 24.0%
- −$2,305
- After-tax cash flow
- $7,922/yr
For passive investors: Depreciation is non-cash, so a rental often shows a tax loss while cash-flowing — sheltering income. Rental losses are passive: they offset passive income freely, and up to $25,000/yr can offset ordinary (W-2) income if you actively participate and your MAGI is under $100k (phasing out to $0 by $150k); unused losses carry forward. On sale, claimed depreciation is recaptured at up to 25%, and gains may owe capital-gains tax (a 1031 exchange can defer both). Figures are a year-1 estimate at your 24.0% rate — not tax advice; consult a CPA.
Schools (NCES district)
- District
- Fayetteville-Perry Local
- NCES district ID
- 3904604
- Math proficiency
- 56% ▼ -4.00%
- Reading proficiency
- 62% ▼ -1.00%
- Median HH income
- $55,082
- Composite
- 50.71/100
- National rank
- #1820
- State rank
- #293 of 656 in OH
Livability — Fayetteville
- Score
- 68/100
- State rank
- #561
- US rank
- #9566
Category grades
Schools grade is shown separately in the Schools card above.
Census & demographics
- County
- Brown · 38,418 people
- Metro
- Cincinnati, OH-KY-IN
- Population (ZIP)
- 3,789
- Household income
- $92,469
- Rent vs Own
- Severe rent burden
- 7.6
Population outlook (Brown County) Hauer SSP2
- Today (2025)
- 41,243 people
- By 2030
- 39,382 · -4.5%
- By 2040
- 35,196 · -14.7%
- By 2050
- 30,743 · -25.5%
- By 2075
- 21,870 · -47.0%
- By 2100
- 15,069 · -63.5%
Race, ethnicity, and origin ACS 2023
- Neighborhood character
- Predominantly White (97%)
- Race & ethnicity
- White 97% Two or more races 2%
- Common ancestry
- Italian 5% Lithuanian 4% Slovak 2%
Political lean MEDSL · Brown
- 2024 margin
- Solid R (+61.5) · D 19.0% · R 80.5%
- 2008→2024 swing
- -38.2pp toward R · 2008: -23.3pp · 2024: -61.5pp
- All cycles
- 2024: R+61.5 2020: R+57.4 2016: R+52.2 2012: R+25.1 2008: R+23.3
Not yet ingested
- Civics
- —
Market trends
- HPI YoY
- ▼ -104.80%
- Current HPI
- 257.8366
- Rent YoY
- —
- Metro
- —
- State GDP YoY
- ▲ 1.98%
- F500 in state
- 48
Industry mix (Fortune 500 HQ in OH)
| Industry | F500 HQs | Revenue |
|---|---|---|
| Insurance | 3 | $145B |
|
||
| Industrial Machinery | 3 | $49B |
|
||
| Financial Services | 3 | $24B |
|
||
| Consumer Goods | 2 | $93B |
|
||
| Aerospace / Defense | 2 | $47B |
|
||
| Utilities | 2 | $33B |
|
||
Price history
+61.1% since first listed6 events — show timeline
- 2026-01-20 Price Changed $72,500 Cincy MLS
- 2025-11-25 Listed $75,000 Cincy MLS
- 2023-10-04 Listing Removed — Cincy MLS
- 2022-10-05 Listed $75,000 Cincy MLS
- 2011-02-14 Sold (Public Records) $45,000 Public Records
- 1999-09-10 Sold (Public Records) $45,000 Public Records
Property tax history
-1.7%/yrLatest (2025): $424 · +0.0% YoY. Source: county tax records.
Cash-flow waterfall
monthlySold comps — $/sqft
last 12 mo · ≤1 miLoading sold comps…