70 South St · Cedarville, OH
Flood risk 1/10 · Minimal
- FEMA flood zone
- X (unshaded)
- Chance of flooding over 30 yrs
- 0.0%
- Est. flood insurance / yr
- $507 – $1,088
Fire risk 1/10 · Minimal
- Est. fire insurance / yr
- $713 – $1,323
Heat risk 3/10 · Minor
- Hot days now (above 99°F)
- 7 days/yr
- Hot days in 30 yrs
- 19 days/yr
Wind risk 2/10 · Minimal
- Chance of severe wind over 30 yrs
- 1.0%
Air-quality risk 2/10 · Minimal
- Unhealthy air days now
- 1 days/yr
- Unhealthy air days in 30 yrs
- 2 days/yr
Risk factors via First Street. Map © Google.
Why this score? — see what drove the D- grade
The composite is a weighted blend of 9 inputs, each scored 0–100. Each bar is that input's sub-score; the figure is the points it added to the 100-point composite (weight × sub-score).
- Cash flow +10.6/30.0
- ARV discount +7.5/15.0
- Schools +6.3/10.0
- Livability +4.0/5.0
- 1% rule +3.1/10.0
- DSCR +3.0/10.0
- Rent growth +2.5/5.0
- Condition / age +2.5/5.0
- Appreciation +0.0/10.0
$255,000
🖨 Deal sheet 📄 Offer letter ✓ Due diligence
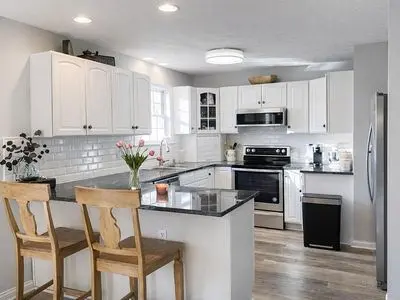
Listing remarks
This two-story condominium offers updates completed in 2021, including all flooring, interior paint, light fixtures, and kitchen appliances. In 2024, a new deck was completed. The deck provides water views of Flacks Pond. Located just minutes from downtown, the property offers convenient access to the town while maintaining a private setting. The condo is . 5 miles from Cedar Cliff Schools and from Cedarville University.
Key facts
- Water views
- Convenient access
- New deck
Tags
Neighborhood map
What this means for you Summary
Snapshot
- This is a 3-bed/3.0-bath condo listed at $255k.
Deal economics
- At list price, monthly cash flow is $-128 ($-2k/yr) — negative.
- To cash-flow at today's rent, offer at most $236k (7.3% below list).
- To meet the 1% rule (rent ≥ 1% of price), the offer needs to be $207k (18.9% below list).
- Recommended offer: $207k (18.9% below list) — sets the bar for 1% rule.
Location & tenants
- Location reads 80/100 on livability (#122 in OH, #1,797 nationally) — a professional / high-income tenant draw. Strengths: schools A+, cost of living A+, housing A+; Watch: amenities F, commute F, employment F.
- Cedar Cliff Local (town): math 67% / reading 81% proficiency, ranked #105 of 656 in OH (top 16%) — strong family-tenant draw, lease renewals of 3-5y typical.
- Market conditions: 13 active listings in the ZIP; solid renter incomes; 797 units permitted in Greene County in 2024 (148 in 5+ unit buildings).
Forward outlook
- Local home prices are declining (-3.0%/yr); year-one equity from $2k of loan paydown is wiped out by about $8k of value loss. Plan a longer hold.
Negotiation context
- Only 1 days on market — expect competitive offers; lowballing is unlikely to land.
- 4 sale attempts since 16y ago with the ask held roughly flat each time — persistent listings suggest the price (not the market) is what's stuck; bring a comps-based counter.
Questions for the listing agent
- What do current leases actually rent for vs. the listed asking? Can we see a recent rent roll and the last 12 months of T-12 income?
- Any open or pending special assessments — roof, HVAC, plumbing, elevator, façade? What's the per-unit balance and payoff schedule, and is the seller paying it off at close or rolling it to the buyer?
- Is there a deadline driving the sale (1031 exchange, divorce, estate, relocation)? That informs how much negotiation room exists.
- Schools are A-rated — typically a magnet for longer-tenancy family renters. What's the average tenant stay here, and is there a school-zone premium baked into asking?
- The area grade is low — what's the realistic commute time and amenity access for the typical tenant pool here? Any planned neighborhood developments (good or bad) we should know about?
- What's the average days-on-market for RENTAL listings here right now (not sales)? A rising rental-DOM trend means longer vacancies and softer asking-rent achievability than the comps imply.
- What's the recent tenant-quality profile in this submarket — average credit score on applications, eviction rate, late-payment / NSF rate, and stable-employment percentage? A property-management company in the area should have these aggregated.
- How much new apartment / multifamily construction is in the pipeline within 1–3 miles? Heavy new supply (>2% of stock underway) typically softens rents 12–24 months out; light construction supports rent growth.
Investment metrics
- 1% rule
- 0.81% ✗
- Cap rate
- 5.69%
- Cash-on-cash
- -2.16%
- DSCR
- 0.90
- GRM
- 10.3
CMA / ARV
No comps found within radius.
Projected returns pro-forma
-3.0% appreciation · 3.0% rent growth · sell at horizon
- IRR
- -19.9%
- Equity multiple
- 0.31×
- Total profit
- $-49,461
- Equity at exit
- $38,021
- IRR
- -12.7%
- Equity multiple
- 0.25×
- Total profit
- $-53,464
- Equity at exit
- $22,048
Cash invested: $71,400 (down + closing). Projections, not guarantees.
Landlord ↔ Tenant lean methodology
- Overall (STATE)
- 73 Landlord-Friendly
- State Ohio
- 73 Landlord-Friendly · R+6
- County
- — inherits STATE
- City
- — inherits STATE
ZIP-level market 45314
- Home prices YoY
- -9.5%
- Active inventory
- 13
- Price-to-rent
- 10.3×
Monthly cashflow live
- Estimated rent
- $2,068 medium interval (Pro) →
- Mortgage (P&I)
- −$1,337
- Tax est. 1.5%
- −$319 /mo · $3,825/yr
- Insurance
- −$106
- HOA
- −$0
- Vacancy / Maint / Mgmt
- −$434
- Net cashflow
- $-128
Break-even live
UW: 25.0% down · 7.5% · 30yr · 1.5% tax · 5.0% vac · 8.0% maint · 8.0% mgmt
Financing live
Cash to close
- Down payment
- $63,750
- Closing costs
- $7,650
- Reserves months
- —
- Total cash needed
- —
Loan-product check · same deal, 3 products live
Conventional
25% down · 7.5% · 30yr
- Down + closing
- —
- Monthly P&I
- —
- Monthly cashflow
- —
- DSCR
- —
- Eligible?
- —
Personal DTI + credit; lowest rate.
DSCR
20% down · 8.5% · 30yr
- Down + closing
- —
- Monthly P&I
- —
- Monthly cashflow
- —
- DSCR
- —
- Eligible?
- —
No personal income docs; deal must DSCR.
Hard money
10% down · 12.0% · 12mo
- Down + closing
- —
- Monthly P&I
- —
- Monthly cashflow
- —
- DSCR
- —
- Eligible?
- —
Short-term bridge; refi at stabilization.
HOA detail condo
- Monthly dues
- $0 · $0/yr
- Likely covers
- water
- Assessments
- None detected in remarks — confirm with the listing agent.
Listing history 7 events
-
2026-05-26$255,000 Active
-
2012-03-08historical
-
2011-09-01historical
-
2011-08-23$145,900
-
2011-03-01$149,000
-
2011-01-12historical
-
2010-04-12$149,000
ⓘ Source: listings_history table (triggers on properties + properties_extension) + one-shot
backfill from property_details.listing_events for pre-trigger history.
Climate risk First Street
- Flood 1/10 Low FEMA zone X (unshaded) · 0% chance over 30 yrs
- Wildfire 1/10 Low
- Heat 3/10 Moderate 7 d/yr ≥99°F today · 19 d/yr by 30 yrs out
- Wind 2/10 Low 100% chance of damaging wind over 30 yrs
- Air quality 2/10 Low 1 unhealthy d/yr today · 2 by 30 yrs out
Nearby sold comps map
Loading sold comps map…
Walkable amenities ~0.75 mi
Loading nearby amenities…
Taxation est. · year 1
- Rental income
- $24,820
- − Mortgage interest
- −$14,284
- − Property taxes
- −$3,825
- − Insurance
- −$1,275
- − Repairs & maintenance
- −$1,986
- − Management
- −$1,986
- − Depreciation
- −$7,418
- Taxable loss
- −$5,954
- Est. tax savings @ 24.0%
- +$1,429
- After-tax cash flow
- $-111/yr
For passive investors: Depreciation is non-cash, so a rental often shows a tax loss while cash-flowing — sheltering income. Rental losses are passive: they offset passive income freely, and up to $25,000/yr can offset ordinary (W-2) income if you actively participate and your MAGI is under $100k (phasing out to $0 by $150k); unused losses carry forward. On sale, claimed depreciation is recaptured at up to 25%, and gains may owe capital-gains tax (a 1031 exchange can defer both). Figures are a year-1 estimate at your 24.0% rate — not tax advice; consult a CPA.
Schools (NCES district)
- District
- Cedar Cliff Local
- NCES district ID
- 3904725
- Math proficiency
- 67% ▼ -10.00%
- Reading proficiency
- 81% ▲ 1.00%
- Median HH income
- $57,872
- Composite
- 63.38/100
- National rank
- #624
- State rank
- #105 of 656 in OH
Livability — Cedarville
- Score
- 80/100
- State rank
- #122
- US rank
- #1797
Category grades
Schools grade is shown separately in the Schools card above.
Census & demographics
- Census place
- Cedarville, OH
- County
- Greene · 199,376 people
- Metro
- Dayton-Kettering-Beavercreek, OH
- Population (ZIP)
- 6,488
- Household income
- $87,366
- Rent vs Own
- Severe rent burden
- 9.5
Population outlook (Greene County) Hauer SSP2
- Today (2025)
- 170,301 people
- By 2030
- 171,840 · +0.9%
- By 2040
- 171,408 · +0.7%
- By 2050
- 167,806 · -1.5%
- By 2075
- 154,430 · -9.3%
- By 2100
- 138,669 · -18.6%
Race, ethnicity, and origin ACS 2023
- Neighborhood character
- Predominantly White (83%)
- Race & ethnicity
- White 83% Black 9% Two or more races 4% Asian 3% Hispanic / Latino 2%
- Common ancestry
- Slovak 7% Serbian 3% Italian 3%
- Foreign-born
- 6% · Canada, China
- Languages at home
- 95% English-only · Spanish 1% German/W. Germanic 1% Other Indo-European 1%
Political lean MEDSL · Greene
- 2024 margin
- R (+19.8) · D 39.5% · R 59.3% · Other 1.2%
- 2008→2024 swing
- -1.4pp toward R · 2008: -18.4pp · 2024: -19.8pp
- All cycles
- 2024: R+19.8 2020: R+19.5 2016: R+24.5 2012: R+21.8 2008: R+18.4
Not yet ingested
- Civics
- —
Market trends
- HPI YoY
- ▼ -27.20%
- Current HPI
- 258.5485
- Rent YoY
- —
- Metro
- —
- State GDP YoY
- ▲ 1.98%
- F500 in state
- 48
Industry mix (Fortune 500 HQ in OH)
| Industry | F500 HQs | Revenue |
|---|---|---|
| Insurance | 3 | $145B |
|
||
| Industrial Machinery | 3 | $49B |
|
||
| Financial Services | 3 | $24B |
|
||
| Consumer Goods | 2 | $93B |
|
||
| Aerospace / Defense | 2 | $47B |
|
||
| Utilities | 2 | $33B |
|
||
Price history
+71.1% since first listed7 events — show timeline
- 2026-05-26 Listed $255,000 FSBO.com
- 2012-03-08 Listing Removed — Cincy MLS
- 2011-09-01 Listing Removed — Dayton MLS
- 2011-08-23 Listed $145,900 Cincy MLS
- 2011-03-01 Listed $149,000 Dayton MLS
- 2011-01-12 Listing Removed — Dayton MLS
- 2010-04-12 Listed $149,000 Dayton MLS
Cash-flow waterfall
monthlySold comps — $/sqft
last 12 mo · ≤1 miLoading sold comps…